
Search
- Page Path
- HOME > Search
Original Article
- Clinical Study
Big Data Articles (National Health Insurance Service Database) - Variabilities in Weight and Waist Circumference and Risk of Myocardial Infarction, Stroke, and Mortality: A Nationwide Cohort Study
- Da Hye Kim, Ga Eun Nam, Kyungdo Han, Yang-Hyun Kim, Kye-Yeung Park, Hwan-Sik Hwang, Byoungduck Han, Sung Jung Cho, Seung Jin Jung, Yeo-Joon Yoon, Yong Kyun Roh, Kyung Hwan Cho, Yong Gyu Park
- Endocrinol Metab. 2020;35(4):933-942. Published online December 23, 2020
- DOI: https://doi.org/10.3803/EnM.2020.871
- 5,551 View
- 110 Download
- 15 Web of Science
- 16 Crossref
-
 Abstract
 PDF
PDF Supplementary Material
 PubReader
  ePub
ePub - Background
Evidence regarding the association between variabilities in obesity measures and health outcomes is limited. We aimed to examine the association between variabilities in obesity measures and cardiovascular outcomes and all-cause mortality.
Methods
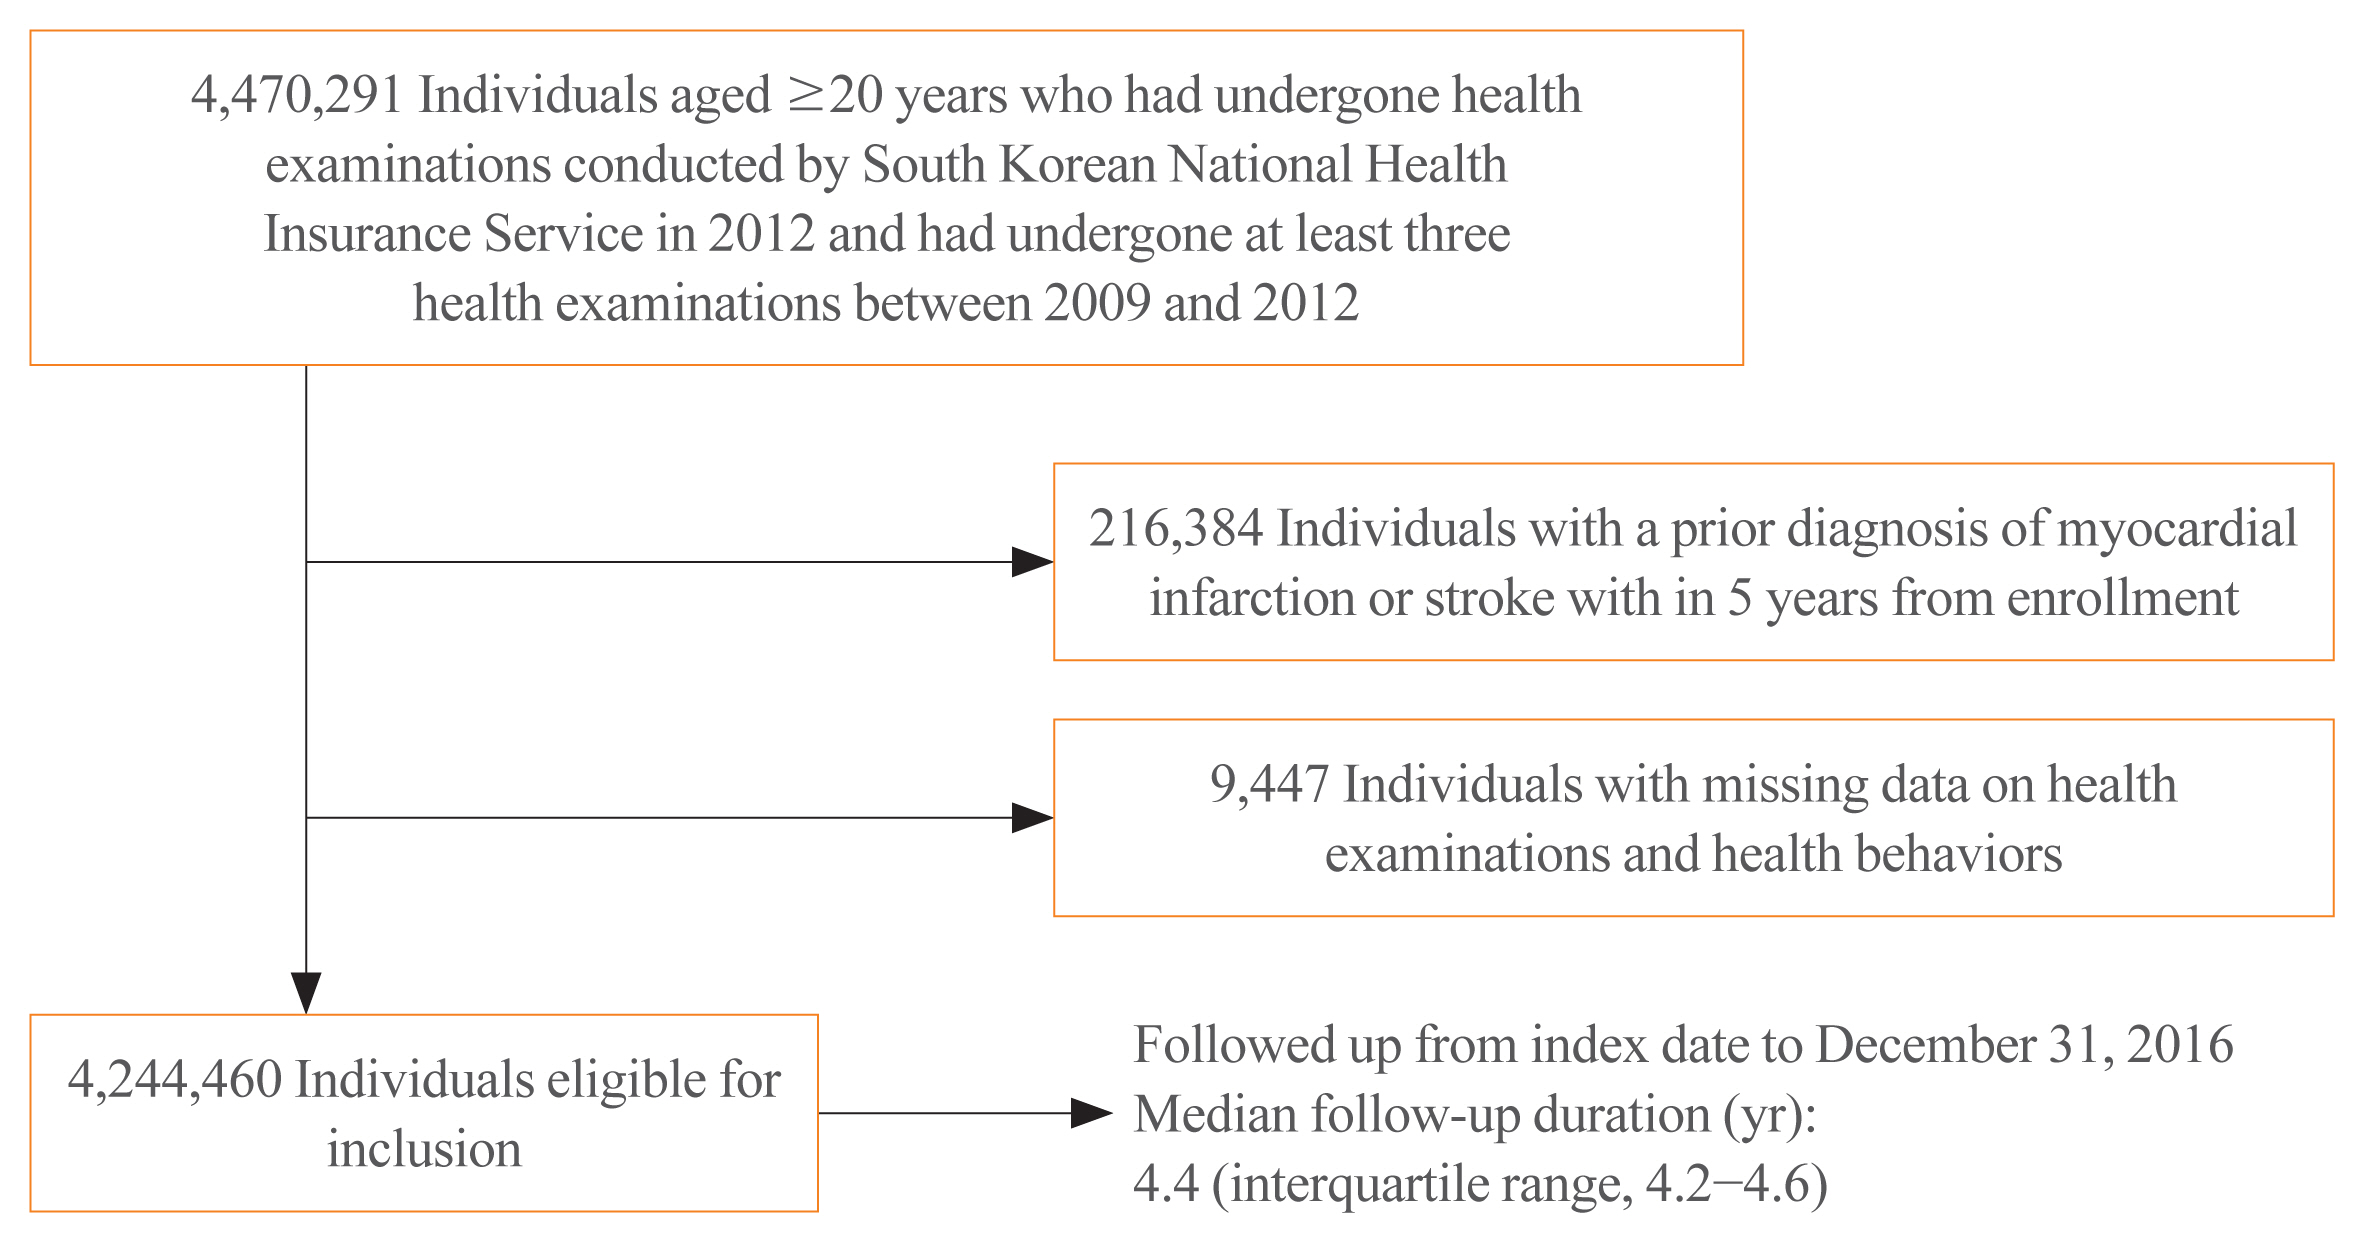
We identified 4,244,460 individuals who underwent health examination conducted by the Korean National Health Insurance Service during 2012, with ≥3 anthropometric measurements between 2009 and 2012. Variabilities in body weight (BW) and waist circumference (WC) were assessed using four indices including variability independent of the mean (VIM). We performed multivariable Cox proportional hazards regression analyses.
Results
During follow-up of 4.4 years, 16,095, 18,957, and 30,200 cases of myocardial infarction (MI), stroke, and all-cause mortality were recorded. Compared to individuals with the lowest quartiles, incrementally higher risks of study outcomes and those of stroke and all-cause mortality were observed among individuals in higher quartiles of VIM for BW and VIM for WC, respectively. The multivariable adjusted hazard ratios and 95% confidence intervals comparing the highest versus lowest quartile groups of VIM for BW were 1.17 (1.12 to 1.22) for MI, 1.20 (1.16 to 1.25) for stroke, and 1.66 (1.60 to 1.71) for all-cause mortality; 1.07 (1.03 to 1.12) for stroke and 1.29 (1.25 to 1.33) for all-cause mortality regarding VIM for WC. These associations were similar with respect to the other indices for variability.
Conclusion
This study revealed positive associations between variabilities in BW and WC and cardiovascular outcomes and allcause mortality. Our findings suggest that variabilities in obesity measures are associated with adverse health outcomes in the general population. -
Citations
Citations to this article as recorded by
- Gender differences in midlife to later-life cumulative burden and variability of obesity measures and risk of all-cause and cause-specific mortality
Karim Kohansal, Siamak Afaghi, Davood Khalili, Danial Molavizadeh, Farzad Hadaegh
International Journal of Obesity.2024; 48(4): 495. CrossRef - Association of body mass index and blood pressure variability with 10-year mortality and renal disease progression in type 2 diabetes
Stephen Fava, Sascha Reiff
Acta Diabetologica.2024;[Epub] CrossRef - Weight variability and cardiovascular outcomes: a systematic review and meta-analysis
Robert J. Massey, Moneeza K. Siddiqui, Ewan R. Pearson, Adem Y. Dawed
Cardiovascular Diabetology.2023;[Epub] CrossRef - Family history, waist circumference and risk of ischemic stroke: A prospective cohort study among Chinese adults
Lei Liu, Xiaojia Xue, Hua Zhang, Xiaocao Tian, Yunhui Chen, Yu Guo, Pei Pei, Shaojie Wang, Haiping Duan, Ruqin Gao, Zengchang Pang, Zhengming Chen, Liming Li
Nutrition, Metabolism and Cardiovascular Diseases.2023; 33(4): 758. CrossRef - Big Data Research in the Field of Endocrine Diseases Using the Korean National Health Information Database
Sun Wook Cho, Jung Hee Kim, Han Seok Choi, Hwa Young Ahn, Mee Kyoung Kim, Eun Jung Rhee
Endocrinology and Metabolism.2023; 38(1): 10. CrossRef - Weight variability and diabetes complications
Francesco Prattichizzo, Chiara Frigé, Rosalba La Grotta, Antonio Ceriello
Diabetes Research and Clinical Practice.2023; 199: 110646. CrossRef - Research on obesity using the National Health Information Database: recent trends
Eun-Jung Rhee
Cardiovascular Prevention and Pharmacotherapy.2023; 5(2): 35. CrossRef - Weight cycling and risk of clinical adverse events in patients with heart failure with preserved ejection fraction: a post-hoc analysis of TOPCAT
Yi Tan, Hang Guo, Ning Zhang, Keyang Zheng, Guifang Liu
Frontiers in Endocrinology.2023;[Epub] CrossRef - Weight variability, physical functioning and incident disability in older adults
Katie J. McMenamin, Tamara B. Harris, Joshua F. Baker
Journal of Cachexia, Sarcopenia and Muscle.2023; 14(4): 1648. CrossRef - Association between Variability of Metabolic Risk Factors and Cardiometabolic Outcomes
Min Jeong Park, Kyung Mook Choi
Diabetes & Metabolism Journal.2022; 46(1): 49. CrossRef - Effects of exercise initiation and smoking cessation after new-onset type 2 diabetes mellitus on risk of mortality and cardiovascular outcomes
Mee Kyoung Kim, Kyungdo Han, Bongsung Kim, Jinyoung Kim, Hyuk-Sang Kwon
Scientific Reports.2022;[Epub] CrossRef - Lipid cutoffs for increased cardiovascular disease risk in non-diabetic young people
Mee Kyoung Kim, Kyungdo Han, Hun-Sung Kim, Kun-Ho Yoon, Seung-Hwan Lee
European Journal of Preventive Cardiology.2022; 29(14): 1866. CrossRef - Body Mass Index Is Independently Associated with the Presence of Ischemia in Myocardial Perfusion Imaging
Chrissa Sioka, Paraskevi Zotou, Michail I. Papafaklis, Aris Bechlioulis, Konstantinos Sakellariou, Aidonis Rammos, Evangelia Gkika, Lampros Lakkas, Sotiria Alexiou, Pavlos Kekiopoulos, Katerina K. Naka, Christos Katsouras
Medicina.2022; 58(8): 987. CrossRef - Waist Circumference and Body Mass Index Variability and Incident Diabetic Microvascular Complications: A Post Hoc Analysis of ACCORD Trial
Daniel Nyarko Hukportie, Fu-Rong Li, Rui Zhou, Jia-Zhen Zheng, Xiao-Xiang Wu, Xian-Bo Wu
Diabetes & Metabolism Journal.2022; 46(5): 767. CrossRef - Nonalcoholic fatty liver disease and the risk of insulin-requiring gestational diabetes
Sang Youn You, Kyungdo Han, Seung-Hawn Lee, Mee Kyoung Kim
Diabetology & Metabolic Syndrome.2021;[Epub] CrossRef - Increased Risk of Nonalcoholic Fatty Liver Disease in Individuals with High Weight Variability
Inha Jung, Dae-Jeong Koo, Mi Yeon Lee, Sun Joon Moon, Hyemi Kwon, Se Eun Park, Eun-Jung Rhee, Won-Young Lee
Endocrinology and Metabolism.2021; 36(4): 845. CrossRef
- Gender differences in midlife to later-life cumulative burden and variability of obesity measures and risk of all-cause and cause-specific mortality

Review Article
- Obesity and Metabolism
- Effects of Cardiovascular Risk Factor Variability on Health Outcomes
- Seung-Hwan Lee, Mee Kyoung Kim, Eun-Jung Rhee
- Endocrinol Metab. 2020;35(2):217-226. Published online June 24, 2020
- DOI: https://doi.org/10.3803/EnM.2020.35.2.217

- 9,229 View
- 193 Download
- 26 Web of Science
- 28 Crossref
-
Abstract
PDFPubReader ePub
- Innumerable studies have suggested “the lower, the better” for cardiovascular risk factors, such as body weight, lipid profile, blood pressure, and blood glucose, in terms of health outcomes. However, excessively low levels of these parameters cause health problems, as seen in cachexia, hypoglycemia, and hypotension. Body weight fluctuation is related to mortality, diabetes, obesity, cardiovascular disease, and cancer, although contradictory findings have been reported. High lipid variability is associated with increased mortality and elevated risks of cardiovascular disease, diabetes, end-stage renal disease, and dementia. High blood pressure variability is associated with increased mortality, myocardial infarction, hospitalization, and dementia, which may be caused by hypotension. Furthermore, high glucose variability, which can be measured by continuous glucose monitoring systems or self-monitoring of blood glucose levels, is associated with increased mortality, microvascular and macrovascular complications of diabetes, and hypoglycemic events, leading to hospitalization. Variability in metabolic parameters could be affected by medications, such as statins, antihypertensives, and hypoglycemic agents, and changes in lifestyle patterns. However, other mechanisms modify the relationships between biological variability and various health outcomes. In this study, we review recent evidence regarding the role of variability in metabolic parameters and discuss the clinical implications of these findings.
-
Citations
Citations to this article as recorded by- Sex Differences in Low-Density Lipoprotein Cholesterol Treatment Among Young Israeli Patients Following Premature Acute Coronary Syndrome
Feras Haskiah, Karam Abdelhai, Ranin Hilu, Abid Khaskia
Metabolic Syndrome and Related Disorders.2024;[Epub] CrossRef - Long-term variability in physiological measures in relation to mortality and epigenetic aging: prospective studies in the USA and China
Hui Chen, Tianjing Zhou, Shaowei Wu, Yaying Cao, Geng Zong, Changzheng Yuan
BMC Medicine.2023;[Epub] CrossRef - Big Data Research in the Field of Endocrine Diseases Using the Korean National Health Information Database
Sun Wook Cho, Jung Hee Kim, Han Seok Choi, Hwa Young Ahn, Mee Kyoung Kim, Eun Jung Rhee
Endocrinology and Metabolism.2023; 38(1): 10. CrossRef - Relationship between Short- and Mid-Term Glucose Variability and Blood Pressure Profile Parameters: A Scoping Review
Elena Vakali, Dimitrios Rigopoulos, Petros C. Dinas, Ioannis-Alexandros Drosatos, Aikaterini G. Theodosiadi, Andriani Vazeou, George Stergiou, Anastasios Kollias
Journal of Clinical Medicine.2023; 12(6): 2362. CrossRef - Lipid treatment status and goal attainment among patients with premature acute coronary syndrome in Israel
Feras Haskiah, Abid Khaskia
Journal of Clinical Lipidology.2023; 17(3): 367. CrossRef - Research on obesity using the National Health Information Database: recent trends
Eun-Jung Rhee
Cardiovascular Prevention and Pharmacotherapy.2023; 5(2): 35. CrossRef - Risk of fracture according to temporal changes of low body weight changes in adults over 40 years: a nationwide population-based cohort study
Jung Guel Kim, Jae-Young Hong, Jiwon Park, Sang-Min Park, Kyungdo Han, Ho-Joong Kim, Jin S. Yeom
BMC Public Health.2023;[Epub] CrossRef - Factors Affecting High Body Weight Variability
Kyungdo Han, Mee Kyoung Kim
Journal of Obesity & Metabolic Syndrome.2023; 32(2): 163. CrossRef - Puerarin Attenuates High-Glucose and High-Lipid-Induced Inflammatory Injury in H9c2 Cardiomyocytes via CAV3 Protein Upregulation
YiFu Tian, CaiXia Zhou, XiaoYang Bu, Qian Lv, Qin Huang
Journal of Inflammation Research.2023; Volume 16: 2707. CrossRef - Visit-to-Visit Glucose Variability, Cognition, and Global Cognitive Decline: The Multi-Ethnic Study of Atherosclerosis
Christopher L Schaich, Michael P Bancks, Kathleen M Hayden, Jingzhong Ding, Stephen R Rapp, Alain G Bertoni, Susan R Heckbert, Timothy M Hughes, Morgana Mongraw-Chaffin
The Journal of Clinical Endocrinology & Metabolism.2023; 109(1): e243. CrossRef - Association between lipid variability and the risk of mortality in cancer patients not receiving lipid-lowering agents
Seohyun Kim, Gyuri Kim, So Hyun Cho, Rosa Oh, Ji Yoon Kim, You-Bin Lee, Sang-Man Jin, Kyu Yeon Hur, Jae Hyeon Kim
Frontiers in Oncology.2023;[Epub] CrossRef - The Association of Postprandial Triglyceride Variability with Renal Dysfunction and Microalbuminuria in Patients with Type 2 Diabetic Mellitus: A Retrospective and Observational Study
Natsumi Matsuoka-Uchiyama, Haruhito A. Uchida, Shugo Okamoto, Yasuhiro Onishi, Katsuyoshi Katayama, Mariko Tsuchida-Nishiwaki, Hidemi Takeuchi, Rika Takemoto, Yoshiko Hada, Ryoko Umebayashi, Naoko Kurooka, Kenji Tsuji, Jun Eguchi, Hirofumi Nakajima, Kenic
Journal of Diabetes Research.2022; 2022: 1. CrossRef - Associations of variability in body weight and glucose levels with the risk of hip fracture in people with diabetes
Jeongmin Lee, Kyungdo Han, Sang Hyun Park, Mee Kyoung Kim, Dong-Jun Lim, Kun-Ho Yoon, Moo-Il Kang, Seung-Hwan Lee
Metabolism.2022; 129: 155135. CrossRef - The Influence of Obesity and Metabolic Health on Vascular Health
Eun-Jung Rhee
Endocrinology and Metabolism.2022; 37(1): 1. CrossRef - Variability of Metabolic Risk Factors: Causative Factor or Epiphenomenon?
Hye Jin Yoo
Diabetes & Metabolism Journal.2022; 46(2): 257. CrossRef - Changes in Underweight Status and Risk of Hip Fracture: A Korean Nationwide Population-Based Cohort Study
Sangsoo Han, Jiwon Park, Hae-Dong Jang, Kyungdo Han, Choungah Lee, Wonseok Kim, Jae-Young Hong
Journal of Clinical Medicine.2022; 11(7): 1913. CrossRef - Dynamic physical examination indicators of cardiovascular health: A single-center study in Shanghai, China
Rongren Kuang, Yiling Liao, Xinhan Xie, Biao Li, Xiaojuan Lin, Qiang Liu, Xiang Liu, Wenya Yu, Yajing Wang
PLOS ONE.2022; 17(5): e0268358. CrossRef - Characteristics and Clinical Course of Diabetes of the Exocrine Pancreas: A Nationwide Population-Based Cohort Study
Nami Lee, So Jeong Park, Dongwoo Kang, Ja Young Jeon, Hae Jin Kim, Dae Jung Kim, Kwan-Woo Lee, Edward J. Boyko, Seung Jin Han
Diabetes Care.2022; 45(5): 1141. CrossRef - Lipid Variability and Risk of Cardiovascular Diseases and All-Cause Mortality: A Systematic Review and Meta-Analysis of Cohort Studies
Shuting Li, Leying Hou, Siyu Zhu, Qian Yi, Wen Liu, Yang Zhao, Feitong Wu, Xue Li, An Pan, Peige Song
Nutrients.2022; 14(12): 2450. CrossRef - Impact of Visit-to-Visit Triglyceride-Glucose Index Variability on the Risk of Cardiovascular Disease in the Elderly
Fei Chen, Ying Pan, Ziqing Liu, Rong Huang, Jing Wang, Jian Shao, Yaqin Gong, Xiyi Sun, Xiaobo Jiang, Weihao Wang, Zhaoqiang Li, Shao Zhong, Qi Pan, Kaixin Zhou, Muhammad Furqan Akhtar
International Journal of Endocrinology.2022; 2022: 1. CrossRef - Fenofibrate add-on to statin treatment is associated with low all-cause death and cardiovascular disease in the general population with high triglyceride levels
Kyung-Soo Kim, Sangmo Hong, Kyungdo Han, Cheol-Young Park
Metabolism.2022; 137: 155327. CrossRef - Mean versus variability of lipid measurements over 6 years and incident cardiovascular events: More than a decade follow-up
Soroush Masrouri, Leila Cheraghi, Niloofar Deravi, Neda Cheraghloo, Maryam Tohidi, Fereidoun Azizi, Farzad Hadaegh
Frontiers in Cardiovascular Medicine.2022;[Epub] CrossRef - Long-Term Variability in Physiological Measures in Relation to Mortality and Epigenetic Aging: Prospective Studies in the US and China
Hui Chen, Tianjing Zhou, Shaowei Wu, Yaying Cao, Geng Zong, Changzheng Yuan
SSRN Electronic Journal .2022;[Epub] CrossRef - Acute Glucose Shift Induces the Activation of the NLRP3 Inflammasome in THP-1 Cells
Ji Yeon Lee, Yup Kang, Hae Jin Kim, Dae Jung Kim, Kwan Woo Lee, Seung Jin Han
International Journal of Molecular Sciences.2021; 22(18): 9952. CrossRef - Body Weight Change and Cardiovascular Disease: Effect of Weight Gain, Weight Loss, and Weight Cycling
Jung-Hwan Cho, Eun-Jung Rhee, Won-Young Lee
Cardiovascular Prevention and Pharmacotherapy.2021; 3(4): 73. CrossRef - Fasting Glucose Variability as a Risk Indicator for End-Stage Kidney Disease in Patients with Diabetes: A Nationwide Population-Based Study
Da Young Lee, Jaeyoung Kim, Sanghyun Park, So Young Park, Ji Hee Yu, Ji A. Seo, Nam Hoon Kim, Hye Jin Yoo, Sin Gon Kim, Kyung Mook Choi, Sei Hyun Baik, Kyungdo Han, Nan Hee Kim
Journal of Clinical Medicine.2021; 10(24): 5948. CrossRef - Characteristics and Clinical Course of Diabetes of the Exocrine Pancreas: A Nationwide Population-Based Cohort Studybrief Title: Diabetes of the Exocrine Pancreas
Nami Lee, So Jeong Park, Dongwoo Kang, Ja Young Jeon, Hae Jin Kim, Dae Jung Kim, Kwan-Woo Lee, Edward J. Boyko, Seung Jin Han
SSRN Electronic Journal .2021;[Epub] CrossRef - Validation of a wearable cuff-less wristwatch-type blood pressure monitoring device
Joon Ho Moon, Myung-Kyun Kang, Chang-Eun Choi, Jeonghee Min, Hae-Young Lee, Soo Lim
Scientific Reports.2020;[Epub] CrossRef
- Sex Differences in Low-Density Lipoprotein Cholesterol Treatment Among Young Israeli Patients Following Premature Acute Coronary Syndrome
Original Articles
- Effects of Vildagliptin or Pioglitazone on Glycemic Variability and Oxidative Stress in Patients with Type 2 Diabetes Inadequately Controlled with Metformin Monotherapy: A 16-Week, Randomised, Open Label, Pilot Study
- Nam Hoon Kim, Dong-Lim Kim, Kyeong Jin Kim, Nan Hee Kim, Kyung Mook Choi, Sei Hyun Baik, Sin Gon Kim
- Endocrinol Metab. 2017;32(2):241-247. Published online June 23, 2017
- DOI: https://doi.org/10.3803/EnM.2017.32.2.241
- 4,629 View
- 94 Download
- 23 Web of Science
- 23 Crossref
-
Abstract
PDFPubReader
Background Glycemic variability is associated with the development of diabetic complications through the activation of oxidative stress. This study aimed to evaluate the effects of a dipeptidyl peptidase 4 inhibitor, vildagliptin, or a thiazolidinedione, pioglitazone, on glycemic variability and oxidative stress in patients with type 2 diabetes.
Methods In this open label, randomised, active-controlled, pilot trial, individuals who were inadequately controlled with metformin monotherapy were assigned to either vildagliptin (50 mg twice daily,
n =17) or pioglitazone (15 mg once daily,n =14) treatment groups for 16 weeks. Glycemic variability was assessed by calculating the mean amplitude of glycemic excursions (MAGE), which was obtained from continuous glucose monitoring. Urinary 8-iso prostaglandin F2α, serum oxidised low density lipoprotein, and high-sensitivity C-reactive protein were used as markers of oxidative stress or inflammation.Results Both vildagliptin and pioglitazone significantly reduced glycated hemoglobin and mean plasma glucose levels during the 16-week treatment. Vildagliptin also significantly reduced the MAGE (from 93.8±38.0 to 70.8±19.2 mg/dL,
P =0.046), and mean standard deviation of 24 hours glucose (from 38±17.3 to 27.7±6.9,P =0.026); however, pioglitazone did not, although the magnitude of decline was similar in both groups. Markers of oxidative stress or inflammation including urinary 8-iso prostaglandin F2α did not change after treatment in both groups.Conclusion In this 16-week treatment trial, vildagliptin, but not pioglitazone, reduced glycemic variability in individuals with type 2 diabetes who was inadequately controlled with metformin monotherapy, although a reduction of oxidative stress markers was not observed.
-
Citations
Citations to this article as recorded by- What is Glycaemic Variability and which Pharmacological Treatment Options are Effective? A Narrative Review
Juan Miguel Huertas Cañas, Maria Alejandra Gomez Gutierrez, Andres Bedoya Ossa
European Endocrinology.2023; 19(2): 4. CrossRef - Glycemic Variability, Glycated Hemoglobin, and Cardiovascular Complications: Still a Dilemma in Clinical Practice
Antonio Ceriello, Ali A. Rizvi, Manfredi Rizzo
Advances in Therapy.2022; 39(1): 1. CrossRef - Contrasting Three Non-hypoglycemic Antidiabetic Drug Effects on Glycemic Control in Newly Diagnosed Type II Diabetes Mellitus: An Experimental Study
Abdulhamza Hmood, Mohammed Almasoody, Hameed Hussein Al-Jameel
Open Access Macedonian Journal of Medical Sciences.2022; 10(B): 506. CrossRef - Hypoglycemic agents and glycemic variability in individuals with type 2 diabetes: A systematic review and network meta-analysis
SuA Oh, Sujata Purja, Hocheol Shin, Minji Kim, Eunyoung Kim
Diabetes and Vascular Disease Research.2022; 19(3): 147916412211068. CrossRef - Influence of dipeptidyl peptidase-4 inhibitors on glycemic variability in patients with type 2 diabetes: A meta-analysis of randomized controlled trials
Shangyu Chai, Ruya Zhang, Ye Zhang, Richard David Carr, Yiman Zheng, Swapnil Rajpathak, Miao Yu
Frontiers in Endocrinology.2022;[Epub] CrossRef - Comparison of Efficacy of Glimepiride, Alogliptin, and Alogliptin-Pioglitazone as the Initial Periods of Therapy in Patients with Poorly Controlled Type 2 Diabetes Mellitus: An Open-Label, Multicenter, Randomized, Controlled Study
Hae Jin Kim, In Kyung Jeong, Kyu Yeon Hur, Soo-Kyung Kim, Jung Hyun Noh, Sung Wan Chun, Eun Seok Kang, Eun-Jung Rhee, Sung Hee Choi
Diabetes & Metabolism Journal.2022; 46(5): 689. CrossRef - Effect of low dose allopurinol on glycemic control and glycemic variability in patients with type 2 diabetes mellitus: A cross-sectional study
Manal M. Alem
Heliyon.2022; 8(11): e11549. CrossRef - Effect of hydroxychloroquine on glycemic variability in type 2 diabetes patients uncontrolled on glimepiride and metformin therapy
Rajesh Rajput, Suyasha Saini, Siddhant Rajput, Parankush Upadhyay
Indian Journal of Endocrinology and Metabolism.2022; 26(6): 537. CrossRef - Effect of Dapagliflozin as an Add-on Therapy to Insulin on the Glycemic Variability in Subjects with Type 2 Diabetes Mellitus (DIVE): A Multicenter, Placebo-Controlled, Double-Blind, Randomized Study
Seung-Hwan Lee, Kyung-Wan Min, Byung-Wan Lee, In-Kyung Jeong, Soon-Jib Yoo, Hyuk-Sang Kwon, Yoon-Hee Choi, Kun-Ho Yoon
Diabetes & Metabolism Journal.2021; 45(3): 339. CrossRef - Comprehensive elaboration of glycemic variability in diabetic macrovascular and microvascular complications
Bao Sun, Zhiying Luo, Jiecan Zhou
Cardiovascular Diabetology.2021;[Epub] CrossRef - CGMS and Glycemic Variability, Relevance in Clinical Research to Evaluate Interventions in T2D, a Literature Review
Anne-Esther Breyton, Stéphanie Lambert-Porcheron, Martine Laville, Sophie Vinoy, Julie-Anne Nazare
Frontiers in Endocrinology.2021;[Epub] CrossRef - Efficacy and safety profile of sitagliptin, vildagliptin, and metformin in newly diagnosed type 2 diabetic subjects
Sahar Hossam Elhini, Amal K. Hussien, Ahmed Abd Elsamie Omran, Asmaa A. Elsayed, Haitham saeed
Clinical and Experimental Pharmacology and Physiology.2021; 48(12): 1589. CrossRef - Vildagliptin ameliorates renal injury in type 2 diabetic rats by suppressing oxidative stress
Fariba Aghahoseini, Alireza Alihemmati, Leila Hosseini, Reza Badalzadeh
Journal of Diabetes & Metabolic Disorders.2020; 19(2): 701. CrossRef - Small changes in glucose variability induced by low and high glycemic index diets are not associated with changes in β-cell function in adults with pre-diabetes
Kristina M. Utzschneider, Tonya N. Johnson, Kara L. Breymeyer, Lisa Bettcher, Daniel Raftery, Katherine M. Newton, Marian L. Neuhouser
Journal of Diabetes and its Complications.2020; 34(8): 107586. CrossRef - Comparison of the effects of gemigliptin and dapagliflozin on glycaemic variability in type 2 diabetes: A randomized, open‐label, active‐controlled, 12‐week study (STABLE II study)
Soo Heon Kwak, You‐Cheol Hwang, Jong Chul Won, Ji Cheol Bae, Hyun Jin Kim, Sunghwan Suh, Eun Young Lee, Subin Lee, Sang‐Yong Kim, Jae Hyeon Kim
Diabetes, Obesity and Metabolism.2020; 22(2): 173. CrossRef - Glycemic variability: adverse clinical outcomes and how to improve it?
Zheng Zhou, Bao Sun, Shiqiong Huang, Chunsheng Zhu, Meng Bian
Cardiovascular Diabetology.2020;[Epub] CrossRef - Anti-inflammatory properties of antidiabetic drugs: A “promised land” in the COVID-19 era?
Niki Katsiki, Ele Ferrannini
Journal of Diabetes and its Complications.2020; 34(12): 107723. CrossRef - Impact of long-term glucose variability on coronary atherosclerosis progression in patients with type 2 diabetes: a 2.3 year follow-up study
Suhua Li, Xixiang Tang, Yanting Luo, Bingyuan Wu, Zhuoshan Huang, Zexiong Li, Long Peng, Yesheng Ling, Jieming Zhu, Junlin Zhong, Jinlai Liu, Yanming Chen
Cardiovascular Diabetology.2020;[Epub] CrossRef - Visit-to-visit fasting plasma glucose variability is an important risk factor for long-term changes in left cardiac structure and function in patients with type 2 diabetes
Xixiang Tang, Junlin Zhong, Hui Zhang, Yanting Luo, Xing Liu, Long Peng, Yanling Zhang, Xiaoxian Qian, Boxiong Jiang, Jinlai Liu, Suhua Li, Yanming Chen
Cardiovascular Diabetology.2019;[Epub] CrossRef - Effect of dipeptidyl-peptidase-4 inhibitors on C-reactive protein in patients with type 2 diabetes: a systematic review and meta-analysis
Xin Liu, Peng Men, Bo Wang, Gaojun Cai, Zhigang Zhao
Lipids in Health and Disease.2019;[Epub] CrossRef - Efficacy and Safety of Pioglitazone Monotherapy in Type 2 Diabetes Mellitus: A Systematic Review and Meta-Analysis of Randomised Controlled Trials
Fahmida Alam, Md. Asiful Islam, Mafauzy Mohamed, Imran Ahmad, Mohammad Amjad Kamal, Richard Donnelly, Iskandar Idris, Siew Hua Gan
Scientific Reports.2019;[Epub] CrossRef - Effect of DPP-IV Inhibitors on Glycemic Variability in Patients with T2DM: A Systematic Review and Meta-Analysis
Subin Lee, Heeyoung Lee, Yoonhye Kim, EunYoung Kim
Scientific Reports.2019;[Epub] CrossRef - Glycemic Variability: How to Measure and Its Clinical Implication for Type 2 Diabetes
Guillermo E. Umpierrez, Boris P. Kovatchev
The American Journal of the Medical Sciences.2018; 356(6): 518. CrossRef
- What is Glycaemic Variability and which Pharmacological Treatment Options are Effective? A Narrative Review
- Clinical Study
- 1,5-Anhydro-D-Glucitol Could Reflect Hypoglycemia Risk in Patients with Type 2 Diabetes Receiving Insulin Therapy
- Min Kyeong Kim, Hye Seung Jung, Soo Heon Kwak, Young Min Cho, Kyong Soo Park, Seong Yeon Kim
- Endocrinol Metab. 2016;31(2):284-291. Published online May 27, 2016
- DOI: https://doi.org/10.3803/EnM.2016.31.2.284
- 4,375 View
- 41 Download
- 4 Web of Science
- 5 Crossref
-
Abstract
PDFPubReader
Background The identification of a marker for hypoglycemia could help patients achieve strict glucose control with a lower risk of hypoglycemia. 1,5-Anhydro-D-glucitol (1,5-AG) reflects postprandial hyperglycemia in patients with well-controlled diabetes, which contributes to glycemic variability. Because glycemic variability is related to hypoglycemia, we aimed to evaluate the value of 1,5-AG as a marker of hypoglycemia.
Methods We enrolled 18 adults with type 2 diabetes mellitus (T2DM) receiving insulin therapy and assessed the occurrence of hypoglycemia within a 3-month period. We measured 1,5-AG level, performed a survey to score the severity of hypoglycemia, and applied a continuous glucose monitoring system (CGMS).
Results 1,5-AG was significantly lower in the high hypoglycemia-score group compared to the low-score group. Additionally, the duration of insulin treatment was significantly longer in the high-score group. Subsequent analyses were adjusted by the duration of insulin treatment and mean blood glucose, which was closely associated with both 1,5-AG level and hypoglycemia risk. In adjusted correlation analyses, 1,5-AG was negatively correlated with hypoglycemia score, area under the curve at 80 mg/dL, and low blood glucose index during CGMS (
P =0.068,P =0.033, andP =0.060, respectively).Conclusion 1,5-AG level was negatively associated with hypoglycemia score determined by recall and with documented hypoglycemia after adjusting for mean glucose and duration of insulin treatment. As a result, this level could be a marker of the risk of hypoglycemia in patients with well-controlled T2DM receiving insulin therapy.
-
Citations
Citations to this article as recorded by- Mobile Healthcare System Provided by Primary Care Physicians Improves Quality of Diabetes Care
Tae Jung Oh, Jie-Eun Lee, Seok Kim, Sooyoung Yoo, Hak Chul Jang
CardioMetabolic Syndrome Journal.2021; 1(1): 88. CrossRef - Effects of mobile phone application combined with or without self‐monitoring of blood glucose on glycemic control in patients with diabetes: A randomized controlled trial
Yuan Yu, Qun Yan, Huizhi Li, Hongmei Li, Lin Wang, Hua Wang, Yiyun Zhang, Lei Xu, Zhaosheng Tang, Xinfeng Yan, Yinghua Chen, Huili He, Jie Chen, Bo Feng
Journal of Diabetes Investigation.2019; 10(5): 1365. CrossRef - Articles inEndocrinology and Metabolismin 2016
Won-Young Lee
Endocrinology and Metabolism.2017; 32(1): 62. CrossRef - A Diet Diverse in Bamboo Parts is Important for Giant Panda (Ailuropoda melanoleuca) Metabolism and Health
Hairui Wang, Heju Zhong, Rong Hou, James Ayala, Guangmang Liu, Shibin Yuan, Zheng Yan, Wenping Zhang, Yuliang Liu, Kailai Cai, Zhigang Cai, He Huang, Zhihe Zhang, De Wu
Scientific Reports.2017;[Epub] CrossRef - Low and exacerbated levels of 1,5-anhydroglucitol are associated with cardiovascular events in patients after first-time elective percutaneous coronary intervention
Shuhei Takahashi, Kazunori Shimada, Katsumi Miyauchi, Tetsuro Miyazaki, Eiryu Sai, Manabu Ogita, Shuta Tsuboi, Hiroshi Tamura, Shinya Okazaki, Tomoyuki Shiozawa, Shohei Ouchi, Tatsuro Aikawa, Tomoyasu Kadoguchi, Hamad Al Shahi, Takuma Yoshihara, Makoto Hi
Cardiovascular Diabetology.2016;[Epub] CrossRef
- Mobile Healthcare System Provided by Primary Care Physicians Improves Quality of Diabetes Care
- Obesity and Metabolism
- Factors Associated with Glycemic Variability in Patients with Type 2 Diabetes: Focus on Oral Hypoglycemic Agents and Cardiovascular Risk Factors
- Soyeon Yoo, Sang-Ouk Chin, Sang-Ah Lee, Gwanpyo Koh
- Endocrinol Metab. 2015;30(3):352-360. Published online August 4, 2015
- DOI: https://doi.org/10.3803/EnM.2015.30.3.352
- 3,873 View
- 46 Download
- 9 Web of Science
- 9 Crossref
-
Abstract
PDFSupplementary MaterialPubReader
Background The role of glycemic variability (GV) in development of cardiovascular diseases remains controversial, and factors that determine glucose fluctuation in patients with diabetes are unknown. We investigated relationships between GV indices, kinds of oral hypoglycemic agents (OHAs), and cardiovascular risk factors in patients with type 2 diabetes mellitus (T2DM).
Methods We analyzed 209 patients with T2DM. The GV index (standard deviation [SD] and mean absolute glucose change [MAG]) were calculated from 7-point self-monitoring of blood glucose profiles. The patients were classified into four groups according to whether they take OHAs known as GV-lowering (A) and GV-increasing (B): 1 (A only), 2 (neither), 3 (both A and B), and 4 (B only). The 10-year risk for atherosclerotic cardiovascular disease (ASCVD) was calculated using the Pooled Cohort Equations.
Results GV indices were significantly higher in patients taking sulfonylureas (SUs), but lower in those taking dipeptidyl peptidase-4 inhibitors. In hierarchical regression analysis, the use of SUs remained independent correlates of the SD (β=0.209,
P =0.009) and MAG (β=0.214,P =0.011). In four OHA groups, GV indices increased progressively from group 1 to group 4. However, these did not differ according to quartiles of 10-year ASCVD risk.Conclusion GV indices correlated significantly with the use of OHAs, particularly SU, and differed significantly according to combination of OHAs. However, cardiovascular risk factors and 10-year ASCVD risk were not related to GV indices. These findings suggest that GV is largely determined by properties of OHAs and not to cardiovascular complications in patients with T2DM.
-
Citations
Citations to this article as recorded by- Prognostic value of longitudinal HbA1c variability in predicting the development of diabetic sensorimotor polyneuropathy among patients with type 2 diabetes mellitus: A prospective cohort observational study
Yun‐Ru Lai, Wen‐Chan Chiu, Chih‐Cheng Huang, Ben‐Chung Cheng, I‐Hsun Yu, Chia‐Te Kung, Ting Yin Lin, Hui Ching Chiang, Chun‐En Aurea Kuo, Cheng‐Hsien Lu
Journal of Diabetes Investigation.2024; 15(3): 326. CrossRef - Influence of dipeptidyl peptidase-4 inhibitors on glycemic variability in patients with type 2 diabetes: A meta-analysis of randomized controlled trials
Shangyu Chai, Ruya Zhang, Ye Zhang, Richard David Carr, Yiman Zheng, Swapnil Rajpathak, Miao Yu
Frontiers in Endocrinology.2022;[Epub] CrossRef - Glycemic Variability in Subjects with Diabetes and Hypogonadism during Testosterone Replacement Treatment: A Pilot Study
Giuseppe Defeudis, Ernesto Maddaloni, Giovanni Rossini, Alfonso Maria Di Tommaso, Rossella Mazzilli, Paolo Di Palma, Paolo Pozzilli, Nicola Napoli
Journal of Clinical Medicine.2022; 11(18): 5333. CrossRef - New Insights into the Role of Visit-to-Visit Glycemic Variability and Blood Pressure Variability in Cardiovascular Disease Risk
Jin J. Zhou, Daniel S. Nuyujukian, Peter D. Reaven
Current Cardiology Reports.2021;[Epub] CrossRef - Prevalence of glycemic variability and factors associated with the glycemic arrays among end-stage kidney disease patients on chronic hemodialysis
Abdul Hanif Khan Yusof Khan, Nor Fadhlina Zakaria, Muhammad Adil Zainal Abidin, Nor Azmi Kamaruddin
Medicine.2021; 100(30): e26729. CrossRef - Dipeptidyl-Peptidase-IV Inhibitors, Imigliptin and Alogliptin, Improve Beta-Cell Function in Type 2 Diabetes
Xu Liu, Yang Liu, Hongzhong Liu, Haiyan Li, Jianhong Yang, Pei Hu, Xinhua Xiao, Dongyang Liu
Frontiers in Endocrinology.2021;[Epub] CrossRef - HbA 1C variability and hypoglycemia hospitalization in adults with type 1 and type 2 diabetes: A nested case-control study
Victor W. Zhong, Juhaeri Juhaeri, Stephen R. Cole, Christina M. Shay, Penny Gordon-Larsen, Evangelos Kontopantelis, Elizabeth J. Mayer-Davis
Journal of Diabetes and its Complications.2018; 32(2): 203. CrossRef - Glucose fluctuation and the resultant endothelial injury are correlated with pancreatic β cell dysfunction in patients with coronary artery disease
Makoto Murata, Hitoshi Adachi, Shigeru Oshima, Masahiko Kurabayashi
Diabetes Research and Clinical Practice.2017; 131: 107. CrossRef - Efficacy of lifestyle interventions in patients with type 2 diabetes: A systematic review and meta-analysis
Xiao-Li Huang, Jian-Hua Pan, Dan Chen, Jing Chen, Fang Chen, Tao-Tao Hu
European Journal of Internal Medicine.2016; 27: 37. CrossRef
- Prognostic value of longitudinal HbA1c variability in predicting the development of diabetic sensorimotor polyneuropathy among patients with type 2 diabetes mellitus: A prospective cohort observational study
Review Article
- Obesity and Metabolism
- Clinical Implications of Glucose Variability: Chronic Complications of Diabetes
- Hye Seung Jung
- Endocrinol Metab. 2015;30(2):167-174. Published online June 30, 2015
- DOI: https://doi.org/10.3803/EnM.2015.30.2.167
- 5,767 View
- 95 Download
- 66 Web of Science
- 68 Crossref
-
Abstract
PDFPubReader
Glucose variability has been identified as a potential risk factor for diabetic complications; oxidative stress is widely regarded as the mechanism by which glycemic variability induces diabetic complications. However, there remains no generally accepted gold standard for assessing glucose variability. Representative indices for measuring intraday variability include calculation of the standard deviation along with the mean amplitude of glycemic excursions (MAGE). MAGE is used to measure major intraday excursions and is easily measured using continuous glucose monitoring systems. Despite a lack of randomized controlled trials, recent clinical data suggest that long-term glycemic variability, as determined by variability in hemoglobin A1c, may contribute to the development of microvascular complications. Intraday glycemic variability is also suggested to accelerate coronary artery disease in high-risk patients.
-
Citations
Citations to this article as recorded by- A randomized trial on the effect of transcutaneous electrical nerve stimulator on glycemic control in patients with type 2 diabetes
Jin-Ying Lu, Horng-Yih Ou, Chung-Ze Wu, Chwen-Yi Yang, Ju-Ying Jiang, Chieh-Hsiang Lu, Yi-Der Jiang, Tien-Jyun Chang, Yi-Cheng Chang, Meng-Lun Hsieh, Wan-Chen Wu, Hung-Yuan Li, Ye-Fong Du, Ching-Han Lin, Hao-Chang Hung, Kai-Jen Tien, Nai-Cheng Yeh, Shang-
Scientific Reports.2023;[Epub] CrossRef - Association between initial in-hospital heart rate and glycemic control in patients with acute ischemic stroke and diabetes mellitus
Ya-Wen Kuo, Jiann-Der Lee, Chuan-Pin Lee, Yen-Chu Huang, Meng Lee
BMC Endocrine Disorders.2023;[Epub] CrossRef - Practical Application of Continuous Glucose Monitoring in Clinical Practice: Case Studies
Jeff Unger, Denise R. Franco
Diabetes Technology & Therapeutics.2023; 25(S3): S-21. CrossRef - Comparison of Glycemia Risk Index with Time in Range for Assessing Glycemic Quality
Ji Yoon Kim, Jee Hee Yoo, Jae Hyeon Kim
Diabetes Technology & Therapeutics.2023; 25(12): 883. CrossRef - Personalized diabetes monitoring platform leveraging IoMT and AI for non-invasive estimation
Durga Padmavilochanan, Rahul Krishnan Pathinarupothi, K.A. Unnikrishna Menon, Harish Kumar, Ramesh Guntha, Maneesha V. Ramesh, P. Venkat Rangan
Smart Health.2023; 30: 100428. CrossRef - Acute effects of drinks containing blackcurrant and citrus (poly)phenols and dietary fibre on postprandial glycaemia, gut hormones, cognitive function and appetite in healthy adults: two randomised controlled trials
Ana M. Pinto, Mark R. Hobden, Katherine D. Brown, Jonathan Farrimond, Darren Targett, Christopher P. Corpe, Peter R. Ellis, Yvanna Todorova, Klaudia Socha, Shatha Bahsoon, Claudia Haworth, Morgane Marcel, Xirui Nie, Wendy L. Hall
Food & Function.2023; 14(22): 10163. CrossRef - Metabolomics in diabetes mellitus: clinical insight
Shereen M. Aleidi, Hiba Al Fahmawi, Afshan Masood, Anas Abdel Rahman
Expert Review of Proteomics.2023; 20(12): 451. CrossRef - Effects of Teneligliptin on HbA1c levels, Continuous Glucose Monitoring-Derived Time in Range and Glycemic Variability in Elderly Patients with T2DM (TEDDY Study)
Ji Cheol Bae, Soo Heon Kwak, Hyun Jin Kim, Sang-Yong Kim, You-Cheol Hwang, Sunghwan Suh, Bok Jin Hyun, Ji Eun Cha, Jong Chul Won, Jae Hyeon Kim
Diabetes & Metabolism Journal.2022; 46(1): 81. CrossRef - Glycemic Variability and Diabetes Mellitus
Han Na Jang, Hye Seung Jung
The Journal of Korean Diabetes.2022; 23(1): 12. CrossRef - Comparison of the Impact of Insulin Degludec U100 and Insulin Glargine U300 on Glycemic Variability and Oxidative Stress in Insulin-Naive Patients With Type 2 Diabetes Mellitus: Pilot Study for a Randomized Trial
Pavle Vrebalov Cindro, Mladen Krnić, Darko Modun, Jonatan Vuković, Tina Tičinović Kurir, Goran Kardum, Doris Rušić, Ana Šešelja Perišin, Josipa Bukić
JMIR Formative Research.2022; 6(7): e35655. CrossRef - Endothelial Dysfunction and Platelet Hyperactivation in Diabetic
Complications Induced by Glycemic Variability
Ye Huang, Long Yue, Jiahuang Qiu, Ming Gao, Sijin Liu, Jingshang Wang
Hormone and Metabolic Research.2022; 54(07): 419. CrossRef - Therapeutic potential of paeoniflorin in atherosclerosis: A cellular action and mechanism-based perspective
Wei Yu, Iqra Ilyas, Xuerui Hu, Suowen Xu, Hui Yu
Frontiers in Immunology.2022;[Epub] CrossRef - Effect of Dapagliflozin as an Add-on Therapy to Insulin on the Glycemic Variability in Subjects with Type 2 Diabetes Mellitus (DIVE): A Multicenter, Placebo-Controlled, Double-Blind, Randomized Study
Seung-Hwan Lee, Kyung-Wan Min, Byung-Wan Lee, In-Kyung Jeong, Soon-Jib Yoo, Hyuk-Sang Kwon, Yoon-Hee Choi, Kun-Ho Yoon
Diabetes & Metabolism Journal.2021; 45(3): 339. CrossRef - Association of time in range, as assessed by continuous glucose monitoring, with painful diabetic polyneuropathy
Junpeng Yang, Xueli Yang, Dongni Zhao, Xiaobing Wang, Wei Wei, Huijuan Yuan
Journal of Diabetes Investigation.2021; 12(5): 828. CrossRef - The Association Between Continuous Glucose Monitoring-Derived Metrics and Cardiovascular Autonomic Neuropathy in Outpatients with Type 2 Diabetes
Min Young Kim, Gyuri Kim, Ji Yun Park, Min Sun Choi, Ji Eun Jun, You-Bin Lee, Sang-Man Jin, Kyu Yeon Hur, Jae Hyeon Kim
Diabetes Technology & Therapeutics.2021; 23(6): 434. CrossRef - Current concepts and clinical importance of glycemic variability
Ramya Ravi, V Balasubramaniam, Gowthamarajan Kuppusamy, Sivasankaran Ponnusankar
Diabetes & Metabolic Syndrome: Clinical Research & Reviews.2021; 15(2): 627. CrossRef - Glycemic deviation index: a novel method of integrating glycemic numerical value and variability
Yizhou Zou, Wanli Wang, Dongmei Zheng, Xu Hou
BMC Endocrine Disorders.2021;[Epub] CrossRef - Relationship between short and long-term glycemic variability and oxidative stress in type 1 diabetes mellitus under daily life insulin treatment
Tatiana Valente, Fernando Valente, Maria Beatriz Bastos Lucchesi, Giovana Rita Punaro, Margaret Gori Mouro, Monica Andrade Lima Gabbay, Elisa Mieko Suemitsu Higa, Sergio Atala Dib
Archives of Endocrinology and Metabolism.2021;[Epub] CrossRef - Evidence of Early Diabetic Nephropathy in Pediatric Type 1 Diabetes
Leena Mamilly, Lucy D. Mastrandrea, Claudia Mosquera Vasquez, Brett Klamer, Mahmoud Kallash, Ahmad Aldughiem
Frontiers in Endocrinology.2021;[Epub] CrossRef - Glucose Variability and Risk of Hepatocellular Carcinoma in Patients with Diabetes: A Nationwide Population-Based Study
Jeong-Ju Yoo, Eun Ju Cho, Kyungdo Han, Soo Seong Heo, Bo-Yeon Kim, Dong Wook Shin, Su Jong Yu
Cancer Epidemiology, Biomarkers & Prevention.2021; 30(5): 974. CrossRef - Effect of glucose concentration and culture substrate on HUVECs viability in in vitro cultures: A literature review and own results
Anna Ciechanowska, Ilona Gora, Stanislawa Sabalinska, Piotr Foltynski, Piotr Ladyzynski
Biocybernetics and Biomedical Engineering.2021; 41(4): 1390. CrossRef - Time to Reach Target Glycosylated Hemoglobin Is Associated with Long-Term Durable Glycemic Control and Risk of Diabetic Complications in Patients with Newly Diagnosed Type 2 Diabetes Mellitus: A 6-Year Observational Study
Kyoung Jin Kim, Jimi Choi, Jae Hyun Bae, Kyeong Jin Kim, Hye Jin Yoo, Ji A Seo, Nan Hee Kim, Kyung Mook Choi, Sei Hyun Baik, Sin Gon Kim, Nam Hoon Kim
Diabetes & Metabolism Journal.2021; 45(3): 368. CrossRef - Immunosuppressive PLGA TGF-β1 Microparticles Induce Polyclonal and Antigen-Specific Regulatory T Cells for Local Immunomodulation of Allogeneic Islet Transplants
Ying Li, Anthony W. Frei, Irayme M. Labrada, Yanan Rong, Jia-Pu Liang, Magdalena M. Samojlik, Chuqiao Sun, Steven Barash, Benjamin G. Keselowsky, Allison L. Bayer, Cherie L. Stabler
Frontiers in Immunology.2021;[Epub] CrossRef - Retrospective study of glycemic variability, BMI, and blood pressure in diabetes patients in the Digital Twin Precision Treatment Program
Paramesh Shamanna, Mala Dharmalingam, Rakesh Sahay, Jahangir Mohammed, Maluk Mohamed, Terrence Poon, Nathan Kleinman, Mohamed Thajudeen
Scientific Reports.2021;[Epub] CrossRef - Dulaglutide improves muscle function by attenuating inflammation through OPA-1-TLR-9 signaling in aged mice
Phyu Phyu Khin, Yeonhee Hong, MyeongHoon Yeon, Dae Ho Lee, Jong Han Lee, Hee-Sook Jun
Aging.2021; 13(18): 21962. CrossRef - Glycemic Variability, Oxidative Stress, and Impact on Complications Related to Type 2 Diabetes Mellitus
Tatiana Valente, Alberto K. Arbex
Current Diabetes Reviews.2021;[Epub] CrossRef - The impact of structured self-monitoring of blood glucose on glycaemic variability in non-insulin treated type 2 diabetes: The SMBG study, a 12-month randomised controlled trial
David M. Williams, Sharon N. Parsons, Gareth J. Dunseath, Jeffrey W. Stephens, Stephen D. Luzio, David R. Owens
Diabetes & Metabolic Syndrome: Clinical Research & Reviews.2020; 14(2): 101. CrossRef - Model‐based data analysis of individual human postprandial plasma bile acid responses indicates a major role for the gallbladder and intestine
Emma C. E. Meessen, Fianne L. P. Sips, Hannah M. Eggink, Martijn Koehorst, Johannes A. Romijn, Albert K. Groen, Natal A. W. Riel, Maarten R. Soeters
Physiological Reports.2020;[Epub] CrossRef - How tightly controlled do fluctuations in blood glucose levels need to be to reduce the risk of developing complications in people with Type 1 diabetes?
R. Livingstone, J. G. Boyle, J. R. Petrie
Diabetic Medicine.2020; 37(4): 513. CrossRef - Simple Linear Support Vector Machine Classifier Can Distinguish Impaired Glucose Tolerance Versus Type 2 Diabetes Using a Reduced Set of CGM-Based Glycemic Variability Indices
Enrico Longato, Giada Acciaroli, Andrea Facchinetti, Alberto Maran, Giovanni Sparacino
Journal of Diabetes Science and Technology.2020; 14(2): 297. CrossRef - Vascular Complication in Adolescents With Diabetes Mellitus
Lara E. Graves, Kim C. Donaghue
Frontiers in Endocrinology.2020;[Epub] CrossRef - The Association Between Glycemic Variability and Macronutrients in Young Children with T1D
Alexandra D Monzon, Laura B Smith, Scott W Powers, Lawrence M Dolan, Susana R Patton
Journal of Pediatric Psychology.2020; 45(7): 749. CrossRef - Effect of sancai powder on glacemic variability of type 1 diabetes in China
Weiwei Yu, Dongqi Zhou, Li Zhang, Chen Rumeng, Peishuai Zhang, Lisha Sun, Ziping Gao
Medicine.2020; 99(34): e20772. CrossRef - Glycemic variability in newly diagnosed diabetic cats treated with the glucagon‐like peptide‐1 analogue exenatide extended release
Anna L. Krämer, Angelina Riederer, Federico Fracassi, Felicitas S. Boretti, Nadja S. Sieber‐Ruckstuhl, Thomas A. Lutz, Barbara Contiero, Eric Zini, Claudia E. Reusch
Journal of Veterinary Internal Medicine.2020; 34(6): 2287. CrossRef - The Association Between Glycemic Variability and Myocardial Infarction: A Review and Meta-Analysis of Prospective Studies and Randomized Trials
Zinab Alatawi, Hyder Mirghani
Cureus.2020;[Epub] CrossRef - Epigenetic regulation by polyphenols in diabetes and related complications
Hammad Ullah, Anna De Filippis, Cristina Santarcangelo, Maria Daglia
Mediterranean Journal of Nutrition and Metabolism.2020; 13(4): 289. CrossRef - A Protective Role of Paeoniflorin in Fluctuant Hyperglycemia-Induced Vascular Endothelial Injuries through Antioxidative and Anti-Inflammatory Effects and Reduction of PKCβ1
Jing-Shang Wang, Ye Huang, Shuping Zhang, Hui-Jun Yin, Lei Zhang, Yan-Hong Zhang, Ye-Wen Song, Dan-Dan Li
Oxidative Medicine and Cellular Longevity.2019; 2019: 1. CrossRef - The mechanisms of glycemic variability accelerate diabetic central neuropathy and diabetic peripheral neuropathy in diabetic rats
Junpeng Yang, Zhigang Zhao, Huijuan Yuan, Xiangxiang Ma, Yakun Li, Huimeng Wang, Xiaojun Ma, Guijun Qin
Biochemical and Biophysical Research Communications.2019; 510(1): 35. CrossRef - Glucose Variability and Coronary Artery Disease
Jinggang Xia, Chunlin Yin
Heart, Lung and Circulation.2019; 28(4): 553. CrossRef - Phase 1 Study of the Pharmacology of BTI320 Before High‐Glycemic Meals
David R. Luke, Karen Ka Yan Lee, Carl W. Rausch, Camille Cheng
Clinical Pharmacology in Drug Development.2019; 8(3): 395. CrossRef - Information Technology for Supporting Self-Control in the Formation of a Rational Lifestyle for Diabetics Patients
S. KIFORENKO, T. HONTAR, V. ORLENKO, K. IVASKIVA, T. OBELETS
Kibernetika i vyčislitelʹnaâ tehnika.2019; 2019(3(197)): 80. CrossRef - Impact of Carbohydrate on Glucose Variability in Patients with Type 1 Diabetes Assessed Through Professional Continuous Glucose Monitoring: A Retrospective Study
Yi-Hsuan Lin, Yu-Yao Huang, Hsin-Yun Chen, Sheng-Hwu Hsieh, Jui-Hung Sun, Szu-Tah Chen, Chia-Hung Lin
Diabetes Therapy.2019; 10(6): 2289. CrossRef - Tracking the Sugar Rush: Incorporating Continuous Glucose Monitoring Into Multisite Early Clinical Research With Type 2 Diabetes Subjects
Sabina Paglialunga, Bruce H. Morimoto, Amparo de la Peña, Caroline Fortier
Clinical Pharmacology in Drug Development.2018; 7(7): 676. CrossRef - Higher Total Insulin Dose Has Positive Effect on Corneal Nerve Fibers in DM1 Patients
Gabriela Mahelková, Marie Ceská Burdová, Šárka Malá, Lucie Hoskovcová, Dagmar Dotrelová, Katerina Štechová
Investigative Opthalmology & Visual Science.2018; 59(10): 3800. CrossRef - Relationship between Thyroid Function and Kidney Function in Patients with Type 2 Diabetes
Ying Zhang, Yang Wang, Xiao Jun Tao, Qian Li, Feng Fei Li, Kok Onn Lee, Dong Mei Li, Jian Hua Ma
International Journal of Endocrinology.2018; 2018: 1. CrossRef - The correlation between glucose fluctuation from self-monitored blood glucose and the major adverse cardiac events in diabetic patients with acute coronary syndrome during a 6-month follow-up by WeChat application
Jinggang Xia, Shaodong Hu, Ji Xu, Hengjian Hao, Chunlin Yin, Dong Xu
Clinical Chemistry and Laboratory Medicine (CCLM).2018; 56(12): 2119. CrossRef - Glycemic Variability Percentage: A Novel Method for Assessing Glycemic Variability from Continuous Glucose Monitor Data
Thomas A. Peyser, Andrew K. Balo, Bruce A. Buckingham, Irl B. Hirsch, Arturo Garcia
Diabetes Technology & Therapeutics.2018; 20(1): 6. CrossRef - Efficacy and safety of Panax ginseng berry extract on glycemic control: A 12-wk randomized, double-blind, and placebo-controlled clinical trial
Han Seok Choi, Sunmi Kim, Min Jung Kim, Myung-Sunny Kim, Juewon Kim, Chan-Woong Park, Daebang Seo, Song Seok Shin, Sang Woo Oh
Journal of Ginseng Research.2018; 42(1): 90. CrossRef - Resistance to Data Loss of Glycemic Variability Measurements in Long-Term Continuous Glucose Monitoring
Przemysław Kucharski, Konrad Pagacz, Agnieszka Szadkowska, Wojciech Młynarski, Andrzej Romanowski, Wojciech Fendler
Diabetes Technology & Therapeutics.2018; 20(12): 833. CrossRef - Investigation of glucose fluctuations by approaches of multi-scale analysis
Yunyun Lai, Zhengbo Zhang, Peiyao Li, Xiaoli Liu, YiXin Liu, Yi Xin, Weijun Gu
Medical & Biological Engineering & Computing.2018; 56(3): 505. CrossRef - Shared Responsibility for Type 1 Diabetes Care Is Associated With Glycemic Variability and Risk of Glycemic Excursions in Youth
Arwen M Marker, Amy E Noser, Mark A Clements, Susana R Patton
Journal of Pediatric Psychology.2018; 43(1): 61. CrossRef - Self Blood Glucose Monitoring Underestimates Hyperglycemia And Hypoglycemia As Compared To Continuous Glucose Monitoring In Type 1 And Type 2 Diabetes
Devna Mangrola, Christine Cox, Arianne S. Furman, Sridevi Krishnan, Sidika E. Karakas
Endocrine Practice.2018; 24(1): 47. CrossRef - Risk factors for the development of micro-vascular complications of type 2 diabetes in a single-centre cohort of patients
Marsida Teliti, Giulia Cogni, Lucia Sacchi, Arianna Dagliati, Simone Marini, Valentina Tibollo, Pasquale De Cata, Riccardo Bellazzi, Luca Chiovato
Diabetes and Vascular Disease Research.2018; 15(5): 424. CrossRef - Glucotypes reveal new patterns of glucose dysregulation
Heather Hall, Dalia Perelman, Alessandra Breschi, Patricia Limcaoco, Ryan Kellogg, Tracey McLaughlin, Michael Snyder, Jason Locasale
PLOS Biology.2018; 16(7): e2005143. CrossRef - Glucose Outcomes with the In-Home Use of a Hybrid Closed-Loop Insulin Delivery System in Adolescents and Adults with Type 1 Diabetes
Satish K. Garg, Stuart A. Weinzimer, William V. Tamborlane, Bruce A. Buckingham, Bruce W. Bode, Timothy S. Bailey, Ronald L. Brazg, Jacob Ilany, Robert H. Slover, Stacey M. Anderson, Richard M. Bergenstal, Benyamin Grosman, Anirban Roy, Toni L. Cordero, J
Diabetes Technology & Therapeutics.2017; 19(3): 155. CrossRef - Vildagliptin reduces plasma stromal cell‐derived factor‐1α in patients with type 2 diabetes compared with glimepiride
Kyeong Seon Park, SooHeon Kwak, Young Min Cho, Kyong Soo Park, Hak C Jang, Seong Yeon Kim, Hye Seung Jung
Journal of Diabetes Investigation.2017; 8(2): 218. CrossRef - Role of the PKCβII/JNK signaling pathway in acute glucose fluctuation-induced apoptosis of rat vascular endothelial cells
Na Wu, Haitao Shen, Yanjun Wang, Bing He, Yongyan Zhang, Yu Bai, Runyu Du, Qiang Du, Ping Han
Acta Diabetologica.2017; 54(8): 727. CrossRef - Association between glycemic variability and major adverse cardiovascular and cerebrovascular events (MACCE) in patients with acute coronary syndrome during 30-day follow-up
Jinggang Xia, Ji Xu, Boyu Li, Zhi Liu, Hengjian Hao, Chunlin Yin, Dong Xu
Clinica Chimica Acta.2017; 466: 162. CrossRef - How Can We Realize the Clinical Benefits of Continuous Glucose Monitoring?
Ramzi A. Ajjan
Diabetes Technology & Therapeutics.2017; 19(S2): S-27. CrossRef - The efficacy and safety of adding either vildagliptin or glimepiride to ongoing metformin therapy in patients with type 2 diabetes mellitus
Gyuri Kim, Sewon Oh, Sang-Man Jin, Kyu Yeon Hur, Jae Hyeon Kim, Moon-Kyu Lee
Expert Opinion on Pharmacotherapy.2017; 18(12): 1179. CrossRef - Association Between Coronary Artery Calcification and the Hemoglobin Glycation Index: The Kangbuk Samsung Health Study
Eun-Jung Rhee, Jung-Hwan Cho, Hyemi Kwon, Se Eun Park, Cheol-Young Park, Ki-Won Oh, Sung-Woo Park, Won-Young Lee
The Journal of Clinical Endocrinology & Metabolism.2017; 102(12): 4634. CrossRef - Glucose variability for cardiovascular risk factors in type 2 diabetes: a meta-analysis
Shuang Liang, Hang Yin, Chunxiang Wei, Linjun Xie, Hua He, Xiaoquan Liu
Journal of Diabetes & Metabolic Disorders.2017;[Epub] CrossRef - Could angiotensin-(1–7) be connected with improvement of microvascular function in diabetic patients? Angiotensin-(1–7) iontophoresis may provide the answer
Aleksandar Kibel
Medical Hypotheses.2016; 93: 16. CrossRef - Efficacy and Safety of PDM011011 Capsules as Compared to Metformin in Subjects with Type-2 Diabetes Mellitus: An Open-Label, Randomized, Active-Controlled, Multicentric, Phase III Study
Ashish C. Suthar, Vikas G. Pai, Yogesh Kadam, Aniruddha Tongaonkar, Shailaja Kale, Atul B. Deshpande, Sharat Kolke, Snehal Tanna, Shrikant V. Deshpande, Purvi Chawla, Debjit Biswas, Somesh Sharma
Journal of Diabetes Mellitus.2016; 06(01): 38. CrossRef - 1,5-Anhydro-D-Glucitol Could Reflect Hypoglycemia Risk in Patients with Type 2 Diabetes Receiving Insulin Therapy
Min Kyeong Kim, Hye Seung Jung, Soo Heon Kwak, Young Min Cho, Kyong Soo Park, Seong Yeon Kim
Endocrinology and Metabolism.2016; 31(2): 284. CrossRef - The impact of glycemic variability on diabetic peripheral neuropathy
Heung Yong Jin, Kyung Ae Lee, Tae Sun Park
Endocrine.2016; 53(3): 643. CrossRef - Serum bilirubin levels are positively associated with glycemic variability in women with type 2 diabetes
Lee Kyung Kim, Eun Roh, Min Joo Kim, Min Kyeong Kim, Kyeong Seon Park, Soo Heon Kwak, Young Min Cho, Kyong Soo Park, Hak Chul Jang, Hye Seung Jung
Journal of Diabetes Investigation.2016; 7(6): 874. CrossRef - Wider Perioperative Glycemic Fluctuations Increase Risk of Postoperative Acute Kidney Injury
Ming Ann Sim, Weiling Liu, Roderica R.G. Ng, Lian Kah Ti, Sophia T.H. Chew
Medicine.2015; 94(44): e1953. CrossRef
- A randomized trial on the effect of transcutaneous electrical nerve stimulator on glycemic control in patients with type 2 diabetes
Original Article
- Obesity and Metabolism
- A1c Variability Can Predict Coronary Artery Disease in Patients with Type 2 Diabetes with Mean A1c Levels Greater than 7
- Eun Ju Lee, You Jeong Kim, Tae Nyun Kim, Tae Ik Kim, Won Kee Lee, Mi-Kyung Kim, Jeong Hyun Park, Byoung Doo Rhee
- Endocrinol Metab. 2013;28(2):125-132. Published online June 18, 2013
- DOI: https://doi.org/10.3803/EnM.2013.28.2.125
- 3,688 View
- 28 Download
- 12 Web of Science
- 15 Crossref
-
Abstract
PDFPubReader
Background Recent studies suggested that the association of acute glucose variability and diabetic complications was not consistent, and that A1c variability representing long term glucose fluctuation may be related to coronary atherosclerosis in patients with type 1 diabetes. In this study, we attempt to determine whether or not A1c variability can predict coronary artery disease (CAD) in patients with type 2 diabetes.
Methods We reviewed data of patients with type 2 diabetes who had undergone coronary angiography (CAG) and had been followed up with for 5 years. The intrapersonal standard deviation (SD) of serially-measured A1c levels adjusted by the different number of assessments among patients (adj-A1c-SD) was considered to be a measure of the variability of A1c.
Results Among the 269 patients, 121 of them had type 2 diabetes with CAD. In patients with A1c ≥7%, the mean A1c levels and A1c levels at the time of CAG among the three groups were significantly different. The ratio of patients with CAD was the highest in the high adj-A1c-SD group and the lowest in the low adj-A1c-SD group (
P =0.017). In multiple regression analysis, adj-A1c-SD was an independent predictor for CAD in subjects with A1c ≥7% (odds ratio, 2.140;P =0.036).Conclusion Patients with higher A1c variability for several years showed higher mean A1c levels. A1c variability can be an independent predictor for CAD as seen in angiographs of patients with type 2 diabetes with mean A1c levels over 7%.
-
Citations
Citations to this article as recorded by- Intermediate- and long-term associations between air pollution and ambient temperature and glycated hemoglobin levels in women of child bearing age
Mike Z. He, Itai Kloog, Allan C. Just, Iván Gutiérrez-Avila, Elena Colicino, Martha M. Téllez-Rojo, María Luisa Pizano-Zárate, Marcela Tamayo-Ortiz, Alejandra Cantoral, Diana C. Soria-Contreras, Andrea A. Baccarelli, Robert O. Wright, Maayan Yitshak-Sade
Environment International.2022; 165: 107298. CrossRef - Correlation between HbA1c and Triglyceride Level with Coronary Stenosis Degree in Type 2 Diabetes Mellitus with Coronary Heart Disease
Laily Adninta, Indranila Samsuria, Edward Kurnia Setiawan Limijadi
Open Access Macedonian Journal of Medical Sciences.2022; 10(B): 944. CrossRef - Long-Term Glycemic Variability and Vascular Complications in Type 2 Diabetes: Post Hoc Analysis of the FIELD Study
Emma S Scott, Andrzej S Januszewski, Rachel O’Connell, Gregory Fulcher, Russell Scott, Antero Kesaniemi, Linda Wu, Stephen Colagiuri, Anthony Keech, Alicia J Jenkins
The Journal of Clinical Endocrinology & Metabolism.2020; 105(10): e3638. CrossRef - How Continuity in Service Impacts Process Variability: Evidence from a Primary Care Setting
Vishal Ahuja, Carlos Alvarez, Bradley R. Staats
SSRN Electronic Journal .2019;[Epub] CrossRef - Association of hemoglobin A1c variability and the incidence of heart failure with preserved ejection fraction in patients with type 2 diabetes mellitus and arterial hypertension
Jun Gu, Yu-Qi Fan, Jun-Feng Zhang, Chang-Qian Wang
Hellenic Journal of Cardiology.2018; 59(2): 91. CrossRef - Prognostic impact of HbA1c variability on long-term outcomes in patients with heart failure and type 2 diabetes mellitus
Jun Gu, Jian-an Pan, Yu-qi Fan, Hui-li Zhang, Jun-feng Zhang, Chang-qian Wang
Cardiovascular Diabetology.2018;[Epub] CrossRef - Cardiovascular Autonomic Neuropathy Predicts Higher HbA1c Variability in Subjects with Type 2 Diabetes Mellitus
Yeoree Yang, Eun-Young Lee, Jae-Hyoung Cho, Yong-Moon Park, Seung-Hyun Ko, Kun-Ho Yoon, Moo-Il Kang, Bong-Yun Cha, Seung-Hwan Lee
Diabetes & Metabolism Journal.2018; 42(6): 496. CrossRef - Glycated hemoglobin level is an independent predictor of major adverse cardiac events after nonfatal acute myocardial infarction in nondiabetic patients
Chin-Lan Chen, David H.-T. Yen, Chin-Sheng Lin, Shih-Hung Tsai, Sy-Jou Chen, Wayne H.-H. Sheu, Chin-Wang Hsu
Medicine.2017; 96(18): e6743. CrossRef - Randomized, Open-Label, Parallel Group Study to Evaluate the Effect of Internet-Based Glucose Management System on Subjects with Diabetes in China
Hun-Sung Kim, Chenglin Sun, So Jung Yang, Lin Sun, Fei Li, In Young Choi, Jae-Hyoung Cho, Guixia Wang, Kun-Ho Yoon
Telemedicine and e-Health.2016; 22(8): 666. CrossRef - Association between hemoglobin A1c variability and subclinical coronary atherosclerosis in subjects with type 2 diabetes
Hae Kyung Yang, Borami Kang, Seung-Hwan Lee, Kun-Ho Yoon, Byung-Hee Hwang, Kiyuk Chang, Kyungdo Han, Gunseog Kang, Jae Hyoung Cho
Journal of Diabetes and its Complications.2015; 29(6): 776. CrossRef - Glycated Albumin Levels in Patients with Type 2 Diabetes Increase Relative to HbA1cwith Time
Hye-jin Yoon, Yong-ho Lee, Kwang Joon Kim, So Ra Kim, Eun Seok Kang, Bong-Soo Cha, Hyun Chul Lee, Byung-Wan Lee
BioMed Research International.2015; 2015: 1. CrossRef - Brief Review of Articles in 'Endocrinology and Metabolism' in 2013
Won-Young Lee
Endocrinology and Metabolism.2014; 29(3): 251. CrossRef - Inverse Association between Glycated Albumin and Insulin Secretory Function May Explain Higher Levels of Glycated Albumin in Subjects with Longer Duration of Diabetes
Yong-ho Lee, Mi Hyang Kown, Kwang Joon Kim, Eun Young Lee, Daham Kim, Byung-Wan Lee, Eun Seok Kang, Bong Soo Cha, Hyun Chul Lee, Marià Alemany
PLoS ONE.2014; 9(9): e108772. CrossRef - HbA1c Variability and Micro- and Macrovascular Complications of Diabetes
Hae Kyung Yang, Seung-Hwan Lee
The Journal of Korean Diabetes.2014; 15(4): 202. CrossRef - Letter: A1c Variability Can Predict Coronary Artery Disease in Patients with Type 2 Diabetes with Mean A1c Level Greater than 7 (Endocrinol Metab 2013;28:125-32, Eun Ju Lee et al.)
Hye Seung Jung
Endocrinology and Metabolism.2013; 28(4): 346. CrossRef
- Intermediate- and long-term associations between air pollution and ambient temperature and glycated hemoglobin levels in women of child bearing age
 First
First Prev
Prev


