Articles
- Page Path
- HOME > Endocrinol Metab > Volume 33(3); 2018 > Article
-
Original ArticleEndocrine Research Deficiency of Sphingosine-1-Phosphate Reduces the Expression of Prohibitin and Causes β-Cell Impairment via Mitochondrial Dysregulation
-
Seok-Woo Hong1
 , Jinmi Lee1, Hyemi Kwon2, Se Eun Park2, Eun-Jung Rhee2, Cheol-Young Park2, Ki-Won Oh2, Sung-Woo Park2, Won-Young Lee2
 -
Endocrinology and Metabolism 2018;33(3):403-412.
DOI: https://doi.org/10.3803/EnM.2018.33.3.403
Published online: September 18, 2018
1Institute of Medical Research, Department of Internal Medicine, Kangbuk Samsung Hospital, Sungkyunkwan University School of Medicine, Seoul, Korea.
2Division of Endocrinology and Metabolism, Department of Internal Medicine, Kangbuk Samsung Hospital, Sungkyunkwan University School of Medicine, Seoul, Korea.
- Corresponding author: Won-Young Lee. Division of Endocrinology and Metabolism, Department of Internal Medicine, Kangbuk Samsung Hospital, Sungkyunkwan University School of Medicine, 29 Saemunan-ro, Jongno-gu, Seoul 03181, Korea. Tel: +82-2-2001-2579, Fax: +82-2-2001-2049, wonyoung2.lee@samsung.com
Copyright © 2018 Korean Endocrine Society
This is an Open Access article distributed under the terms of the Creative Commons Attribution Non-Commercial License (http://creativecommons.org/licenses/by-nc/4.0/) which permits unrestricted non-commercial use, distribution, and reproduction in any medium, provided the original work is properly cited.
ABSTRACT
-
Background
- Emerging evidence suggests that sphingolipids may be involved in type 2 diabetes. However, the exact signaling defect through which disordered sphingolipid metabolism induces β-cell dysfunction remains unknown. The current study demonstrated that sphingosine-1-phosphate (S1P), the product of sphingosine kinase (SphK), is an essential factor for maintaining β-cell function and survival via regulation of mitochondrial action, as mediated by prohibitin (PHB).
-
Methods
- We examined β-cell function and viability, as measured by mitochondrial function, in mouse insulinoma 6 (MIN6) cells in response to manipulation of cellular S1P and PHB levels.
-
Results
- Lack of S1P induced by sphingosine kinase inhibitor (SphKi) treatment caused β-cell dysfunction and apoptosis, with repression of mitochondrial function shown by decreases in cellular adenosine triphosphate content, the oxygen consumption rate, the expression of oxidative phosphorylation complexes, the mitochondrial membrane potential, and the expression of key regulators of mitochondrial dynamics (mitochondrial dynamin-like GTPase [OPA1] and mitofusin 1 [MFN1]). Supplementation of S1P led to the recovery of mitochondrial function and greatly improved β-cell function and viability. Knockdown of SphK2 using small interfering RNA induced mitochondrial dysfunction, decreased glucose-stimulated insulin secretion (GSIS), and reduced the expression of PHB, an essential regulator of mitochondrial metabolism. PHB deficiency significantly reduced GSIS and induced mitochondrial dysfunction, and co-treatment with S1P did not reverse these trends.
-
Conclusion
- Altogether, these data suggest that S1P is an essential factor in the maintenance of β-cell function and survival through its regulation of mitochondrial action and PHB expression.
- Insulin secretion is the main way through which pancreatic β-cells maintain glucose homeostasis, but it is impaired by chronic exposure to elevated levels of glucose and free fatty acids [12]. Pancreatic β-cell impairment results in hyperglycemia and eventually leads to the onset of type 2 diabetes, suggesting that the preservation of β-cell function is important for curing and preventing type 2 diabetes [3].
- Despite extensive studies on the protection of pancreatic β-cells against glucolipotoxicity, the underlying mechanism of β-cell dysfunction and apoptosis is not completely understood. Ceramide, a sphingolipid metabolite, has been established as a mediator of β-cell dysfunction and apoptosis [45]. In pancreatic islets, incubation with palmitate induced ceramide accumulation through an increase in cellular levels of long-chain acyl-coenzyme A, leading to the inhibition of insulin gene transcription [67] and activation of apoptotic signaling [8]. Moreover, it has been reported that ceramide was associated with endoplasmic reticulum (ER) stress and mitochondrial abnormality in β-cells [9]. In the ER, ceramide is reversibly converted to sphingosine by alkaline ceramidases, but most of it is reconverted to ceramide due to its instability, and some sphingosine is used to generate sphingosine-1-phosphate (S1P) [10]. S1P was recently found to be a mediator of β-cell survival and insulin secretion. S1P was found to regulate glucose-stimulated insulin secretion (GSIS) in mouse insulinoma 6 (MIN6) cells and pancreatic islets [11], and the loss of sphingosine kinase (SphK) promoted β-cell death in obese mice [12].
- In pancreatic β-cells, mitochondria are closely related with the secretory mechanism. Mitochondria generate adenosine triphosphate (ATP), and the closure of K-ATP channels induces cell membrane depolarization and exocytosis. Moreover, the depletion or specific deletion of mitochondrial DNA in pancreatic β-cells results in the onset of diabetes in animal models, showing that β-cell dysfunction is related to increased oxidative stress and impaired mitochondrial morphology [131415]. Mitochondrial mechanisms are regulated by various factors. Prohibitin (PHB) is localized in the mitochondrial inner membrane and is associated with mitochondrial function [16]. Deletion of PHB damages mitochondrial morphology and reduces membrane potential and complex I activity [1718]. The anti-inflammatory effect of PHB was demonstrated in intestinal epithelial cells [19], and it was also suggested that PHB functioned as a transcription factor [20] and mitochondrial chaperone [21]. Moreover, it has been reported that a specific deficiency of PHB in β-cells induced mitochondrial dysfunction and β-cell loss, and finally caused the failure of glucose homeostasis [22].
- Although increasing evidence supports the role of S1P in β-cell preservation, the cellular mechanism of how S1P acts to improve GSIS and survival remains unknown. This study investigated the role of S1P in maintaining β-cell homeostasis, focusing on the regulation of mitochondrial mechanisms and PHB.
INTRODUCTION
- Cell culture, treatment, and transfection
- MIN6 cell lines were maintained in Dulbecco's Modified Eagle's medium (DMEM) containing 25 mmol/L glucose, mixed with heat-inactivated 10% fetal bovine serum, 100 IU/mL penicillin, 50 µg/mL streptomycin, and 50 µM 2-mercaptoethanol (Life Technologies Corporation, Paisley, UK), in a 37℃ humidified incubator with 5% CO2. At 50% confluence, the cells were incubated in serum-free media with a sphingosine kinase inhibitor (SphKi; 15 µM) and/or S1P (D18:1, 10 µM) for 48 hours. For silencing of genes targeting PHB (GGAGUUCACAGAGGCAGUATT) or SPHK (SPHK1: CGAGCAGGUGACUAAUGAATT and UUCAUUAGUCACCUGCUCGTA; SPHK2: CAGGCTGCTCATATTGGTCAA and TAGGCTAAGATCTATCATTTA), small interfering RNAs (siRNAs) were transfected into MIN6 cells using the Lipofectamine RNAiMAX transfection reagent (Thermo Fisher Scientific, Carlsbad, CA, USA), according to the manufacturer's instructions. This study was approved by the Institutional Animal Care and Use Committee of Kangbuk Samsung Hospital (IACUC 2014-10-075).
- Poly (adenosine diphosphate ribose) polymerase activity assay
- A universal colorimetric poly (adenosine diphosphate [ADP]-ribose) polymerase (PARP) assay kit (Trevigen, Gaithersbug, MD, USA) was used to determine PARP activity. This kit was based on an intermixture of biotinylated ADP-ribose onto histone proteins. Cell lysates from MIN6 cells were loaded onto a histone-coated 96-well plate and incubated with biotinylated poly-ADP-ribose solution. After 1 hour, horseradish peroxidase and colorimetric substrates were added, and then absorbance was measured in a spectrophotometer at 450 nm.
- RNA extraction and real-time polymerase chain reaction analysis
- Total RNA was extracted with TRIzol (Life Technologies, Carlsbad, CA, USA). The first strand of complementary DNA was synthesized by oligo(dT)-primed reverse transcription using an RT enzyme mix (Thermo Fisher Scientific, Rockford, IL, USA), and applied as a template for a real-time polymerase chain reaction (PCR) assay with SYBR green I Master (Roche Diagnostics, Indianapolis, IN, USA) and primers for insulin 1 (INS1) (sense 5′-CCCTTAGTGACCAGCTATAATCAGAGA-3′ and antisense 5′-ACCACAAAGATGCTGTTTGACAA-3′), PHB (sense 5′-CATTGGCGAGGACTATGAT-3′ and antisense 5′-CTCTGTGAGGTCATCGCTCA-3′), and BACTIN (sense 5′-CGTGGGCCGCCCTAGG-CAACC-3′ and antisense 5′-TTGGCCTTAGGGTTCAGGGGG-3′). The PCR analysis was performed with a Light Cycler 480 (Roche, Lewis, UK) and the relative expression of RNA was measured by the ΔΔCt formula method.
- Glucose-stimulated insulin secretion test
- After pre-incubation with glucose-free Krebs Ringer bicarbonate HEPES (KRPH) buffer for 1 hour, the MIN6 cells were exposed to DMEM media containing 5.5 or 25 mmol/L glucose for 1 hour. The concentration of released insulin was detected by a mouse insulin enzyme-linked immunosorbent assay (Linco Research, St. Charles, MO, USA).
- Immunoblotting assay
- Total protein from MIN6 cells was prepared using radioimmunoprecipitation assay (RIPA) buffer (Santa Cruz Biotechnology, Santa Cruz, CA, USA) with protease and phosphatase inhibitors. The proteins were separated in 4% to 12% or 12% sodium dodecyl sulfate-polyacrylamide gel electrophoresis (SDS-PAGE) gels, and transferred to polyvinylidene difluoride membranes. Several proteins were detected and measured with antibodies for S1P, phosphor-stress activated protein kinase (SAPK)/c-Jun N-terminal kinase (JNK) (T183/Y185), SAPK/JNK, cleaved caspase-3 (D175), total caspase-3, β-actin (Cell Signaling Technology, Danvers, MA, USA), pancreatic and duodenal homeobox 1 (Pdx-1, Millipore, Temecula, CA, USA), lamin B1, mitofusin 1 (MFN1, Abcam, Cambridge, MA, USA), mitochondrial dynamin-like GTPase (OPA1, BD Biosciences, San Diego, CA, USA), oxidative phosphorylation (OxPHOS) complex cocktail (Invitrogen, Rockford, IL, USA), and PHB (Santa Cruz Biotechnology).
- Detection of the mitochondrial membrane potential
- The mitochondrial membrane potential (MMP) was measured using cell-permeant cationic red orange fluorescent dye. MIN6 cells were incubated with 100 ng/mL tetramethylrhodamine ethyl ester (TMRE, Molecular Probes Inc., Eugene, OR, USA) and 10 ng/mL Hoechst (Molecular Probes Inc.) for 25 minutes at 37℃, followed by washing with phosphate-buffered saline for 5 minutes twice. Stained cells were imaged with an Olympus BX52 microscope (Olympus Optical Co., Tokyo, Japan), and the intensity of the red fluorescent dye was measured in ImageJ software to quantify the MMP.
- Measurement of cellular ATP content
- The intracellular ATP content was quantitatively determined using a colorimetric ATP assay kit (Abcam) according to the manufacturer's instructions. Cells were incubated with serum-free media for 1 hour, and then media was replaced with fresh media. After treatment with a detecting solution for 20 minutes, cells were lysed. ATP content was normalized to the total protein concentration.
- Measurement of oxygen consumption
- Oxygen consumption was measured using a MitoXpress Xtra Oxygen Consumption Assay Kit (Luxcel Bioscience, Cork, Ireland) according to the manufacturer's instructions. Briefly, MIN6 cells were seeded in a black and clear-bottom 96-well tissue culture plate and grown for 72 hours. At 50% to 70% confluence, 10 µL of MitoXpress Xtra solution was added to cells with 150 µL of fresh medium, and oxygen consumption was measured at the wavelength of 410 nm every 5 minutes for an hour.
- Statistical analysis
- In the present study, all statistical analyses were performed using PASW version 17 (SPSS Inc., Chicago, IL, USA). One-way analysis of variance was used to evaluate the statistical significance of differences among mean values in different experimental groups, and a P value <0.05 was considered to indicate statistical significance unless otherwise indicated.
METHODS
- Deficiency of sphingosine-1-phosphate induces β-cell dysfunction and apoptosis
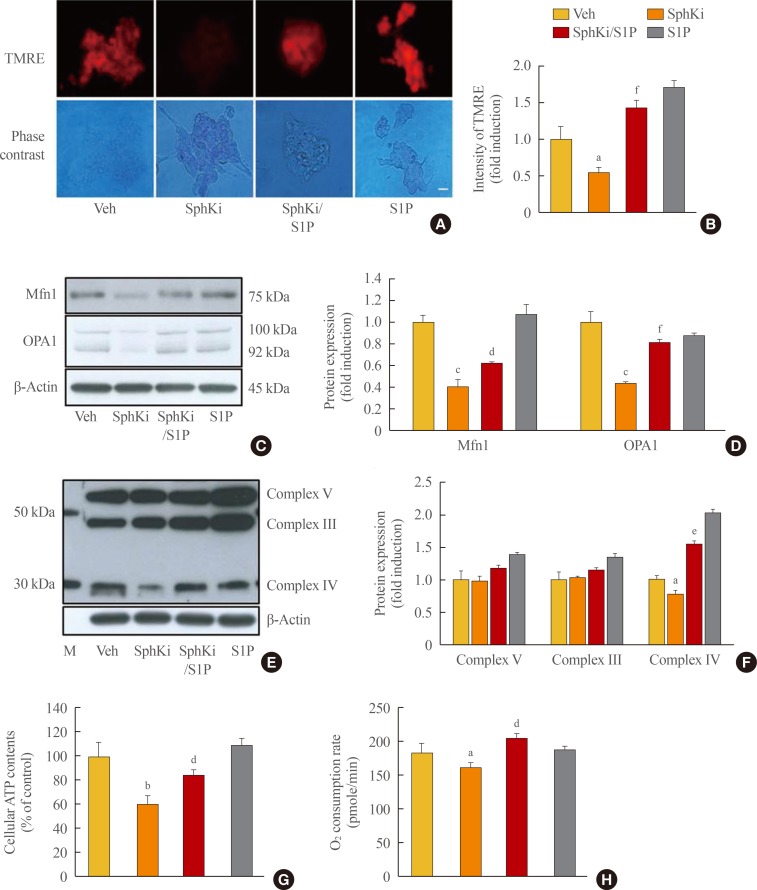
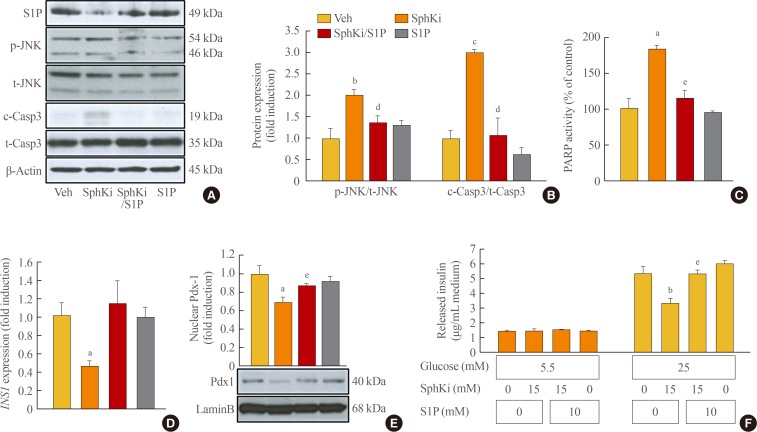
- To investigate the role of S1P in β-cells, we manipulated cellular S1P levels by treatment with a SphKi (15 µM) and/or S1P (d18:1; 10 µM). MIN6 cells were incubated with SphKi, which reduced cellular S1P levels to a remarkable extent, and co-treatment with S1P conserved the S1P level (Fig. 1A). The lack of S1P induced by SphKi treatment was accompanied by apoptosis, as shown by increased cleaved caspase-3, phosphorylated JNK, and PARP activity. In contrast, preservation of the cellular S1P levels greatly ameliorated apoptosis (Fig. 1A–C). Insulin expression and secretion was also affected by cellular S1P levels. The decrease of INS1 and nuclear Pdx1 induced by SphKi treatment was significantly attenuated by co-treatment with S1P, and 25 mmol/L GSIS also recovered due to S1P treatment (Fig. 1D–F). These results suggest that S1P, a signaling molecule of sphingolipid metabolism, is essential for maintaining β-cell function and viability.
- Sphingosine-1-phosphate is involved in mitochondrial dynamics and function
- As abundant evidence has indicated that SphK and S1P are essential factors for maintaining mitochondrial function [2324], we examined the involvement of S1P in mitochondrial dynamics and function in pancreatic β-cells. We detected and analyzed the MMP by TMRE staining, and the red fluorescent signals indicating the strength of the MMP were significantly decreased by SphKi treatment (Fig. 2A, B), and the expression of OPA1 and Mfn1, which are factors regulating mitochondrial fusion and fission, was also decreased by SphKi treatment (Fig. 2C, D). Deficiency of cellular S1P strongly repressed mitochondrial function. The expression of mitochondrial OxPHOS-related proteins was affected by cellular S1P levels. In particular, OxPHOS complex IV was significantly decreased by SphKi treatment (Fig. 2E, F). Moreover, cellular ATP content and the oxygen consumption rate were also down-regulated by SphKi treatment. Supplementation with S1P caused mitochondrial dynamics and function to largely recover, suggesting that S1P closely regulates mitochondrial action in β-cells.
- Knockdown of SphK2 reduces prohibitin expression and mitochondrial function
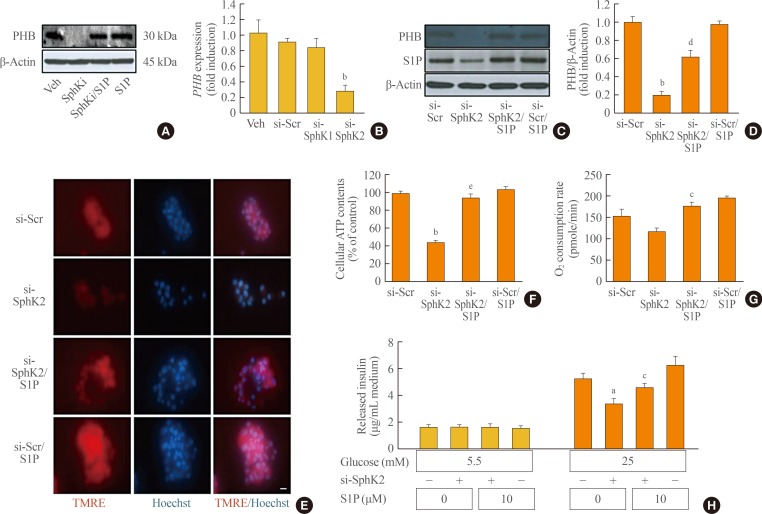
- In this study, we found that S1P deficiency induced morphological and functional impairment of mitochondria in MIN6 cells, and we next investigated the mediator of the effects of S1P. Decreased levels of PHB, a pivotal regulator of mitochondrial function and dynamics, were detected in SphKi-treated MIN6 cells (Fig. 3A). To confirm the interaction between S1P and PHB, we used specific siRNA for SPHK. We transfected siRNAs for SPHK1 and SPHK2, respectively, because there are two SphK isoforms that synthesize S1P. Interestingly, the expression of PHB was significantly repressed by transfection of siRNA for SPHK2, but knockdown of SPHK1 did not affect PHB expression, when compared to cells transfected with si-scramble (Fig. 3B). Knockdown of SPHK2 decreased cellular S1P levels, and PHB expression was also significantly repressed by SPHK2 knockdown (Fig. 3C, D). Co-treatment with S1P dramatically blocked the decrease in PHB expression caused by SPHK2 knockdown, and the morphological and functional dysregulation of mitochondria caused by SPHK2 knockdown was remarkably ameliorated by S1P treatment, as shown by significant recovery of TMRE intensity, ATP content, and the oxygen consumption rate (Fig. 3E–G). Knockdown of SPHK2 also affected β-cell function, consistent with SphKi treatment. Insulin secretion in medium containing 25 mmol/L glucose was decreased by si-SPHK2 transfection, and significantly recovered in S1P co-treated cells (Fig. 3H).
- The role of sphingosine-1-phosphate is mediated by prohibitin
- Finally, we evaluated the effect of S1P on regulating mitochondrial function in a PHB knockdown model to examine whether PHB mediated the effect of S1P on the mitochondria of β-cells. Transfection with siRNA for PHB significantly decreased the expression of PHB messenger RNA and protein (Fig. 4A, B) and repressed the MMP, as detected by TMRE staining (Fig. 4C). Mitochondrial function was also down-regulated by PHB knockdown, as shown by decreases in ATP content and the oxygen consumption rate (Fig. 4D, E). Moreover, PHB knockdown resulted in significant repression of GSIS (Fig. 4F), and the mitochondrial dysregulation and the impairment of insulin secretion by PHB knockdown were not improved by additional treatment with S1P (Fig. 4). These data suggest that PHB is an indispensable factor mediating the effects of S1P on mitochondrial regulation and insulin secretion.
RESULTS
- The current study demonstrated that S1P deficiency induced β-cell impairment and apoptosis via mitochondrial dysfunction and a decrease in PHB levels. Repression of S1P synthesis by treatment with SphKi or by siRNA for SPHK2 resulted in conspicuous β-cell dysfunction and apoptosis. It has been reported that S1P is important in GSIS of β-cells and the onset of diabetes [12]. In MIN6 cells, SphK2 activity was facilitated by high levels of glucose, inducing an increase in cellular S1P levels, and S1P was essential for maintaining GSIS [11]. Moreover, glucose was reported to alter S1P levels in endothelial cells and rat pancreatic islets [2526]. These data strongly suggest that S1P produced by SphK2 plays a pivotal role in the preservation of β-cell function and prevention of type 2 diabetes.
- Our data demonstrated that treatment with SphKi caused severe dysregulation of morphological dynamics and function in β-cell mitochondria, as shown by reduced ATP production and oxygen consumption. The MMP, as detected by TMRE, decreased, and key components of mitochondrial dynamics, OPA1 and MFN1, were also significantly repressed by S1P deficiency (Fig. 2), suggesting that S1P plays an essential role in maintaining mitochondrial homeostasis. S1P is an intracellular target that is involved in a variety of cellular signaling processes, and is produced anywhere in the cell, depending on the location of SphK [272829]. It was reported that SphK2 was localized to the inner membrane of the mitochondria and regulated S1P levels, indicating the pivotal role of S1P in mitochondrial function [23]. As shown in Fig. 3A, knockdown of SphK1 had no effect on PHB expression, and cellular S1P levels were drastically decreased by SPHK2 knockdown, suggesting that SphK2 is a major regulator of cellular S1P levels in β-cells. Consistent with our data, a recent study demonstrated that SphK1 had insignificant effects on GSIS in MIN6 cells [11], suggesting that S1P levels in specific locations or compartments, such as the mitochondria or granules, may be more important than the overall S1P levels throughout the cell.
- This study also demonstrated that PHB played a role in the S1P-induced improvement of mitochondrial function and GSIS (Fig. 4). PHB is known to be a key factor for regulating the proper development, morphogenic remodeling, and function of mitochondria [3031]. Knockdown of PHB dramatically reduced the mitochondrial function and membrane potential in MIN6 cells (Fig. 4D–F). This is consistent with several previous reports indicating that PHB plays a function in mitochondrial biogenesis, based on the finding that PHB deficiency in plants led to repression of the MMP and oxygen consumption [32]. Moreover, PHB protected HeLa cells against apoptosis via interaction with Hax-1, and preserved mitochondrial morphology through regulation of OPA1 [33].
- In summary, the present study revealed that S1P plays a pivotal role in β-cell function and survival through regulating the expression of PHB and contributing to the maintenance of mitochondrial homeostasis, which is consistent with previous data that have demonstrated the essential function of S1P and PHB in cell metabolism. Furthermore, we showed that SphK2 is the main isoform that regulates cellular S1P levels and PHB expression in β-cells, suggesting that S1P may be a valuable target for potential strategies to prevent and treat type 2 diabetes.
DISCUSSION
-
Acknowledgements
- This study was supported in part by a grant from the National Research Foundation (NRF), which is funded by the Korea government (NRF-2016R1A6A3A11930792), and by a KES Research Award (2014). A part of data used in this study was presented in SICEM 2015. The funders had no role in the study design, data collection and analysis, decision to publish, or preparation of the manuscript.
ACKNOWLEDGMENTS
-
CONFLICTS OF INTEREST: No potential conflict of interest relevant to this article was reported.
-
AUTHOR CONTRIBUTIONS: Conception or design: S.W.H., W.Y.L. Acquisition, analysis, or interpretation of data: H.K., S.E.P., E.J.R., C.Y.P., K.W.O., S.W.P. Drafting the work or revising: S.W.H., J.L. Final approval of the manuscript: S.W.H., W.Y.L.
Article information
- 1. Newsholme P, Keane D, Welters HJ, Morgan NG. Life and death decisions of the pancreatic beta-cell: the role of fatty acids. Clin Sci (Lond) 2007;112:27–42. ArticlePubMedPDF
- 2. Giacca A, Xiao C, Oprescu AI, Carpentier AC, Lewis GF. Lipid-induced pancreatic β-cell dysfunction: focus on in vivo studies. Am J Physiol Endocrinol Metab 2011;300:E255–E262. ArticlePubMed
- 3. Poitout V, Amyot J, Semache M, Zarrouki B, Hagman D, Fontes G. Glucolipotoxicity of the pancreatic beta cell. Biochim Biophys Acta 2010;1801:289–298. ArticlePubMed
- 4. Veluthakal R, Palanivel R, Zhao Y, McDonald P, Gruber S, Kowluru A. Ceramide induces mitochondrial abnormalities in insulin-secreting INS-1 cells: potential mechanisms underlying ceramide-mediated metabolic dysfunction of the beta cell. Apoptosis 2005;10:841–850. ArticlePubMedPDF
- 5. Laychock SG, Sessanna SM, Lin MH, Mastrandrea LD. Sphingosine 1-phosphate affects cytokine-induced apoptosis in rat pancreatic islet beta-cells. Endocrinology 2006;147:4705–4712. ArticlePubMedPDF
- 6. Kelpe CL, Moore PC, Parazzoli SD, Wicksteed B, Rhodes CJ, Poitout V. Palmitate inhibition of insulin gene expression is mediated at the transcriptional level via ceramide synthesis. J Biol Chem 2003;278:30015–30021. ArticlePubMed
- 7. Guo J, Qian Y, Xi X, Hu X, Zhu J, Han X. Blockage of ceramide metabolism exacerbates palmitate inhibition of pro-insulin gene expression in pancreatic beta-cells. Mol Cell Biochem 2010;338:283–290. ArticlePubMedPDF
- 8. Major CD, Gao ZY, Wolf BA. Activation of the sphingomyelinase/ceramide signal transduction pathway in insulin-secreting beta-cells: role in cytokine-induced beta-cell death. Diabetes 1999;48:1372–1380. ArticlePubMed
- 9. Lei X, Zhang S, Bohrer A, Ramanadham S. Calcium-independent phospholipase A2 (iPLA2 beta)-mediated ceramide generation plays a key role in the cross-talk between the endoplasmic reticulum (ER) and mitochondria during ER stress-induced insulin-secreting cell apoptosis. J Biol Chem 2008;283:34819–34832. ArticlePubMedPMC
- 10. Mao C, Obeid LM. Ceramidases: regulators of cellular responses mediated by ceramide, sphingosine, and sphingosine-1-phosphate. Biochim Biophys Acta 2008;1781:424–434. ArticlePubMedPMC
- 11. Cantrell Stanford J, Morris AJ, Sunkara M, Popa GJ, Larson KL, Ozcan S. Sphingosine 1-phosphate (S1P) regulates glucose-stimulated insulin secretion in pancreatic beta cells. J Biol Chem 2012;287:13457–13464. ArticlePubMedPMC
- 12. Qi Y, Chen J, Lay A, Don A, Vadas M, Xia P. Loss of sphingosine kinase 1 predisposes to the onset of diabetes via promoting pancreatic β-cell death in diet-induced obese mice. FASEB J 2013;27:4294–4304. ArticlePubMed
- 13. Kennedy ED, Maechler P, Wollheim CB. Effects of depletion of mitochondrial DNA in metabolism secretion coupling in INS-1 cells. Diabetes 1998;47:374–380. ArticlePubMed
- 14. Silva JP, Kohler M, Graff C, Oldfors A, Magnuson MA, Berggren PO, et al. Impaired insulin secretion and beta-cell loss in tissue-specific knockout mice with mitochondrial diabetes. Nat Genet 2000;26:336–340. ArticlePubMedPDF
- 15. Supale S, Li N, Brun T, Maechler P. Mitochondrial dysfunction in pancreatic β cells. Trends Endocrinol Metab 2012;23:477–487. ArticlePubMed
- 16. Merkwirth C, Langer T. Prohibitin function within mitochondria: essential roles for cell proliferation and cristae morphogenesis. Biochim Biophys Acta 2009;1793:27–32. ArticlePubMed
- 17. Schleicher M, Shepherd BR, Suarez Y, Fernandez-Hernando C, Yu J, Pan Y, et al. Prohibitin-1 maintains the angiogenic capacity of endothelial cells by regulating mitochondrial function and senescence. J Cell Biol 2008;180:101–112. ArticlePubMedPMCPDF
- 18. Merkwirth C, Dargazanli S, Tatsuta T, Geimer S, Lower B, Wunderlich FT, et al. Prohibitins control cell proliferation and apoptosis by regulating OPA1-dependent cristae morphogenesis in mitochondria. Genes Dev 2008;22:476–488. ArticlePubMedPMC
- 19. Han J, Zhao Q, Basmadjian C, Desaubry L, Theiss AL. Flavaglines ameliorate experimental colitis and protect against intestinal epithelial cell apoptosis and mitochondrial dysfunction. Inflamm Bowel Dis 2016;22:55–67. ArticlePubMedPMC
- 20. Zhou Z, Ai H, Li K, Yao X, Zhu W, Liu L, et al. Prohibitin 2 localizes in nucleolus to regulate ribosomal RNA transcription and facilitate cell proliferation in RD cells. Sci Rep 2018;8:1479ArticlePubMedPMCPDF
- 21. Nijtmans LG, de Jong L, Artal Sanz M, Coates PJ, Berden JA, Back JW, et al. Prohibitins act as a membrane-bound chaperone for the stabilization of mitochondrial proteins. EMBO J 2000;19:2444–2451. ArticlePubMedPMC
- 22. Supale S, Thorel F, Merkwirth C, Gjinovci A, Herrera PL, Scorrano L, et al. Loss of prohibitin induces mitochondrial damages altering β-cell function and survival and is responsible for gradual diabetes development. Diabetes 2013;62:3488–3499. ArticlePubMedPMC
- 23. Strub GM, Paillard M, Liang J, Gomez L, Allegood JC, Hait NC, et al. Sphingosine-1-phosphate produced by sphingosine kinase 2 in mitochondria interacts with prohibitin 2 to regulate complex IV assembly and respiration. FASEB J 2011;25:600–612. ArticlePubMedPMC
- 24. Shen Z, Liu C, Liu P, Zhao J, Xu W. Sphingosine 1-phosphate (S1P) promotes mitochondrial biogenesis in Hep G2 cells by activating peroxisome proliferator-activated receptor γ coactivator 1α (PGC-1α). Cell Stress Chaperones 2014;19:541–548. ArticlePubMedPDF
- 25. Wang L, Xing XP, Holmes A, Wadham C, Gamble JR, Vadas MA, et al. Activation of the sphingosine kinase-signaling pathway by high glucose mediates the proinflammatory phenotype of endothelial cells. Circ Res 2005;97:891–899. ArticlePubMed
- 26. Mastrandrea LD, Sessanna SM, Del Toro A, Laychock SG. ATP-independent glucose stimulation of sphingosine kinase in rat pancreatic islets. J Lipid Res 2010;51:2171–2180. ArticlePubMedPMC
- 27. Spiegel S, Milstien S. Sphingosine-1-phosphate: an enigmatic signaling lipid. Nat Rev Mol Cell Biol 2003;4:397–407. ArticlePubMedPDF
- 28. Saba JD, Hla T. Point-counterpoint of sphingosine 1-phosphate metabolism. Circ Res 2004;94:724–734. ArticlePubMed
- 29. Hannun YA, Obeid LM. Principles of bioactive lipid signalling: lessons from sphingolipids. Nat Rev Mol Cell Biol 2008;9:139–150. ArticlePubMedPDF
- 30. He B, Feng Q, Mukherjee A, Lonard DM, DeMayo FJ, Katzenellenbogen BS, et al. A repressive role for prohibitin in estrogen signaling. Mol Endocrinol 2008;22:344–360. ArticlePubMedPDF
- 31. Berger KH, Yaffe MP. Prohibitin family members interact genetically with mitochondrial inheritance components in Saccharomyces cerevisiae. Mol Cell Biol 1998;18:4043–4052. ArticlePubMedPMC
- 32. Ahn CS, Lee JH, Hwang AR, Kim WT, Pai HS. Prohibitin is involved in mitochondrial biogenesis in plants. Plant J 2006;46:658–667. ArticlePubMed
- 33. Kasashima K, Ohta E, Kagawa Y, Endo H. Mitochondrial functions and estrogen receptor-dependent nuclear translocation of pleiotropic human prohibitin 2. J Biol Chem 2006;281:36401–36410. ArticlePubMed
References
Lack of sphingosine-1-phosphate (S1P) induces β-cell dysfunction and apoptosis. Mouse insulinoma 6 (MIN6) cells were maintained in Dulbecco's Modified Eagle's medium (DMEM) media (containing 25 mM glucose and 10% fetal bovine serum). At 50% cell confluence, the cells were incubated in serum-free media with a sphingosine kinase inhibitor (15 µM) and/or S1P (D18:1, 10 µM) for 48 hours. (A, B) Cellular levels of S1P and apoptotic proteins, including cleaved caspase-3 and phosphorylated c-Jun N-terminal kinase (p-JNK), were evaluated by an immunoblotting assay. Quantitative levels of p-JNK and cleaved caspase-3 were normalized to total JNK and caspase-3 expression. (C) Poly (adenosine diphosphate [ADP]-ribose) polymerase (PARP) activity is presented as the percent of relative absorbance compared to the vehicle (Veh) group. (D) Transcription of insulin 1 (INS1) was measured by real-time reverse-transcription polymerase chain reaction and normalized to β-actin. (E) Nuclear expression of pancreatic and duodenal homeobox 1 (Pdx1) was analyzed by an immunoblotting assay, and normalized to lamin B1. Each value represents the mean of 3 experiments. (F) The glucose-stimulated (5.5 or 25 mM) insulin secretion of MIN6 cells was evaluated by a mouse insulin enzyme-linked immunosorbent assay kit. The values are representative of four independent experiments. t-JNK, total c-Jun N-terminal kinase; c-casp3, cleaved caspase-3; t-casp3, total caspase-3; SphKi, sphingosine kinase inhibitor. aP<0.05, bP<0.01, cP<0.001 compared with the Veh group; dP<0.05, eP<0.01 compared with the SphKi group.
Lack of sphingosine-1-phosphate (S1P) induces mitochondrial impairment in β-cells. (A) After incubation with a sphingosine kinase inhibitor (SphKi) and/or S1P for 48 hours, mouse insulinoma 6 (MIN6) cells were incubated with tetramethylrhodamine ethyl ester (TMRE) to evaluate the mitochondrial membrane potential. After washing with phosphate-buffered saline, the intensity of red fluorescence in the TMRE-stained cells was detected, and (B) represented by quantitative analysis. Bar=20 µm. (C) Expression of mitochondrial dynamin-like GTPase (OPA1) and mitofusin 1 (Mfn1), key molecules regulating mitochondrial fusion and fission, was analyzed by an immunoblotting assay, and (D) the ratio to β-actin was determined. (E, F) Mitochondrial proteins regulating oxidative phosphorylation (OxPHOS) were detected using an OxPHOS complex antibody cocktail by an immunoblotting assay, and the ratio to β-actin was determined. (G, H) Adenosine triphosphate (ATP) levels and the oxygen consumption rate in MIN6 cells treated with SphKi and/or S1P were compared. The amount of ATP is represented as the percent of control, and the rate of oxygen consumption is described as picomoles per minute. Each value represents the mean of three experiments. Veh, vehicle; M, markers of size. aP<0.05, bP<0.01, cP<0.001 compared with the Veh group; dP<0.05, eP<0.01, fP<0.001 compared with the SphKi group.

Knockdown of the sphingosine kinase 2 (SPHK2) gene decreases prohibitin (PHB) and induces mitochondrial impairment in β-cells. (A) PHB expression was measured by an immunoblotting assay in mouse insulinoma 6 (MIN6) cells that were incubated with a sphingosine kinase inhibitor (SphKi) and/or sphingosine-1-phosphate (S1P) for 48 hours. (B) MIN6 cells were transfected with silencing genes targeting SPHK1 or SPHK2. After incubation for 8 hours, the transcription of PHB was determined by real-time reverse-transcription polymerase chain reaction. (C, D) MIN6 cells were transfected with small interfering RNA (siRNA) for SPHK2 for 8 hours, and a portion of the cells were incubated with S1P for 48 hours. Expression of PHB was analyzed by an immunoblotting assay, and quantitative levels were represented by normalization to β-actin expression. (E) After knockdown of SPHK2 and/or S1P treatment, MIN6 cells were exposed to 100 ng/mL tetramethylrhodamine ethyl ester (TMRE) and 10 ng/mL Hoechst. Mitochondrial membrane potentials were probed by TMRE showing red fluorescence, and the nucleus was visualized by blue fluorescence. Bars=20 µm. (F, G) Adenosine triphosphate (ATP) levels and the oxygen consumption rate were analyzed in MIN6 cells after transfection of SPHK2 siRNA and/or S1P treatment. (H) Glucose-stimulated (5.5 or 25 mM) insulin secretion was evaluated by a mouse insulin enzyme-linked immunosorbent assay kit in MIN6 cells after transfection of SPHK2 siRNA and S1P treatment. Each value represents the mean of three experiments. Veh, vehicle; si, small interfering; Scr, scramble. aP<0.05, bP<0.001 compared with the si-Scr group; cP<0.05, dP<0.01, eP<0.001 compared with the si-SphK2 group.

Restoration of sphingosine-1-phosphate (S1P) levels did not lead to the recovery of function in prohibitin (PHB)-deficient mouse insulinoma 6 (MIN6) cells. At 60% confluence, MIN6 cells were transfected with 10 nM small interfering RNA (siRNA) for PHB, and then incubated in serum-free media with or without 10 µM S1P for 48 hours. (A, B) The messenger RNA and protein levels of PHB were analyzed by real-time reverse-transcription polymerase chain reaction and an immunoblotting assay. (C) After knockdown of PHB and/or S1P treatment, MIN6 cells were exposed to tetramethylrhodamine ethyl ester (TMRE) and Hoechst to observe the mitochondrial membrane potential. Bars=20 µm. (D, E) Adenosine triphosphate (ATP) levels and the oxygen consumption rate were measured in MIN6 cells after transfection of PHB siRNA and S1P treatment. Each value represents the mean of three experiments. (F) Glucose-stimulated (5.5 or 25 mM) insulin secretion was evaluated by a mouse insulin enzyme-linked immunosorbent assay kit in MIN6 cells after transfection of PHB siRNA and S1P treatment. The values are representative of four independent experiments. Veh, vehicle; si, small interfering; Scr, scramble. aP<0.05, bP<0.001 compared with the si-Scr group.
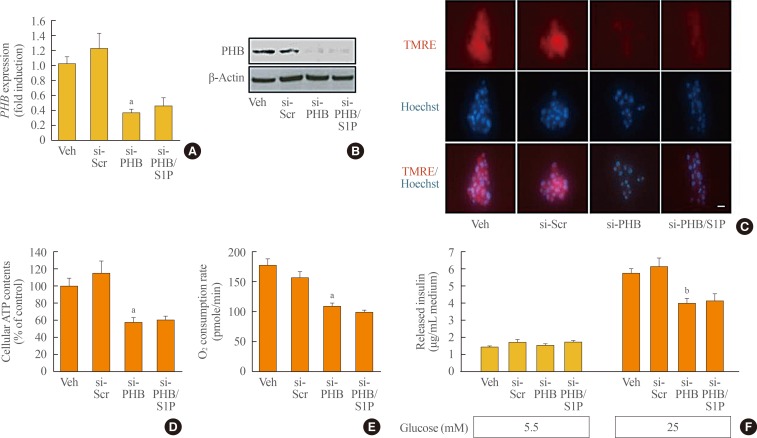
Figure & Data
References
Citations
- Mitochondrial Cristae Morphology Reflecting Metabolism, Superoxide Formation, Redox Homeostasis, and Pathology
Petr Ježek, Martin Jabůrek, Blanka Holendová, Hana Engstová, Andrea Dlasková
Antioxidants & Redox Signaling.2023; 39(10-12): 635. CrossRef - Sphingolipids in mitochondria—from function to disease
Maryam Jamil, Lauren Ashley Cowart
Frontiers in Cell and Developmental Biology.2023;[Epub] CrossRef - Sphingosine‐1‐phosphate in mitochondrial function and metabolic diseases
Meng Duan, Pan Gao, Sheng‐xi Chen, Petr Novák, Kai Yin, Xiao Zhu
Obesity Reviews.2022;[Epub] CrossRef - Involvement of miR‐27a‐3p in diabetic nephropathy via affecting renal fibrosis, mitochondrial dysfunction, and endoplasmic reticulum stress
Lina Wu, Qingzhu Wang, Feng Guo, Xiaojun Ma, Jiao Wang, Yanyan Zhao, Yushan Yan, Guijun Qin
Journal of Cellular Physiology.2021; 236(2): 1454. CrossRef - Sphingosine‐1‐phosphate in acute exercise and training
Katarzyna Hodun, Adrian Chabowski, Marcin Baranowski
Scandinavian Journal of Medicine & Science in Sports.2021; 31(5): 945. CrossRef - The Ethyl Acetate Extract From Celastrus orbiculatus Promotes Apoptosis of Gastric Cancer Cells Through Mitochondria Regulation by PHB
Lide Tao, Zixin Yin, Tengyang Ni, Zewen Chu, Shihua Hao, Zeyu Wang, Masataka Sunagawa, Haibo Wang, Yanqing Liu
Frontiers in Pharmacology.2021;[Epub] CrossRef - Sphingosine 1-phosphate Stimulates Insulin Secretion and Improves Cell Survival by Blocking Voltage-dependent K+ Channels in β Cells
Zhihong Liu, Huanhuan Yang, Linping Zhi, Huan Xue, Zhihong Lu, Yanli Zhao, Lijuan Cui, Tao Liu, Shouan Ren, Peifeng He, Yunfeng Liu, Yi Zhang
Frontiers in Pharmacology.2021;[Epub] CrossRef - Sphingosine-1 Phosphate Lyase Regulates Sensitivity of Pancreatic Beta-Cells to Lipotoxicity
Yadi Tang, Thomas Plötz, Markus H. Gräler, Ewa Gurgul-Convey
International Journal of Molecular Sciences.2021; 22(19): 10893. CrossRef - Sphingolipids and Mitochondrial Dynamic
Lais Brigliadori Fugio, Fernanda B. Coeli-Lacchini, Andréia Machado Leopoldino
Cells.2020; 9(3): 581. CrossRef - Diminished Sphingolipid Metabolism, a Hallmark of Future Type 2 Diabetes Pathogenesis, Is Linked to Pancreatic β Cell Dysfunction
Saifur R. Khan, Yousef Manialawy, Andreea Obersterescu, Brian J. Cox, Erica P. Gunderson, Michael B. Wheeler
iScience.2020; 23(10): 101566. CrossRef - Neuronal Metabolism and Neuroprotection: Neuroprotective Effect of Fingolimod on Menadione-Induced Mitochondrial Damage
Antonio Gil, Elisa Martín-Montañez, Nadia Valverde, Estrella Lara, Federica Boraldi, Silvia Claros, Silvana-Yanina Romero-Zerbo, Oscar Fernández, Jose Pavia, Maria Garcia-Fernandez
Cells.2020; 10(1): 34. CrossRef - WITHDRAWN: Ceramide and Sphingosine 1-Phosphate in adipose dysfunction
Zijian Fang, Susan Pyne, Nigel J. Pyne
Progress in Lipid Research.2019; : 100991. CrossRef - Dynamic of mitochondrial network, cristae, and mitochondrial nucleoids in pancreatic β-cells
Petr Ježek, Andrea Dlasková
Mitochondrion.2019; 49: 245. CrossRef - Sphingosine kinase 1 overexpression induces MFN2 fragmentation and alters mitochondrial matrix Ca2+ handling in HeLa cells
I. Pulli, C. Löf, T. Blom, M.Y. Asghar, T. Lassila, N. Bäck, K.-L. Lin, J.H. Nyström, K. Kemppainen, D.M. Toivola, E. Dufour, A. Sanz, H.M. Cooper, J.B. Parys, K. Törnquist
Biochimica et Biophysica Acta (BBA) - Molecular Cell Research.2019; 1866(9): 1475. CrossRef - Ceramide and sphingosine 1-phosphate in adipose dysfunction
Zijian Fang, Susan Pyne, Nigel J. Pyne
Progress in Lipid Research.2019; 74: 145. CrossRef - S1P/S1P Receptor Signaling in Neuromuscolar Disorders
Elisabetta Meacci, Mercedes Garcia-Gil
International Journal of Molecular Sciences.2019; 20(24): 6364. CrossRef
 PubReader
 ePub Link
 Cite
Cite