
Articles
- Page Path
- HOME > Endocrinol Metab > Volume 36(5); 2021 > Article
-
Original ArticleDiabetes, Obesity and Metabolism Risk of Diabetes in Subjects with Positive Fecal Immunochemical Test: A Nationwide Population-Based Study
-
Kwang Woo Kim1
 , Hyun Jung Lee1, Kyungdo Han2, Jung Min Moon3, Seung Wook Hong4, Eun Ae Kang5, Jooyoung Lee6, Hosim Soh1, Seong-Joon Koh1, Jong Pil Im1, Joo Sung Kim1
 -
Endocrinology and Metabolism 2021;36(5):1069-1077.
DOI: https://doi.org/10.3803/EnM.2021.1119
Published online: October 28, 2021
1Department of Internal Medicine and Liver Research Institute, Seoul National University College of Medicine, Seoul, Korea
2Department of Statistics and Actuarial Science, Soongsil University, Seoul, Korea
3Department of Internal Medicine, Chung-Ang University College of Medicine, Seoul, Korea
4Department of Gastroenterology, Asan Medical Center, University of Ulsan College of Medicine, Seoul, Korea
5Department of Internal Medicine and Institute of Gastroenterology, Yonsei University College of Medicine, Seoul, Korea
6Department of Internal Medicine, Healthcare Research Institute, Seoul National University Hospital Healthcare System Gangnam Center, Seoul, Korea
- Corresponding authors: Joo Sung Kim. Department of Internal Medicine and Liver Research Institute, Seoul National University College of Medicine, 101 Daehak-ro, Jongno-gu, Seoul 03080, Korea Tel: +82-2-740-8112, Fax: +82-2-743-6701, E-mail: jooskim@snu.ac.kr
- Kyungdo Han. Department of Statistics and Actuarial Science, Soongsil University, 369 Sangdoro, Dongjak-gu, Seoul 06978, Korea Tel: +82-2-820-7025, Fax: +82-2-823-1746, E-mail: hkd917@naver.com
Copyright © 2021 Korean Endocrine Society
This is an Open Access article distributed under the terms of the Creative Commons Attribution Non-Commercial License (http://creativecommons.org/licenses/by-nc/4.0/) which permits unrestricted non-commercial use, distribution, and reproduction in any medium, provided the original work is properly cited.
ABSTRACT
-
Background
- Positive fecal immunochemical test (FIT) results have been recently suggested as a risk factor for systemic inflammation. Diabetes induces inflammation in the gastrointestinal tract via several ways. We investigated the association between FIT results and the incidence of diabetes.
-
Methods
- A total of 7,946,393 individuals aged ≥50 years from the National Cancer Screening Program database who underwent FIT for colorectal cancer (CRC) screening from 2009 to 2012 were enrolled. The primary outcome was newly diagnosed diabetes based on the International Classification of Disease 10th revision codes and administration of anti-diabetic medication during the follow-up period.
-
Results
- During a mean follow-up of 6.5 years, the incidence rates of diabetes were 11.97, 13.60, 14.53, and 16.82 per 1,000 personyears in the FIT negative, one-positive, two-positive, and three-positive groups, respectively. The hazard ratios (HRs) for the incidence of diabetes were 1.14 (95% confidence interval [CI], 1.12 to 1.16; HR, 1.21; 95% CI, 1.16 to 1.27; and HR, 1.40; 95% CI, 1.28 to 1.55) in the one-positive, two-positive, and three-positive FIT groups compared with the FIT negative group, respectively. The effect was consistent in individuals with normal fasting blood glucose (adjusted HR 1.55 vs. 1.14, P for interaction <0.001).
-
Conclusion
- Positive FIT results were associated with a significantly higher risk of diabetes, suggesting that the FIT can play a role not only as a CRC screening tool, but also as a surrogate marker of systemic inflammation; thus, increasing the diabetes risk.
- A positive result of blood in feces implies a risk of developing colorectal cancer (CRC) or a precancerous lesion such as an adenoma [1]. The fecal immunochemical test (FIT) applies antibodies against human hemoglobin (Hb) and provides evidence for occult blood in feces [2]. It is widely used for CRC screening because of its convenience of the number of tests required for verification and preparation for the test [3]. It is well known that CRC screening with FIT reduces the incidence and mortality of CRC [4]. The National Cancer Screening Program (NCSP) was developed in 2002 in Korea, and has offered an annual FIT for CRC screening to all Korean men and women aged 50 years old or more since 2004 [5]. As FIT has been used for many years worldwide, positive FIT results have been recently reported to be associated with cardiovascular diseases and all-cause mortality, even excluding death from CRC beyond the presence of colorectal neoplasia [6,7], implicating a possible link with systemic inflammation.
- Diabetes is a serious long-term disease and one of the 10 most common causes of death in adults. The prevalence of diabetes has increased, and 475 million people worldwide had diabetes in 2017 [8]. The many risk factors for diabetes include a family history, presence of an abnormal immune system, age, obesity, physical inactivity, hypertension, and dyslipidemia. Diabetes also induces an inflammation, including in the gastrointestinal tract via oxidative stress, increased levels of inflammatory cytokines, and dysbiosis [9,10]. By linking the previous studies suggesting clinical role of the FIT applying to systemic inflammation and the inflammatory condition in diabetes, we speculated the association between diabetes and FIT results. However, a few research have assessed the relationship between a positive FIT result and the incidence of diabetes. Therefore, we investigated the association between FIT results and diabetes risk in the general Korean population.
INTRODUCTION
- Data sources and the study population
- The National Health Insurance Service (NHIS) is a public health insurance system that support most of the general Korean population (approximately 97%). The NHIS database includes demographics, disease diagnoses, medical treatments, and laboratory data.
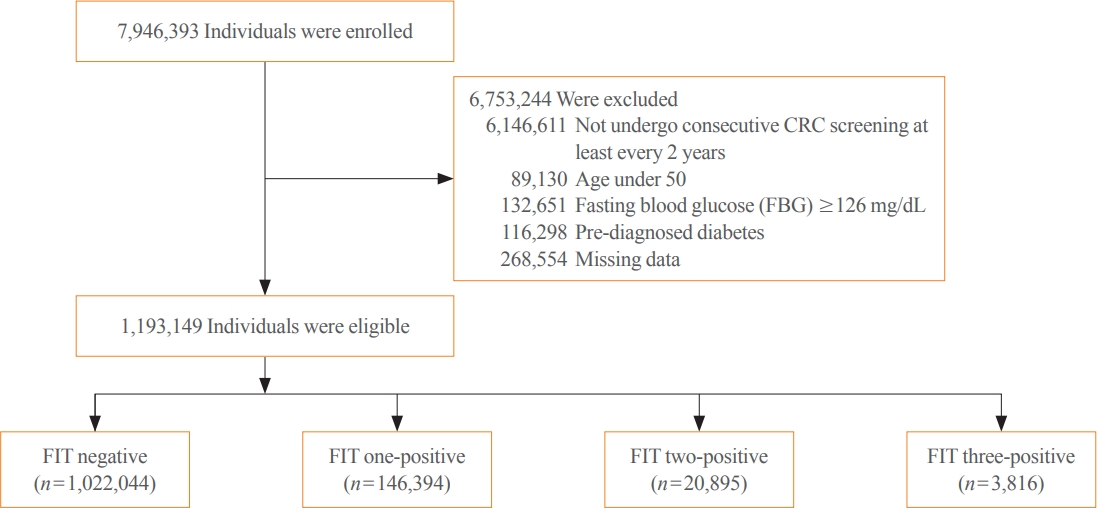
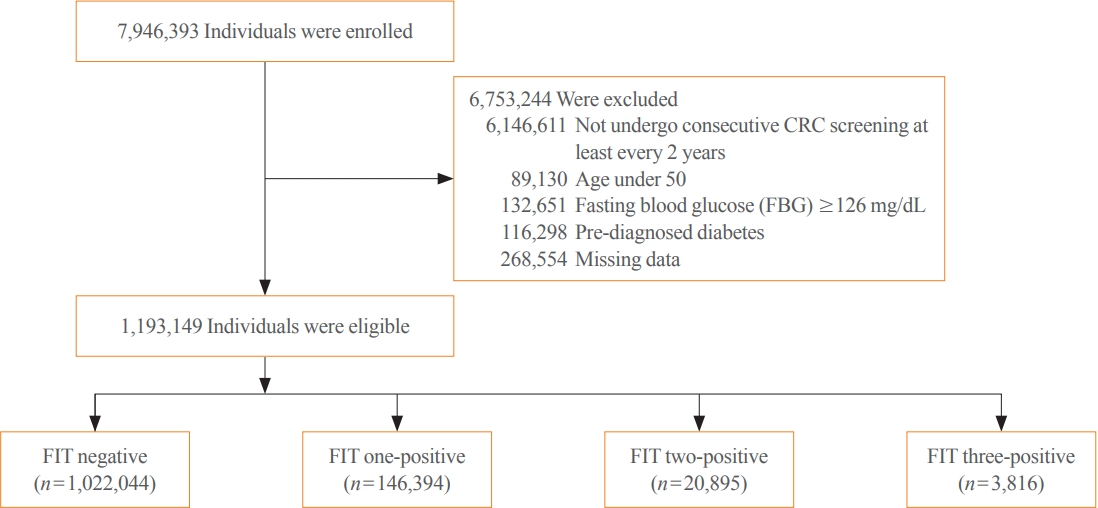
- We conducted a retrospective, nationwide population-based cohort study using the NCSP data in the NHIS database. In total, 7,946,393 individuals aged ≥50 years who underwent the FIT for CRC screening between January 2009 and December 2012 were enrolled. Participants who did not undergo consecutive CRC screenings at least every 2 years, those with missing data, those with fasting blood glucose (FBG) ≥126 mg/dL in the health check-up database, and those diagnosed with diabetes prior to enrollment were excluded. A total of 1,193,149 participants were finally included as the study population and were followed up until diabetes was diagnosed or until December 2017 (Fig. 1). This study was approved by the Institutional Review Board of Seoul National University Hospital (IRB number, E-1906-008-1036) and informed consent was waived by the board.
- Data collection
- The data investigated included age, sex, smoking status, alcohol consumption, income level, physical activity, presence of diabetes, hypertension, hypercholesterolemia, metabolic syndrome, lipid level, glucose level, body mass index (BMI), waist circumference, estimated glomerular filtration rate, and history of malignancy including CRC.
- Detailed information regarding smoking status, alcohol consumption and physical activity of the study participants was assessed via standardized self-reported questionnaires. Smoking status was classified as current, ex-, and non-smoker. The classification was defined as follows: non-smoker, those with less than five packs of smoking history; ex-smoker, those with five or more packs of smoking history but had quit smoking; current smoker, those with five or more packs of smoking history and currently smoking. Heavy drinkers were defined if the amount of alcohol consumed exceeded 30 g/day. Exercise was defined as ‘yes’ in the case of moderate intensity for 30 min/day, at least 5 day/week or vigorous exercise for 20 min/day, at least 3 day/week. The history of malignancy and CRC were defined according to the International Classification of Diseases, 10th Revision (ICD-10) codes (V193 & ICD-10 C code; V193 & ICD-10 codes C18-20, respectively).
- The normal range of waist circumference was defined as <90 cm in men and <85 cm in woman. Obesity was defined as BMI >25 kg/m2 according to the Asia-Pacific BMI criteria established by the Western Pacific Region of the World Health Organization [11]. Hypertension or hypercholesterolemia was diagnosed using laboratory data (systolic blood pressure ≥140 mm Hg or diastolic blood pressure ≥90 mm Hg; total cholesterol level ≥240 mg/dL, respectively) or by ICD code (ICD-10 codes I10–I15; E78, respectively) with the list of prescribed medicines. The definitions with ICD-10 codes were validated in the previous study [12]. Metabolic syndrome was defined as a combination of the following; hyperglycemia, central obesity, atherogenic dyslipidemia, and hypertension according to the National Cholesterol Education Program Expert Panel and Adult Treatment Panel III criteria.
- FIT measurements
- Subjects who underwent CRC screening sampled their stool using either a qualitative or a quantitative 1-day sampling method. They were educated to avoid contact with urine or water before sampling the stool. After sampling, the subjects submitted the stool immediately or stored it in a refrigerator shortly before submission if they could not submit the samples immediately. There were various data from the hospitals and the details of the kits were different. The OC-Hemocatch Light kit (Eiken Chemical Co., Tokyo, Japan) with a cut-off value of 50 ng Hb per milliliter of buffer (ng Hb/mL); the FOB test kit (Humasis Co., Seoul, Korea) with a cut-off value of 50 ng Hb/mL; ASAN Easy Test FOB kit (Asan Pharm Co., Seoul, Korea) with a cut-off value of 50 ng Hb/mL; and the SD Bioline FOB kit (SD Co., Seoul, Korea) with a cut-off value of 30 ng Hb/mL were used for the qualitative method. The OC-Sensor DIANA kit (Eiken Chemical Co.) with a cut-off value of 100 ng Hb/mL; the Hemo Tech NS-1000 kit (Alfresa Pharma Co., Osaka, Japan) with a cut-off value of 40 ng Hb/mL; and the Medex HM-JACK kit (Kyowa Chemical Industry Co., Kagawa, Japan) with a cut-off value of 30 ng Hb/mL, were used for the quantitative method. The positivity of the FIT results was defined by the cut-off value of each test kit, as positive above the point and negative below the point [13].
- Study endpoints
- The primary outcome was newly diagnosed diabetes, which was identified based on the ICD-10 codes E11, E12, E13, or E14 and administration of anti-diabetic medication during the follow-up. This operational definition of diabetes was validated in a previous study [14]. Subjects who were diagnosed with diabetes within 1 year from the index date were excluded because of the possibility of not being causally related to a positive FIT result.
- Statistical analysis
- Data were analyzed using Student’s t test for normally distributed continuous variables and the chi-square test for categorical variables. Incidence rate was calculated as the number of newly diagnosed diabetes cases per 1,000 person-years. The hazard ratio (HR) for the risk of diabetes in the positive FIT group was calculated after adjusting for age, sex, smoking status, alcohol consumption, regular exercise, BMI, FBG, and use of statin using the Cox-proportional hazard model. The incidence rate of diabetes in each group was estimated by a Kaplan-Meier analysis and the log-rank test. A P<0.05 was considered significant. The SAS version 9.3 (SAS Institute, Cary, NC, USA) and SPSS version 25.0 (IBM Co., Armonk, NY, USA) software packages were used for statistical analyses.
METHODS
- Baseline characteristics of the study population
- Of the 1,193,149 individuals, 171,105 patients (14.3%) had positive FIT results and were divided into four groups according to the number of positive FIT results: negative (n=1,022,044), one-positive (n=146,394), two-positive (n=20,895), and threepositive results (n=3,816). The baseline characteristics are shown in Table 1. Participants with more positive FIT results were more likely to be older, male, current smokers, and heavy alcohol drinkers, have a higher BMI, weight, height, and waist circumference, and have lower rates of low income (all P<0.001). In addition, they tended to have more comorbidities, such as hypertension, hypercholesterolemia and metabolic syndrome (all P<0.001). However, subjects who exercised regularly had significantly fewer positive FIT results (P<0.001).
- The incidence of diabetes according to the number of positive FIT results
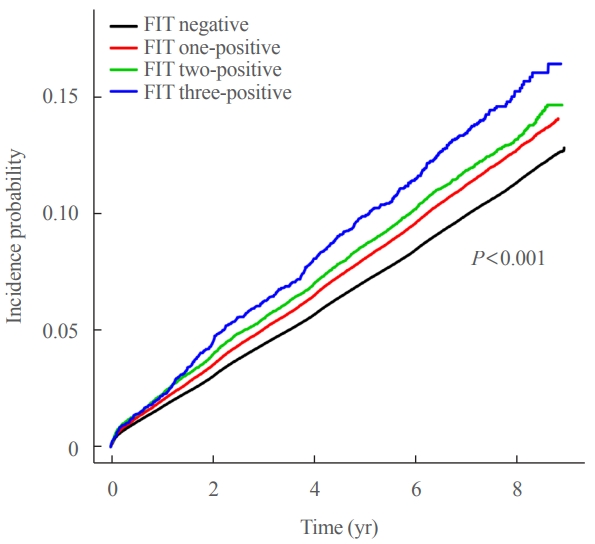
- During a mean follow-up of 6.5 years, 94,635 incident cases of diabetes (7.9% of the total study population) were identified. The incidence rates of diabetes were 11.97, 13.60, 14.53, and 16.82 per 1,000 person-years in the FIT negative, one-positive, two-positive, and three-positive results groups, respectively (Table 2). The cumulative risk of diabetes increased gradually as the number of positive FIT results increased, and a significantly different risk was observed according to the frequency of FIT positivity (Fig. 2).
- The HRs for diabetes incidence were 1.14 (95% confidence interval [CI], 1.12 to 1.16), 1.21 (95% CI, 1.16 to 1.27), and 1.40 (95% CI, 1.28 to 1.55) in the one-positive, two-positive, and three-positive FIT groups compared with those in the FIT negative group, respectively (log-rank P<0.001) (Table 2). A higher number of FIT-positive results was significantly associated with the incidence of diabetes. Moreover, similar significant associations were observed between the number of FIT-positive results and the incidence of diabetes after adjusting for age, sex, smoking, alcohol consumption, regular exercise, BMI, FBG, and use of statin.
- Subgroup analysis of the incidence of diabetes
- The trend for an increased incidence of diabetes with the increase in the number of FIT-positive results was consistently observed in all subgroups. Among the subgroups, the effect of positive FIT results on the development of diabetes was more prominent in individuals with a normal FBG (<100 mg/dL) (adjusted HR 1.55 vs. 1.14, P for interaction <0.001) (Table 3).
- As the FIT results and diabetes are both associated with malignancies, such as CRC, we further stratified the total population according to the presence of all cancers including CRC, and analyzed the association between positive FIT results and the incidence of diabetes (Table 4). However, no significant effects of all cancers and CRC on the incidence of diabetes were detected as the number of positive FIT results increased (P for interaction 0.5375 and 0.3124, respectively).
RESULTS
- In this population-based study, a positive FIT result was associated with a significantly increased risk of diabetes and a linear relationship was found between the number of FIT-positive cases and the incidence of diabetes. These results were consistent even after adjusting for well-known diabetes risk factors, including age, sex, and obesity. Our study also demonstrated a greater effect of positive FIT results on the incidence of diabetes in individuals with a normal FBG.
- The prevalence of diabetes is rapidly increasing in the AsiaPacific region, which has been mainly attributed to a global increase in obesity [15]. The increase in the incidence of diabetes has become a medical concern due to long-term complications and the economic burden. The FIT, generally used as a CRC screening tool, has been demonstrated to reflect colonic mucosal inflammation in inflammatory bowel disease, as well as systemic inflammation related to all-cause mortality [7,16]. Diabetes is also related to a chronically inflamed environment; however, only a few studies have found positive FIT results that are correlated with diabetes risk but the results were inconsistent. A Japanese cross-sectional study reported that a positive fecal occult blood test (FOBT) group has a significantly higher glycated hemoglobin (HbA1c) level than that of a negative FOBT group even in subjects not receiving anti-diabetic medications [17]. A Taiwanese cross-sectional study showed an increased tendency for FIT positivity in a diabetic group compared to a nondiabetic group [18]. Our study is the first to clarify the association with a positive FIT result and the development of diabetes in a general population.
- Several possible mechanisms might be involved in the association between FIT positivity and the incidence of diabetes. First, hyperglycemia and advanced glycation end-products, which are a by-product of hyperglycemia, cause predisposing micro-/macroangiopathy. These end-products inhibit the synthesis of nitric oxide and induce oxidative stress [9]. Increased levels of tumor necrosis factor-α, a key factor of angiogenesis, as well as other cytokines, including interleukin (IL)-1 and IL-6, and C-reactive protein are detected in patients with diabetes [19]. These series of changes in the gastrointestinal tract consequently elicit microhemorrhages that produce a positive FIT result [20,21]. These findings suggest that diabetes itself can be a systemic inflammation factor, particularly in the gut, by inducing generalized colonic inflammation [22]. A positive FIT result may be a marker reflecting systemic inflammation.
- The gut microbiome may provide another potential link between a positive FIT result and diabetes. Some studies show that diabetes has a significant effect on the gut microbiome and gut barrier integrity [23,24]. The gut microbiota is significantly different between diabetic patients and healthy individuals as the proportions of Firmicutes and Clostridium are reduced and the levels of Bacteroides and Escherichia coli increase in diabetic groups [10]. The dysbiosis observed in type 2 diabetes patients activates low-grade chronic inflammation of islets, which can cause damage and dysfunction of islet β-cells [25]. In addition, metabolites from the gut microbes contribute to gut barrier integrity. A compromised barrier leads to leakage of inflammatory mediators into the systemic circulation and, therefore, increases insulin resistance [24].
- Many epidemiological studies have reported an increased risk of cancer, including stomach, colorectal, liver, pancreatic, and kidney cancer in patients with diabetes [26]. Hyperinsulinemia, hyperglycemia, and chronic inflammation have been implicated in increasing the cancer risk through their effects on the neoplastic process [27]. In particular, type 2 diabetes significantly increases the risk for CRC [28], and a higher HbA1c level is associated with a higher prevalence of colorectal neoplasia [18]. However, when we conducted subgroup analyses according to the presence of cancer, the increased risk for the development of diabetes was consistent regardless of the presence of any cancer and CRC. We postulate that FIT positivity itself could be an independent predictor of diabetes.
- The most intriguing finding in this study was that the effect of prediabetes and obesity on the incidence of diabetes in FIT-positive populations was different. Prediabetes and obesity are two predominant risk factors for the development of diabetes [29]. The association between FIT positivity and the development of diabetes was more prominent in those with a normal FBG, which could be explained that the effect of high FBG is dominant in subjects who already have prediabetes, compared to the effect of FIT positivity. In other words, baseline FBG has a stronger influence than a positive FIT result on the development of diabetes. Positive FIT results were consistently associated with a diabetes risk in the obese and non-obese subgroups. Further studies are required to reveal the different effects of FIT positivity on the relationship between well-known risk factors and diabetes.
- This study had some limitations. First, as the diagnosis of diabetes was defined only by ICD-10 codes and administration of anti-diabetic medications [14], subjects who satisfied postprandial diagnostic criteria for diabetes or did not visit a hospital during the study period could have been missed from our data. In addition, less-severe or untreated diabetic patients could be a risk of misclassification. Therefore, further studies regarding appropriate operational definitions are required to minimize the inaccurate results. Second, we could not evaluate the correlation between positive FIT results and the HbA1c levels of the diabetic population, and the NHIS database did not provide HbA1c levels. Third, the NCSP has provided an annual FIT to all Korean adults above 50 years of age, however, still only one-third of the general population received CRC screening [30]. Though we included all the individuals who underwent the FIT during the study period and the trend of CRC screening rates increased annually, further studies to identify factors that influence screening rates and enhance the compliance are needed. Fourth, the data about antithrombotic drugs were not available which could lead to false-positive FIT results. In addition, we could not obtain data regarding endoscopic or pathological findings. Instead, subgroup analyses with subjects without all cancer and CRC revealed robust results. Finally, it was not possible to determine an accurate causal relationship due to the nature of a retrospective epidemiological study.
- In conclusion, participants with a positive FIT result had a significantly higher risk of diabetes compared with those with a negative FIT result, after adjusting for conventional risk factors. In addition, a dose-relationship was observed between FIT positivity and the incidence of diabetes. These results suggest that FIT can play a role not only as a CRC screening tool, but also as a surrogate marker of systemic inflammation and thus in increasing the diabetes risk.
DISCUSSION
-
CONFLICTS OF INTEREST
No potential conflict of interest relevant to this article was reported.
-
AUTHOR CONTRIBUTIONS
Conception or design: K.W.K., K.H., J.S.K. Acquisition, analysis, or interpretation of data: K.W.K., H.J.L., K.H., J.M.M., S.W.H., E.A.K., J.L., H.S., S.J.K., J.P.I., J.S.K. Drafting the work or revising: K.W.K., H.J.L., K.H., J.S.K. Final approval of the manuscript: K.W.K., K.H., J.S.K.
Article information

| No. of positive FIT results | Number | Diabetes | IR |
HR (95% CI) |
|||
|---|---|---|---|---|---|---|---|
| Model 1a | Model 2b | Model 3c | Model 4d | ||||
| 0 | 1,022,044 | 79,399 | 11.97 | 1e | 1e | 1e | 1e |
| 1 | 146,394 | 12,876 | 13.60 | 1.14 (1.12–1.16) | 1.11 (1.09–1.13) | 1.08 (1.06–1.10) | 1.07 (1.05–1.09) |
| 2 | 20,895 | 1,946 | 14.53 | 1.21 (1.16–1.27) | 1.17 (1.11–1.22) | 1.10 (1.05–1.15) | 1.08 (1.03–1.13) |
| 3 | 3,816 | 414 | 16.82 | 1.40 (1.28–1.55) | 1.35 (1.23–1.49) | 1.35 (1.23–1.49) | 1.31 (1.19–1.45) |
FIT, fecal immunochemical test; IR, incidence rate (per 1,000 person-years); HR, hazard ratio; CI, confidence interval.
a Not adjusted;
b Adjusted with age, sex;
c Adjusted with age, sex, smoking status, alcohol consumption, regular exercise, body mass index, fasting blood glucose;
d Adjusted with age, sex, smoking status, alcohol consumption, regular exercise, body mass index, fasting blood glucose, use of statin;
e As reference value.
| Subgroup | No. of positive FIT results | IR | HR (95% CI) Model 4a | P for interaction |
|---|---|---|---|---|
| Age, yr | 0.0557 | |||
| <65 | 0 | 10.24 | 1b | |
| 1 | 11.64 | 1.08 (1.05–1.11) | ||
| 2 | 11.80 | 1.03 (0.96–1.09) | ||
| 3 | 14.32 | 1.23 (1.07–1.40) | ||
| ≥65 | 0 | 15.29 | 1b | |
| 1 | 16.86 | 1.06 (1.04–1.09) | ||
| 2 | 18.75 | 1,15 (1.08–1.22) | ||
| 3 | 21.04 | 1.41 (1.22–1.62) | ||
| Sex | 0.2698 | |||
| Male | 0 | 12.97 | 1b | |
| 1 | 14.58 | 1.08 (1.05–1.10) | ||
| 2 | 15.65 | 1.12 (1.06–1.19) | ||
| 3 | 17.02 | 1.30 (1.16–1.47) | ||
| Female | 0 | 11.24 | 1b | |
| 1 | 12.65 | 1.06 (1.04–1.09) | ||
| 2 | 13.01 | 1.02 (0.95–1.10) | ||
| 3 | 16.43 | 1.34 (1.13–1.59) | ||
| Obesity | 0.0024 | |||
| No | 0 | 8.87 | 1b | |
| 1 | 10.22 | 1.08 (1.05–1.11) | ||
| 2 | 11.51 | 1.15 (1.08–1.23) | ||
| 3 | 12.48 | 1,30 (1.13–1.50) | ||
| Yes | 0 | 18.10 | 1b | |
| 1 | 19.91 | 1.06 (1.03–1.09) | ||
| 2 | 19.80 | 1.02 (0.96–1.09) | ||
| 3 | 23.79 | 1.32 (1.15–1.50) | ||
| Hypertension | 0.9871 | |||
| No | 0 | 8.72 | 1b | |
| 1 | 9.72 | 1.05 (1.02–1.09) | ||
| 2 | 10.31 | 1.06 (0.99–1.14) | ||
| 3 | 12.55 | 1.31 (1.12–1.53) | ||
| Yes | 0 | 16.63 | 1b | |
| 1 | 18.46 | 1.08 (1.05–1.10) | ||
| 2 | 19.25 | 1.09 (1.03–1.15) | ||
| 3 | 21.66 | 1.30 (1.14–1.47) | ||
| Hypercholesterolemia | <0.0001 | |||
| No | 0 | 9.87 | 1b | |
| 1 | 11.40 | 1.07 (1.05–1.09) | ||
| 2 | 11.79 | 1.08 (1.03–1.13) | ||
| 3 | 15.69 | 1.33 (1.20–1.46) | ||
| Yes | 0 | 16.93 | 1b | |
| 1 | 18.67 | 0.96 (0.89–1.05) | ||
| 2 | 20.80 | 1.15 (0.94–1.39) | ||
| 3 | 19.27 | 1.08 (0.67–1.74) | ||
| FBG, mg/dL | <0.0001 | |||
| <100 | 0 | 6.24 | 1b | |
| 1 | 7.36 | 1.12 (1.09–1.15) | ||
| 2 | 8.59 | 1.26 (1.18–1.36) | ||
| 3 | 10.52 | 1.55 (1.34–1.80) | ||
| ≥100 | 0 | 25.85 | 1b | |
| 1 | 27.62 | 1,04 (1.01–1.06) | ||
| 2 | 27.07 | 0.98 (0.93–1.04) | ||
| 3 | 30.69 | 1.14 (1.00–1.29) | ||
| Metabolic syndrome | <0.0001 | |||
| No | 0 | 6.53 | 1b | |
| 1 | 7.67 | 1.11 (1.08–1.15) | ||
| 2 | 8.08 | 1.13 (1.04–1.22) | ||
| 3 | 10.56 | 1.48 (1.26–1.73) | ||
| Yes | 0 | 21.15 | 1b | |
| 1 | 22.81 | 1.04 (1.02–1.07) | ||
| 2 | 23.77 | 1.05 (0.99–1.11) | ||
| 3 | 25.83 | 1.22 (1.08–1.38) | ||
| Smoking | 0.0439 | |||
| Non-smoker | 0 | 11.21 | 1b | |
| 1 | 12.69 | 1.07 (1.04–1.09) | ||
| 2 | 13.50 | 1.09 (1.03–1.15) | ||
| 3 | 16.33 | 1.34 (1.19–1.52) | ||
| Ex-smoker | 0 | 12.92 | 1b | |
| 1 | 13.92 | 1.03 (0.99–1.08) | ||
| 2 | 15.81 | 1.16 (1.06–1.27) | ||
| 3 | 16.40 | 1.31 (1.06–1.62) | ||
| Current smoker | 0 | 15.56 | 1b | |
| 1 | 17.74 | 1.12 (1.07–1.17) | ||
| 2 | 16.50 | 0.99 (0.89–1.10) | ||
| 3 | 18.27 | 1.22 (0.97–1.52) | ||
| Heavy drinker | 0.7031 | |||
| No | 0 | 11.89 | 1b | |
| 1 | 13.46 | 1.07 (1.05–1.09) | ||
| 2 | 14.38 | 1.08 (1.03–1.13) | ||
| 3 | 16.70 | 1.33 (1.20–1.47) | ||
| Yes | 0 | 14.08 | 1b | |
| 1 | 16.41 | 1.12 (1.03–1.21) | ||
| 2 | 16.56 | 1.09 (0.92–1.29) | ||
| 3 | 18.35 | 1.20 (0.86–1.69) | ||
| Regular exercise | 0.2150 | |||
| No | 0 | 12.81 | 1b | |
| 1 | 14.31 | 1.05 (1.03–1.08) | ||
| 2 | 15.29 | 1.06 (1.00–1.13) | ||
| 3 | 19.18 | 1.37 (1.20–1.56) | ||
| Yes | 0 | 11.15 | 1b | |
| 1 | 12.86 | 1.09 (1.06–1.12) | ||
| 2 | 13.74 | 1.11 (1.04–1.19) | ||
| 3 | 14.77 | 1.26 (1.09–1.45) |
FIT, fecal immunochemical test; IR, incidence rate (per 1,000 person-years); HR, hazard ratio; CI, confidence intervals; FBG, fasting blood glucose.
a Adjusted with age, sex, smoking status, alcohol consumption, regular exercise, body mass index, fasting blood glucose, use of statin;
b As reference value.
| Subgroup | No. of positive FIT results | IR | HR (95% CI) Model 4a | P for interaction |
|---|---|---|---|---|
| History of malignancy | 0.5375 | |||
| No | 0 | 11.89 | 1b | |
| 1 | 13.47 | 1.07 (1.05–1.09) | ||
| 2 | 14.25 | 1.07 (1.02–1.12) | ||
| 3 | 16.93 | 1.33 (1.20–1.46) | ||
| Yes | 0 | 14.23 | 1b | |
| 1 | 16.52 | 1.07 (0.98–1.16) | ||
| 2 | 20.47 | 1.19 (0.99–1.43) | ||
| 3 | 14.45 | 0.99 (0.59–1.64) | ||
| History of colorectal cancer | 0.3124 | |||
| No | 0 | 11.96 | 1b | |
| 1 | 13.57 | 1.07 (1.05–1.09) | ||
| 2 | 14.46 | 1.08 (1.03–1.13) | ||
| 3 | 16.77 | 1.32 (1.20–1.45) | ||
| Yes | 0 | 15.64 | 1b | |
| 1 | 15.92 | 0.91 (0.71–1.17) | ||
| 2 | 17.02 | 0.95 (0.63–1.41) | ||
| 3 | 8.50 | 0.56 (0.14–2.28) |
- 1. Carroll MR, Seaman HE, Halloran SP. Tests and investigations for colorectal cancer screening. Clin Biochem 2014;47:921–39.ArticlePubMed
- 2. Chen LS, Yen AM, Fraser CG, Chiu SY, Fann JC, Wang PE, et al. Impact of faecal haemoglobin concentration on colorectal cancer mortality and all-cause death. BMJ Open 2013;3:e003740.ArticlePubMedPMC
- 3. Schreuders EH, Ruco A, Rabeneck L, Schoen RE, Sung JJ, Young GP, et al. Colorectal cancer screening: a global overview of existing programmes. Gut 2015;64:1637–49.ArticlePubMed
- 4. Ladabaum U, Dominitz JA, Kahi C, Schoen RE. Strategies for colorectal cancer screening. Gastroenterology 2020;158:418–32.ArticlePubMed
- 5. Sohn DK, Kim MJ, Park Y, Suh M, Shin A, Lee HY, et al. The Korean guideline for colorectal cancer screening. J Korean Med Assoc 2015;58:420–32.Article
- 6. Moon JM, Lee HJ, Han K, Kim DH, Hong SW, Soh H, et al. Occult blood in feces is associated with an increased risk of ischemic stroke and myocardial infarction: a nationwide population study. J Am Heart Assoc 2021;10:e017783.ArticlePubMed
- 7. Libby G, Fraser CG, Carey FA, Brewster DH, Steele RJ. Occult blood in faeces is associated with all-cause and non-colorectal cancer mortality. Gut 2018;67:2116–23.ArticlePubMed
- 8. GBD 2017 Disease and Injury Incidence and Prevalence Collaborators. Global, regional, and national incidence, prevalence, and years lived with disability for 354 diseases and injuries for 195 countries and territories, 1990-2017: a systematic analysis for the Global Burden of Disease Study 2017. Lancet 2018;392:1789–858.PubMedPMC
- 9. Bassi R, Trevisani A, Tezza S, Ben Nasr M, Gatti F, Vergani A, et al. Regenerative therapies for diabetic microangiopathy. Exp Diabetes Res 2012;2012:916560.ArticlePubMedPMC
- 10. Larsen N, Vogensen FK, van den Berg FW, Nielsen DS, Andreasen AS, Pedersen BK, et al. Gut microbiota in human adults with type 2 diabetes differs from non-diabetic adults. PLoS One 2010;5:e9085.ArticlePubMedPMC
- 11. Seo MH, Lee WY, Kim SS, Kang JH, Kang JH, Kim KK, et al. 2018 Korean Society for the Study of Obesity guideline for the management of obesity in Korea. J Obes Metab Syndr 2019;28:40–5.ArticlePubMedPMC
- 12. Kim MK, Han K, Park YM, Kwon HS, Kang G, Yoon KH, et al. Associations of variability in blood pressure, glucose and cholesterol concentrations, and body mass index with mortality and cardiovascular outcomes in the general population. Circulation 2018;138:2627–37.ArticlePubMed
- 13. Cha JM, Suh M, Kwak MS, Sung NY, Choi KS, Park B, et al. Risk of interval cancer in fecal immunochemical test screening significantly higher during the summer months: results from the National Cancer Screening Program in Korea. Am J Gastroenterol 2018;113:611–21.ArticlePubMed
- 14. Lee YH, Han K, Ko SH, Ko KS, Lee KU; Taskforce Team of Diabetes Fact Sheet of the Korean Diabetes Association. Data analytic process of a nationwide population-based study using National Health Information Database established by National Health Insurance Service. Diabetes Metab J 2016;40:79–82.ArticlePubMedPMC
- 15. Rhee EJ. Diabetes in Asians. Endocrinol Metab (Seoul) 2015;30:263–9.ArticlePubMedPMC
- 16. Dai C, Jiang M, Sun MJ, Cao Q. Fecal immunochemical test for predicting mucosal healing in ulcerative colitis patients: a systematic review and meta-analysis. J Gastroenterol Hepatol 2018;33:990–7.ArticlePubMed
- 17. Nakajima K, Suwa K. Association between positive fecal occult blood test and diabetes in a population undergoing health screening. Clin Biochem 2017;50:97–100.ArticlePubMed
- 18. Tseng PH, Lee YC, Chiu HM, Chen CC, Liao WC, Tu CH, et al. Association of diabetes and HbA1c levels with gastrointestinal manifestations. Diabetes Care 2012;35:1053–60.ArticlePubMedPMC
- 19. Lainampetch J, Panprathip P, Phosat C, Chumpathat N, Prangthip P, Soonthornworasiri N, et al. Association of tumor necrosis factor alpha, interleukin 6, and C-reactive protein with the risk of developing type 2 diabetes: a retrospective cohort study of rural Thais. J Diabetes Res 2019;2019:9051929.ArticlePubMedPMC
- 20. De Las Casas LE, Finley JL. Diabetic microangiopathy in the small bowel. Histopathology 1999;35:267–70.ArticlePubMed
- 21. Sasor A, Ohlsson B. Microangiopathy is common in submucosal vessels of the colon in patients with diabetes mellitus. Rev Diabet Stud 2014;11:175–80.ArticlePubMedPMC
- 22. Mine S, Takeshima F, Akazawa Y, Matsushima K, Minami H, Yamaguchi N, et al. Correlation of fecal markers with magnifying endoscopic stratification in patients with ulcerative colitis who are in clinical remission. Digestion 2018;97:82–9.ArticlePubMed
- 23. Sharma S, Tripathi P. Gut microbiome and type 2 diabetes: where we are and where to go? J Nutr Biochem 2019;63:101–8.ArticlePubMed
- 24. Upadhyaya S, Banerjee G. Type 2 diabetes and gut microbiome: at the intersection of known and unknown. Gut Microbes 2015;6:85–92.ArticlePubMedPMC
- 25. Wang H, Lu Y, Yan Y, Tian S, Zheng D, Leng D, et al. Promising treatment for type 2 diabetes: fecal microbiota transplantation reverses insulin resistance and impaired islets. Front Cell Infect Microbiol 2020;9:455.ArticlePubMedPMC
- 26. Kim SK, Jang JY, Kim DL, Rhyu YA, Lee SE, Ko SH, et al. Site-specific cancer risk in patients with type 2 diabetes: a nationwide population-based cohort study in Korea. Korean J Intern Med 2020;35:641–51.ArticlePubMed
- 27. Garg SK, Maurer H, Reed K, Selagamsetty R. Diabetes and cancer: two diseases with obesity as a common risk factor. Diabetes Obes Metab 2014;16:97–110.ArticlePubMed
- 28. Jee SH, Ohrr H, Sull JW, Yun JE, Ji M, Samet JM. Fasting serum glucose level and cancer risk in Korean men and women. JAMA 2005;293:194–202.ArticlePubMed
- 29. Rhee EJ, Cho JH, Kwon H, Park SE, Jung JH, Han KD, et al. Relation between baseline height and new diabetes development: a nationwide population-based study. Diabetes Metab J 2019;43:794–803.ArticlePubMedPMC
- 30. Ministry of Health and Welfare. National cancer screening program [Internet]. Wonju: NHIS; 2021 [cited 2021 Sep 13]. Available from: https://www.index.go.kr/potal/main/EachDtlPageDetail.do?idx_cd=1440.
References
Figure & Data
References
Citations
- Uncovering a dose-response relationship between positive fecal immunochemical test (FIT) and all-cause, cardiovascular and cancer-related mortality
Chi Pang Wen, Min Kuang Tsai, June Han Lee, Hung Yi Chiou, Christopher Wen, Ta-Wei David Chu, Chien Hua Chen
European Journal of Internal Medicine.2024; 120: 69. CrossRef - Faecal haemoglobin concentrations are associated with all-cause mortality and cause of death in colorectal cancer screening
Lasse Kaalby, Ulrik Deding, Issam Al-Najami, Gabriele Berg-Beckhoff, Thomas Bjørsum-Meyer, Tinne Laurberg, Aasma Shaukat, Robert J. C. Steele, Anastasios Koulaouzidis, Morten Rasmussen, Morten Kobaek-Larsen, Gunnar Baatrup
BMC Medicine.2023;[Epub] CrossRef - Positive Results from the Fecal Immunochemical Test Can Be Related to Dementia: A Nationwide Population-Based Study in South Korea
Yu Kyung Jun, Seung Woo Lee, Kwang Woo Kim, Jung Min Moon, Seong-Joon Koh, Hyun Jung Lee, Joo Sung Kim, Kyungdo Han, Jong Pil Im
Journal of Alzheimer's Disease.2023; 91(4): 1515. CrossRef - Faecal Haemoglobin Estimated by Faecal Immunochemical Tests—An Indicator of Systemic Inflammation with Real Clinical Potential
Karen N. Barnett, Gavin R. C. Clark, Robert J. C. Steele, Callum G. Fraser
Diagnostics.2021; 11(11): 2093. CrossRef
 PubReader
 ePub Link
 Cite
Cite- Figure
-
- Related articles
-
- Increased Risk of Hip Fracture in Patients with Acromegaly: A Nationwide Cohort Study in Korea
- Risk of Cause-Specific Mortality across Glucose Spectrum in Elderly People: A Nationwide Population-Based Cohort Study
- Risk and Risk Factors for Postpartum Type 2 Diabetes Mellitus in Women with Gestational Diabetes: A Korean Nationwide Cohort Study

