Articles
- Page Path
- HOME > Endocrinol Metab > Volume 33(1); 2018 > Article
-
Original ArticleCombined Effects of Baicalein and Docetaxel on Apoptosis in 8505c Anaplastic Thyroid Cancer Cells via Downregulation of the ERK and Akt/mTOR Pathways
-
Chan Ho Park*
 , Se Eun Han*, Il Seong Nam-Goong, Young Il Kim, Eun Sook Kim
 -
Endocrinology and Metabolism 2018;33(1):121-132.
DOI: https://doi.org/10.3803/EnM.2018.33.1.121
Published online: March 21, 2018
Department of Internal Medicine, Ulsan University Hospital, University of Ulsan College of Medicine, Ulsan, Korea.
- Corresponding author: Eun Sook Kim. Department of Internal Medicine, Ulsan University Hospital, University of Ulsan College of Medicine, 877 Bangeojinsunhwan-doro, Dong-gu, Ulsan 44033, Korea. Tel: +82-52-250-8837, Fax: +82-52-250-7048, endo10@daum.net
- *These authors contributed equally to this work.
Copyright © 2018 Korean Endocrine Society
This is an Open Access article distributed under the terms of the Creative Commons Attribution Non-Commercial License (http://creativecommons.org/licenses/by-nc/4.0/) which permits unrestricted non-commercial use, distribution, and reproduction in any medium, provided the original work is properly cited.
ABSTRACT
-
Background
- Anaplastic thyroid cancer (ATC) is one of the most lethal human malignancies. Docetaxel, a microtubule stabilizer, is a common chemotherapeutic agent used to treat various metastatic cancers. However, prolonged use results in various side effects and drug resistance. Flavonoids, such as baicalein, are accepted chemotherapeutic and dietary chemopreventive agents with many advantages, such as greater accessibility, affordability, and lower toxicity, compared with traditional chemotherapy agents. In this study, we evaluated whether baicalein enhances the effects of docetaxel on apoptosis and metastasis in 8505c ATC cells.
-
Methods
- The 8505c cells were treated with baicalein or docetaxel individually and in combination. Cell viability was measured by MTT (thiazolyl blue tetrazolium bromide) assay, and apoptosis was detected by fluorescence microscopy of Hoechst-stained cells. The expression of apoptotic (Bax and caspase-3), anti-apoptotic (Bcl-2), angiogenic (vascular endothelial growth factor [VEGF], transforming growth factor β [TGF-β], E-cadherin, and N-cadherin), and signaling (extracellular signal-regulated kinase [ERK] mitogen activated protein kinase [MAPK], Akt, and mammalian target of rapamycin [mTOR]) proteins was determined by Western blot analysis.
-
Results
- The combination of baicalein (50 or 100 µM) and docetaxel (10 nM) significantly inhibited proliferation and induced apoptosis compared with monotherapies. The combination treatment significantly inhibited the expression of Bax, caspase-3, VEGF, TGF-β1, E-cadherin, N-cadherin, and mTOR, but decreased the expression of Bcl-2 and significantly decreased the phosphorylation of ERK and Akt.
-
Conclusion
- The combination of baicalein and docetaxel effectively induced apoptosis and inhibited metastasis in 8505c cells through downregulation of apoptotic and angiogenic protein expression and blocking of the ERK and Akt/mTOR pathways in 8505c cells. These results suggest that baicalein enhances the anticancer effects of docetaxel in ATC.
- Thyroid cancer is one of the most common endocrine malignancies in South Korea. Malignant thyroid cancer can be classified into three types: differentiated thyroid cancer, such as papillary thyroid cancer, follicular thyroid cancer, medullary thyroid cancer, and anaplastic thyroid cancer (ATC) [1]. ATC, an undifferentiated cancer, is one of the most lethal human malignancies; owing to poor differentiation, it has a tendency to invade to the surrounding tissues, such as the trachea [2]. Different treatment methods are available depending on the type and the stage of the cancer: surgery, radioactive iodine treatment, thyroid hormone therapy, external beam radiation therapy, chemotherapy, and targeted therapy [3]. Two or more of these options can be combined to enhance therapeutic capability. However, the use of chemotherapy could lead to various side effects, which are dependent on the type and dose of drugs, and may cause cardiovascular disease through an accumulation of cardiac toxicity [4]. Therefore, as the cancer must still be treated, the use of natural sources of anticancer agents has emerged as a popular trend [5].
- Over the past decade, epidemiologic and preclinical evidence has indicated that polyphenolic phytochemicals present in many herbs possess chemopreventive properties against several cancer types. Thus, there has been an increase in interest in potential chemopreventive agents obtained from natural sources such as polyphenols, which may represent a new and affordable approach to limit the global cancer burden [6]. Many researchers have also investigated the combined application of anticancer drugs and phytochemicals in an attempt to overcome drug resistance and reduce the side effects of chemotherapy [78].
- Baicalein (5, 6, 7-trihydroxyflavone) is a bioactive flavone that was originally isolated from the roots of Scutellaria baicalensis Georgi (Labiatae). Traditionally, it has been used for the treatment of inflammatory diseases [9]. Various biological activities of baicalein have been established, including anticancer activity in pancreatic cancer [10], ovarian cancer [11], and gastric cancer [12]; induction of cancer cell apoptosis and cell cycle arrest; and inhibition of angiogenesis, metastasis, and inflammation [1314]. It was recently reported that the combined therapy of baicalein and taxol promoted mitochondrially mediated cell apoptosis in ovarian cancer cells [15]. Thus, baicalein is considered to possess great potential for the treatment and prevention of cancer without the induction of severe side effects.
- In the present study, we investigated the effects of these compounds on apoptosis and proliferation in ATC cells and examined the molecular mechanism of the anticancer effects through an analysis of the regulation of apoptotic and metastatic proteins and the extracellular signal-regulated kinase (ERK) pathway and Akt/mammalian target of rapamycin (mTOR) pathway.
INTRODUCTION
- Chemicals
- Baicalein, dimethyl sulfoxide (DMSO), docetaxel, anti-β-actin monoclonal antibody (mAb), and MTT (thiazolyl blue tetrazolium bromide) were purchased from Sigma Aldrich (St Louis, MO, USA). The anti-Bax, -Bcl-2, -caspase-3, -cleaved caspase-3, and -transforming growth factor β (TGF-β) mAbs were purchased from Santa Cruz Biotechnology (Santa Cruz, CA, USA). The anti-mTOR, -E-cadherin, -N-cadherin, -ERK, -phospho-ERK, -Akt, and -phospho-Akt mAbs were purchased from Cell Signaling Technologies (Boston, MA, USA). The anti-vascular endothelial growth factor (VEGF) mAb was purchased from Novus Biologicals (Littleton, CO, USA). The horseradish peroxidase (HRP)-conjugated goat-anti-rabbit-immunoglobulin G (IgG) and goat-anti-mouse-IgG secondary antibodies were purchased from Bio-Rad (Hercules, CA, USA). Radioimmunoprecipitation assay (RIPA) buffer was from Thermo Scientific Co. (Rockford, IL, USA), 1× Protease Inhibitor Cocktail Kits (tissue 2 perfect) was from Quartett (Berlin, Germany), and Xpert phosphatase inhibitor was from Gendepot (Barker, TX, USA). The nitrocellulose (NC) membrane and Clarity™ enhanced chemiluminescence (ECL) Western blotting substrate were purchased from Bio-Rad.
- Cell culture
- The human ATC cell line (DSMZ, Braunschweig, German), 8505c cells bearing the p53 gene mutation, was supplied by Professor W.B. Kim at the Department of Endocrinology, Asan Medical Center, University of Ulsan College of Medicine, Seoul, Korea, and cultured in RPMI-1640 medium (Corning, Manassas, VA, USA) supplemented with 10% FBS (Thermo Fisher Scientific, Waltham, MA USA) and 1% penicillin/streptomycin solution (10,000 U/mL, Thermo Fisher Scientific). The cells were maintained in a humid atmosphere with 5% CO2 at 37℃.
- Cell viability assay
- The cell viability was measured by the MTT assay. First, the cells were cultured onto 24-well plates to maintain the population (1×10⁶/mL/well), treated with baicalein (0, 10, 20, 50, and 100 µM) and/or docetaxel (10 nM) sequentially, and then incubated in a humid atmosphere with 5% CO2 at 37℃ for 24 or 48 hours. To determine the influence of baicalein on medium in the absence of cells, RPMI-1640 with or without 10% serum was added onto 24-well plates. After each incubation period, the medium was replaced with 50 µL of MTT solution (5 mg/mL) and incubated for 4 hours. The reaction was stopped by the removal of the MTT solution, after which DMSO was added into each well and incubated for 15 minutes at room temperature (RT) with shaking. The solubilized purple formazan crystals were transferred into 96-well plates (100 µL/well) and the colorimetric reaction was evaluated through the measurement of optical density by using a microplate reader (UVM, Cambridge, UK) at 570 nm. The cell viability was calculated relative a control sample of normal cells. To assess drug synergy [16], the combination index was calculated as the Bliss independence model described by the equation CI=(EA+EB−[EA×EB])/EAB; where CI is the combination index, EA is the effect of the drug A (baicalein), EB is the effect of drug B (docetaxel), and EAB is the combined effect of A and B.
- Hoechst staining
- The cells were cultured in glass dishes (SPL Life Science, Pocheon, Korea) and treated with baicalein (0, 20, 50, and 100 µM) and/or docetaxel (10 nM) for 24 hours. After incubation, the cells were washed three times with 1× phosphate buffered saline (PBS) and then incubated with Hoechst 33342 Solution (Thermo Fisher Scientific) for 15 minutes. The stained cells were washed again three times with 1× PBS three times and observed by using a fluorescent microscope (Leica, Wetzlar, Germany).
- Western blotting
- The cells were treated with baicalein (0, 20, 50, and 100 µM) and/or docetaxel (10 nM) for 24 hours, harvested, and lysed for total protein isolation by using RIPA Lysis and Extraction Buffer (Thermo Fisher Scientific) including 1× protease inhibitor cocktail tissue 2 perfect and Xpert phosphatase inhibitor (Gen-DEPOT, Barker, TX, USA). The cell debris was removed by centrifugation (Micro 171TR, Hanil Scientific Inc., Gimpo, Korea) at 16,000 ×g for 20 minutes at 4℃. The protein lysate was loaded onto 10% SDS polyacrylamide gels and separated by electrophoresis (Bio-Rad). The proteins were transferred onto 0.2 µm-NC membranes (Bio-Rad), which were blocked by incubation in 5% skim milk dissolved in 1× TBS-T (10 mM Tris base, 100 mM NaCl, and 0.05% Tween-20) for 1 hour at RT. Subsequently, the membranes were incubated with each of the primary monoclonal antibodies overnight at 4℃, washed five times with 1× TBS-T for 5 minutes, and then incubated with source-matched anti-rabbit or anti-mouse secondary mAbs in 5% skim milk for 2 hours at RT. The membranes were again washed five times with 1× TBS-T for 5 minutes, developed by the addition of ECL solution, and analyzed by Image Lab Software for PC version 5.2.1. (Bio-Rad Image Systems, Hercules, CA, USA). To evaluate the relative protein expression levels, the intensity of the bands of Bax, Bcl-2, caspase-3, cleaved caspase-3, VEGF, TGF-β1, E-cadherin, N-cadherin, and mTOR were compared with those of actin. The phosphorylated forms of ERK1/2 (Thr202/Tyr204) and Akt (Ser473) were quantified in relation to their total forms. The band intensity was quantified using Image J version 1.47 (NIH, Bethesda, MD, USA).
- Statistical analysis
- All experimental data were expressed as the mean±standard deviation (SD) computed by GraphPad Prism 5.0 (GraphPad Software, La Jolla, CA, USA). Statistical analyses were computed by using GraphPad Prism 5.0 (GraphPad Software). The comparison between each group was conducted by Student t test and one-way analysis of variance, with P<0.05 considered statistically significant.
METHODS
- Combined effects of baicalein and docetaxel on cell viability
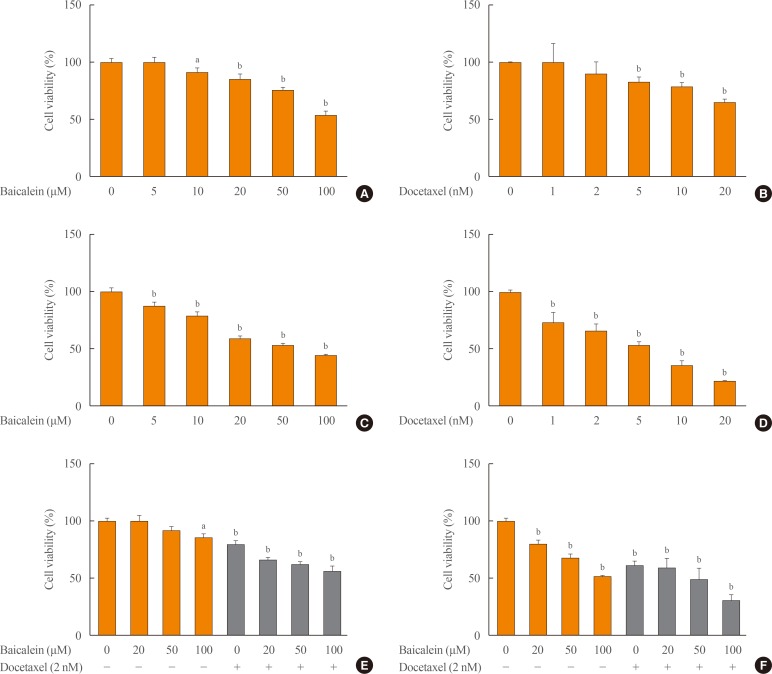
- To determine the combined effects and efficacious concentrations, different concentrations of baicalein (10, 20, 50, 100, and 200 µM) and docetaxel (2, 5, 10, 20, and 50 nM) were applied individually or in combination to 8505c cells for 24 and 48 hours. For the individual treatments, we found significant concentration-dependent cytotoxicity after 24 hours (Fig. 1A, B) and 48 hours (Fig. 1C, D) for treatment with baicalein (Fig. 1A, C) and docetaxel (5, 10, 20, and 50 nM) (Fig. 1B, D). The combined treatment with baicalein (20, 50, and 100 µM) and docetaxel (10 nM) decreased proliferation to a much greater extent compared with normal cells or docetaxel alone after 24 hours (Fig. 1E) and 48 hours (Fig. 1F). The potential reduction of MTT by baicalein in culture medium with 10% FBS or without was shown to not affect the measured MTT reduction (data not shown). Based on these results, we used baicalein at 20, 50, and 100 µM and/or docetaxel at 10 nM to investigate the combined effects of the two drugs. Additionally, the combination index for drug synergy showed a significant difference with the combination of baicalein (50 and 100 µM) and docetaxel (2 nM) for 48 hours by Bliss independence calculation, but not for 24 hours (Supplemental Fig. S1).
- Combined effects of baicalein and docetaxel on apoptosis
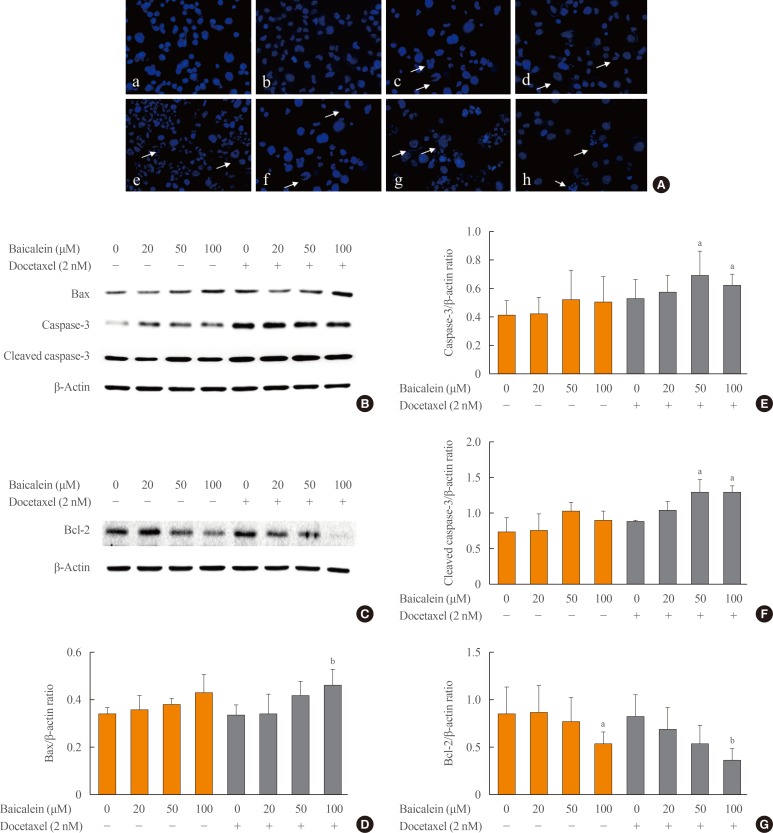
- To evaluate the combined effects of baicalein and docetaxel on the apoptosis, 8505c cells were treated with baicalein (20, 50, and 100 µM) and docetaxel (10 nM) individually or in combination for 24 hours and then stained with Hoechst. Fluorescence microscopy analysis indicated that the treatment with baicalein increased nuclear fragmentation and decreased cell viability in a concentration-dependent manner (Fig. 2Aa–d); however, the combined treatment of baicalein and docetaxel appeared to increase apoptosis more than baicalein or docetaxel alone (Fig. 2Ae–h).
- We therefore evaluated the expression of the pro-apoptotic proteins Bax, caspase-3, and cleaved caspase-3 and the antiapoptotic protein Bcl-2 in 8505c cells by Western blotting analysis. The combined treatment with baicalein at 50 and 100 µM and docetaxel at 10 nM significantly increased the expression of Bax (Fig. 2B, D), caspase-3 (Fig. 2B, E), and cleaved caspase-3 (Fig. 2B, F) compared with normal cells or treatment with docetaxel alone. Additionally, the combined treatment with baicalein at 100 µM significantly inhibited Bcl-2 expression compared with normal cells or docetaxel alone (Fig. 2C, G). These results indicate that baicalein enhances docetaxel-induced apoptosis in 8505c cells.
- Combined effects of baicalein and docetaxel on the expression of metastasis-related proteins
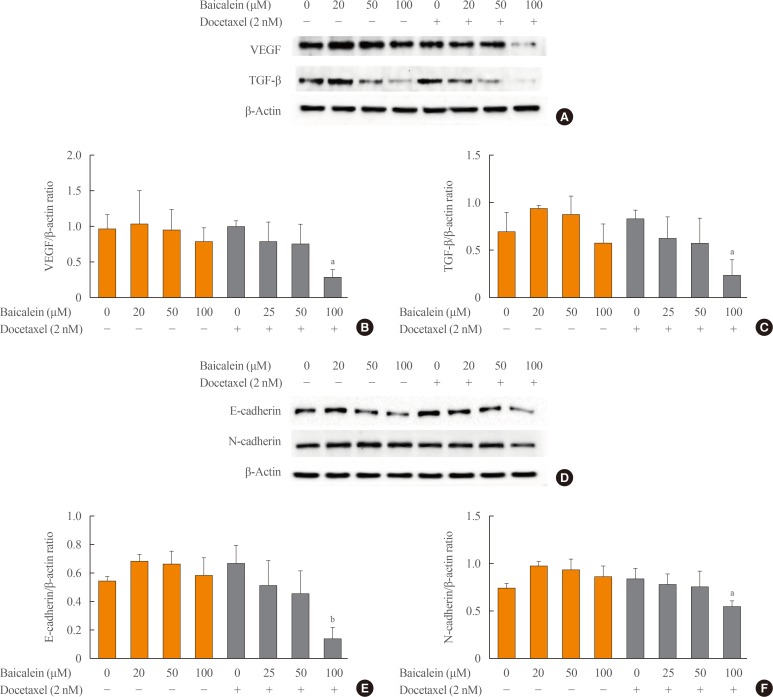
- To evaluate the combined effects of combined treatment with baicalein and docetaxel on metastasis in ATC cells, 8505c cells were treated with baicalein (10, 20, and 50 µM) and docetaxel (10 nM) individually or in combination for 24 hours. The expression of angiogenic proteins, such as VEGF and TGF-β, and invasion proteins, such as E-cadherin and N-cadherin, was determined by Western blotting analysis. As shown in Fig. 3, the combined treatment with baicalein at 100 µM and docetaxel significantly decreased the expression of VEGF (Fig. 3A, B), TGF-β (Fig. 3A, C), E-cadherin (Fig. 3D, E), and N-cadherin (Fig. 3D, F) compared with normal cells or treatment with docetaxel alone. These results indicate that the combined treatment with baicalein and docetaxel has an inhibitory effect on metastasis through downregulation of angiogenesis-regulating proteins in 8505c cells.
- Combined effects of baicalein and docetaxel on apoptosis/metastasis signaling
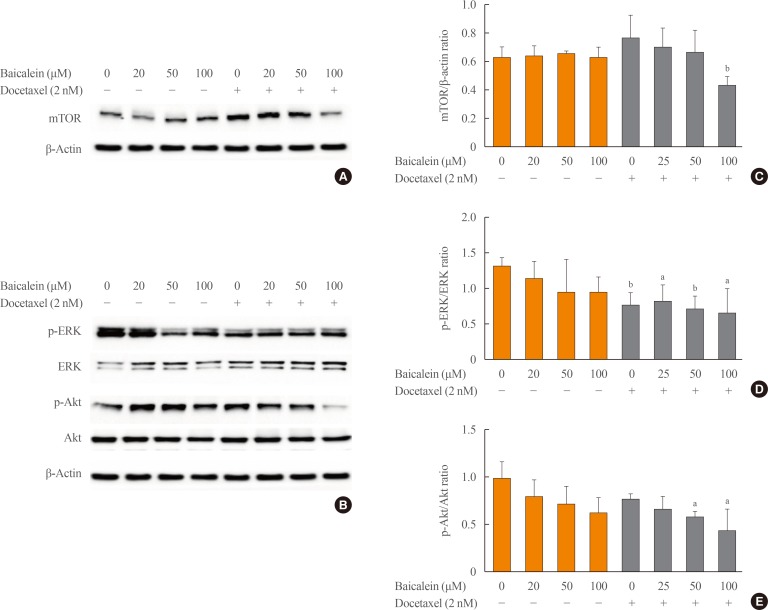
- To clarify the mechanism of action of the combined effects of baicalein and docetaxel on apoptosis and metastasis in ATC, 8505c cells were treated with baicalein (20, 50, and 100 µM) and docetaxel (10 nM) individually or in combination for 24 hours. The expression of mTOR and the phosphorylation of ERK and Akt were analyzed by Western blotting. The expression of mTOR protein was significantly inhibited by the combined treatment with baicalein at 100 µM and docetaxel compared with control cells or docetaxel treatment alone (Fig. 4A, C). The phosphorylation of ERK (Fig. 4B, D) and Akt (Fig. 4B, E) was significantly decreased by the combination treatment with baicalein at 100 µM and docetaxel compared with control cells or docetaxel treatment alone. These results indicate that baicalein enhanced the induction of docetaxel-induced apoptosis and metastasis in 8505c cells through inhibition of the ERK pathway and Akt/mTOR pathway.
RESULTS
- The best management practices for anaplastic thyroid cancer include palliative surgeries to reduce the disease burden, followed by either radiotherapy or chemotherapy (or both) to help to prevent tumor progression and further distant metastases [3]. It has been reported that combination chemotherapy of ATC with bleomycin, doxorubicin, and cisplatin resulted in a response rate of 40% in advanced thyroid cancer, providing considerable palliative effects, and that the use of taxanes resulted in an overall response rate of 53% in patients with advanced cancer who were treated with a 96-hour infusion of paclitaxel [17]. Systemic chemotherapy is best employed in a clinical trial; in addition, radiotherapy may help improve survival, depending on the extent of disease [3].
- Docetaxel (Taxotere) is an antineoplastic or a cytotoxic chemotherapy drug used to treat different types of cancers, including breast, lung, stomach, head and neck, and metastatic prostate cancer. It is classified as a plant alkaloid, a taxane, and an antimicrotubule agent. Its use results in side effects, such as low white blood cell count, red blood cell count, and platelet count; vomiting; muscle, bone, and joint pain; and peripheral neuropathy [17]. Although docetaxel is also used to treat ATC, there is no standard chemotherapy regimen; the treatment is largely limited to palliative effects. Accordingly, many researchers are seeking natural sources that replace synthetic drugs.
- Flavonoids are polyphenolic compounds commonly found as constituents of flowering plants, particularly of food or medicinal plants [18]. They are now accepted as chemotherapeutic and dietary chemoprevention agents with various anticancer effects, such as cell growth and kinase activity inhibition, apoptosis induction, suppression of matrix metalloproteinase release, and reduction of tumor invasive behavior [1819]. These natural compounds are thought to have many advantages, such as better accessibility and affordability, in addition to lower toxicity in comparison with classical chemotherapy agents. Baicalein, a flavone, is one of the flavonoids that has already been investigated as an anticancer agent; it has been established to exert various biological activities in many different cancer types, such as bladder, breast, and ovarian cancer [15]. In addition, many preclinical studies have proved that baicalein possesses tremendous potential as an antitumor drug owing to its targeting of multiple molecular mechanisms and signaling pathways. In this study, we first investigated the effects of the combined treatment of baicalein and docetaxel in ATC cells. ATC lines include not only 8505c cells but also T238, HTh74, THJ-16T, Cal62, C643, SW1736, K1, /GLAG-66, BCPAP, MBA-T41, and TPC-1 cells [20]. There is a limit to studies using a single cell model to draw general conclusions; therefore, further study is necessary in other ATC lines.
- Recent studies have shown that MTT can be reduced in the absence of live cells, and some botanical extracts with iodoacetic acid alkylate free thiol groups, which inhibits their ability to reduce MTT [21]. Additionally, the similar structure of flavonoids such as luteolin, quercetin, and rutin, the nutrient concentration in the culture medium, and serum components directly affect MTT reduction in the absence of cells [22]. In our study, we did not find observed reduction of MTT by baicalein treatment in absence of 8505c cells, with 10% serum or without.
- Induction of cancer cell apoptosis is one of the main chemotherapeutic approaches. Apoptosis is the active, programmed form of cell death. Accumulated evidence suggests that the response of cancer cells to chemotherapy is not confined to apoptosis, but also involves other modes of cell death [23]. However, it is important that baicalein induces ATC cells to die spontaneously via apoptosis, because apoptosis is the “self-destruct” program of a cell, and thus has minimal off-target effects [24]. In general, apoptosis occurs through three pathways: the granzyme, extrinsic, and intrinsic pathways. All of these pathways converge to caspase-3 and the formation of the apoptosome [25]. The intrinsic pathway is the mitochondrial apoptotic pathway. As stimuli activate the intrinsic pathway, the mitochondrial permeability transition pores open and pro-apoptotic proteins, such as poly (ADP-ribose) polymerase (PARP) and cytochrome C, are released, which causes the loss of mitochondrial membrane potential and activates multiple caspases, such as caspase-3 [25]. The Bcl-2 family regulates the mitochondrial permeability transition; the mitochondrial pores can be pro-apoptotic or anti-apoptotic depending on the activation ratio of proteins of the pro-apoptotic family, such as Bax, and those of the anti-apoptotic family, such as Bcl-2 [26]. Previous studies have demonstrated that cell growth and proliferation were inhibited by docetaxel and baicalein, which induce apoptosis through regulation of Bax and Bcl-2 expression and induce mitochondrial dysfunction, caspase activation, and PARP cleavage in cancer cells [27]. In our study, the combined treatment with baicalein and docetaxel decreased the viability of 8505c cells to a much greater extent compared with individual treatment with baicalein or docetaxel, which resulted in induction of apoptosis through an increase in the expression of the apoptotic proteins, Bax and caspase-3, and decreased expression of the anti-apoptotic protein Bcl-2. These results indicate that baicalein enhanced docetaxel-mediated apoptosis in ATC cells through regulation of Bax and Bcl-2 expression. Recent studies have shown that the expression of apoptotic proteins such as Bax, capsase-3, cytochrome c, and PARP varied for different docetaxel concentrations in different cell types and over culture time. In our previous study, treatment with docetaxel at 1, 5, 10, 25, and 50 nM in ATC cells such as CAL-62, FRO, and KTC2 cells significantly decreased the cell viability in a concentration-dependent manner. Co-treatment with docetaxel (5 nM) and curcumin (10 µM) resulted in 50% growth inhibition with suppression of cleaved caspase-3 and -9 expression [28]. It was also reported that docetaxel at a high concentration (10 µM) inhibits the expression of Bax, cleaved caspase-3 and -8, and PARP in ovarian somatic cells, but the expression did not change at low (0.1 µM) and moderate (1 µM) concentrations [14]. Although treatment with high-concentration docetaxel is known to enhance the anticancer activity, in the present study, we investigated the simultaneous treatment of 8505c cells with a low concentration of docetaxel (2 nM) and baicalein. We found that the treatment with docetaxel at 5, 10, 20, and 50 nM significantly decreased the cell viability for 48 hours in a concentration-dependent manner (Fig. 1D), but the cell numbers were insufficient for investigation of anticancer activity by combined treatment with docetaxel and baicalein.
- The development and progression of ATC are thought to involve a complex and apparently redundant interplay of hormones and growth factors, such as epithelial growth factor (EGF)-like ligands and TGF-β1, which regulate thyroid cell proliferation and differentiation [29]. It was also demonstrated that TGF-β1 induced cancer cell proliferation and formation of an invasive phenotype, characterized by the epithelial-to-mesenchymal transition (EMT) [30], and promoted metastasis through regulation of the composition of the extracellular matrix, proteolysis, and inflammatory responses [31]. Therefore, TGF-β1 may be an effective target for the inhibition of primary tumor proliferation in ATC cells [32]. Angiogenesis is essential for tumor growth and metastasis. VEGF is the major cytokine related to tumor angiogenesis. It is unique among angiogenic factors, as it is mitogenic to vascular endothelial cells [33]. VEGF produced from neoplastic cells is essential for tumor vasculogenesis [34], lymphocyte mitogenesis, monocyte recruitment, and dendritic cell suppression [3334]. Most tumor types, including ATC, overexpress VEGF, which correlates directly with regions of neoangiogenesis; thereby, suggesting that the inhibition of VEGF may offer a promising new approach for the treatment of ATC. In our study, the combined treatment with baicalein and docetaxel highly inhibited the expression of the angiogenic and invasive proteins VEGF and TGF-β in 8505c cells. These results indicate that baicalein acts synergistically with docetaxel to inhibit metastasis in ATC through downregulation of the expression of VEGF and TGF-β. Some studies have demonstrated that baicalein inhibits metastasis through suppression of the TGF-β/Smad2 signaling pathway in gastric cancer [35], the caveolin-1/Akt/mTOR pathway in prostate cancer [13], and the p38 mitogen activated protein kinase (MAPK)/nuclear factor-κB pathway in ovarian cancer [15].
- E-cadherin, a single-span transmembrane glycoprotein, is expressed by most epithelial tissues and is prominently associated with tumor invasiveness, metastatic dissemination, and poor patient prognosis [36]. It is also correlated with an invasive and undifferentiated phenotype in epithelium-derived cancer cells [37]. N-cadherin, another adhesion molecule, is expressed in mesenchymal cells and also associated with an increased invasive potential in cancer [36]. Previous studies have demonstrated abnormal expression of N-cadherin in some cancer cells, which promoted cellular motility and invasion. During EMT, E-cadherin is downregulated, whereas N-cadherin is upregulated. The loss of E-cadherin expression and the gain of N-cadherin expression (the “cadherin switch”) has functional significance in cancer progression [36]. In our study of 8505c cells, the expression of E-cadherin was inhibited by the treatment of baicalein alone or the combination of baicalein and docetaxel, but expression of N-cadherin was only inhibited in the combination treatment. This indicates that baicalein exerts an inhibitory effect of expression of E-cadherin, but not N-cadherin, in 8505c cells, which requires further study.
- To evaluate the combined effects of baicalein with docetaxel in signaling pathways related to apoptotic and metastatic transcription, we investigated the effects of the baicalein and docetaxel combination on the activation of the MAPK pathway and the phosphoinositide 3-kinase (PI3K)/Akt/mTOR pathway. The MAPK pathway is mediated by ERK, c-Jun N-terminal kinase (JNK), and p38 protein kinases, which regulate cell fate through apoptosis [38]. Recent studies demonstrated that the activation of MAPKs, particularly ERK, is an essential component in the control of cancer cell division; therefore, inhibition of the ERK signaling pathway is thought to induce cell apoptosis and reduce metastasis in various types of cancer [1538]. The PI3K/Akt pathway, also recognized as a functional intracellular signaling pathway involved in both normal cell physiology and cancer, controls major cellular processes such as cell growth, proliferation, and survival, cell metabolism, and autophagy [39]. In addition, the activation of the mTOR pathway results in a protumorigenic phenotype with effects on cell proliferation, cell cycle progression, inhibition of apoptosis, and angiogenesis, in addition to metabolic effects, such as protein synthesis and glucose uptake, in response to the increased requirements for energy and structural elements of the proliferating malignant transformed cells [39]. In carcinogenesis, the activation of oncogenic pathways, such as the MAPK and PI3K/Akt/mTOR signaling pathways, induces a protumorigenic phenotype through effects on cell proliferation, cell cycle progression, and the inhibition of apoptosis and angiogenesis in malignant transformed cells [39]. Therefore, pharmacological agents have been developed and are currently available to specifically target and inhibit these signaling pathways, alone or in combination, to provide more effective treatments for therapy-resistant thyroid cancer through the inhibition of tumor progression and the induction of re-differentiation [39]. In our study, the activation of ERK and Akt and the expression of mTOR were inhibited by the combined treatment of baicalein and docetaxel in 8505c cells. This result indicates that the combined treatment of baicalein and docetaxel functioned to inhibit cancer cell growth, proliferation, survival, and invasion through the inhibition of the ERK pathway and Akt/mTOR pathway. mTOR is activated through the PI3K/Akt signaling pathways via phosphorylation of specific residues. To investigate the effect of combined treatment with docetaxel and baicalein on the mTOR pathway, the phosphorylation levels of mTOR (p-mTOR) will be analyzed.
- It has been demonstrated that baicalein inhibits the migration and invasion of cancer cells and induces apoptosis through inhibition of the ERK pathway and the PI3K/Akt/mTOR pathway [35], and that combination therapy with taxol promoted mitochondrially mediated apoptosis in ovarian cancer cells through inhibition of the Akt/β-catenin signaling pathway [15]. Recently, the combinatorial effects of natural compounds, such as curcumin, and traditional chemotherapy have been studied in the modulation of apoptosis and metastasis in prostate cancer [7], including co-delivery techniques with nanoparticles [40] and pharmacokinetic studies [32]. Additionally, consistent with the frequent aberrant activation of the MAPK and PI3K pathways in thyroid cancer, it was reported that ATC lines such as 8505C, T238, K1/GLAG-66, and BCPAP express mutant BRAF (BRAFV600E), an activator of the MAPK pathway [20]. BRAF plays an important role in regulating survival, proliferation, and differentiation in response to various stimuli, and BRAFV600E frequently occurs in thyroid cancer [41]. It was reported that PLX4032, a BRAFV600E inhibitor, selectively inhibits proliferation, migration, and invasion of ATC cells harboring mutant BRAFV600E [41]. Therefore, it is considered that inhibition of BRAFV600E can augment anticancer drug-induced apoptosis in ATC cells harboring BRAFV600E. Our future studies will evaluate whether the combined treatment with baicalein and docetaxel can be used for overcoming resistance to BRAFV600E.
- Recently, doxorubicin (Adriamycin) was approved by the U.S. Food and Drug Administration for use as a chemotherapy drug and has demonstrated significant activity in cancers [42]. In addition, effects of combination therapy with docetaxel in metastatic breast cancer and protective effects of berberine, a botanical alkaloid, against docetaxel-induced cardiotoxicity have been reported [43]. Therefore, it will be necessary to investigate the combined effects of doxorubicin and baicalein in ATC cells to provide new ideas for chemotherapy.
- In conclusion, the combined treatment with baicalein and docetaxel in 8505c cells highly induced apoptosis through activation of the expression of the apoptotic proteins Bax and caspase-3 and inhibited metastasis through downregulation of the angiogenic proteins VEGF, TGF-β1, E-cadherin, and N-cadherin compared with baicalein or docetaxel treatment alone. The anticancer effects of the combined treatment with baicalein and docetaxel are based on the downregulation of the ERK pathway and Akt/mTOR pathway.
DISCUSSION
-
Acknowledgements
- This research was supported by the research fund of Busan and Ulsan and the Kyungnam Branch of the Korean Endocrine Society (2017).
ACKNOWLEDGMENTS
-
CONFLICTS OF INTEREST: No potential conflict of interest relevant to this article was reported.
-
AUTHOR CONTRIBUTIONS: Conception or design: E.S.K. Acquisition, analysis, or interpretation of data: C.H.P., S.E.H., I.S.N.G., Y.I.K., E.S.K. Drafting the work or revising: C.H.P, S.E.H. Final approval of the manuscript: E.S.K.
Article information
SUPPLEMENTARY MATERIAL
Supplemental Fig. S1
- 1. Gill KS, Tassone P, Hamilton J, Hjelm N, Luginbuhl A, Cognetti D, et al. Thyroid cancer metabolism: a review. J Thyroid Disord Ther 2016;5:pii200.Article
- 2. Keutgen XM, Sadowski SM, Kebebew E. Management of anaplastic thyroid cancer. Gland Surg 2015;4:44–51. PubMedPMC
- 3. Lim SM, Shin SJ, Chung WY, Park CS, Nam KH, Kang SW, et al. Treatment outcome of patients with anaplastic thyroid cancer: a single center experience. Yonsei Med J 2012;53:352–357. ArticlePubMedPMC
- 4. Matuszczyk A, Petersenn S, Voigt W, Kegel T, Dralle H, Schmoll HJ, et al. Chemotherapy with paclitaxel and gemcitabine in progressive medullary and thyroid carcinoma of the follicular epithelium. Horm Metab Res 2010;42:61–64. ArticlePubMedPDF
- 5. Bishayee A, Sethi G. Bioactive natural products in cancer prevention and therapy: progress and promise. Semin Cancer Biol 2016;40-41:1–3. ArticlePubMed
- 6. Spagnuolo C, Russo GL, Orhan IE, Habtemariam S, Daglia M, Sureda A, et al. Genistein and cancer: current status, challenges, and future directions. Adv Nutr 2015;6:408–419. ArticlePubMedPMCPDF
- 7. Banerjee S, Singh SK, Chowdhury I, Lillard JW Jr, Singh R. Combinatorial effect of curcumin with docetaxel modulates apoptotic and cell survival molecules in prostate cancer. Front Biosci (Elite Ed) 2017;9:235–245. ArticlePubMedPMC
- 8. Mahammedi H, Planchat E, Pouget M, Durando X, Cure H, Guy L, et al. The new combination docetaxel, prednisone and curcumin in patients with castration-resistant prostate cancer: a pilot phase II study. Oncology 2016;90:69–78. ArticlePubMed
- 9. Makino T, Hishida A, Goda Y, Mizukami H. Comparison of the major flavonoid content of S. baicalensis, S. lateriflora, and their commercial products. J Nat Med 2008;62:294–299. ArticlePubMedPDF
- 10. Takahashi H, Chen MC, Pham H, Angst E, King JC, Park J, et al. Baicalein, a component of Scutellaria baicalensis, induces apoptosis by Mcl-1 down-regulation in human pancreatic cancer cells. Biochim Biophys Acta 2011;1813:1465–1474. ArticlePubMedPMC
- 11. Yan H, Xin S, Wang H, Ma J, Zhang H, Wei H. Baicalein inhibits MMP-2 expression in human ovarian cancer cells by suppressing the p38 MAPK-dependent NF-κB signaling pathway. Anticancer Drugs 2015;26:649–656. ArticlePubMed
- 12. Mu J, Liu T, Jiang L, Wu X, Cao Y, Li M, et al. The traditional Chinese medicine baicalein potently inhibits gastric cancer cells. J Cancer 2016;7:453–461. ArticlePubMedPMC
- 13. Guo Z, Hu X, Xing Z, Xing R, Lv R, Cheng X, et al. Baicalein inhibits prostate cancer cell growth and metastasis via the caveolin-1/AKT/mTOR pathway. Mol Cell Biochem 2015;406:111–119. ArticlePubMedPMCPDF
- 14. Liu H, Dong Y, Gao Y, Du Z, Wang Y, Cheng P, et al. The fascinating effects of baicalein on cancer: a review. Int J Mol Sci 2016;17:E1681. Article
- 15. Pan Q, Xue M, Xiao SS, Wan YJ, Xu DB. A combination therapy with baicalein and taxol promotes mitochondria-mediated cell apoptosis: involving in Akt/β-catenin signaling pathway. DNA Cell Biol 2016;35:646–656. ArticlePubMed
- 16. Foucquier J, Guedj M. Analysis of drug combinations: current methodological landscape. Pharmacol Res Perspect 2015;3:e00149. ArticlePubMedPMC
- 17. Ain KB. Management of undifferentiated thyroid cancer. Baillieres Best Pract Res Clin Endocrinol Metab 2000;14:615–629. ArticlePubMed
- 18. Romano B, Pagano E, Montanaro V, Fortunato AL, Milic N, Borrelli F. Novel insights into the pharmacology of flavonoids. Phytother Res 2013;27:1588–1596. ArticlePubMed
- 19. Yao H, Xu W, Shi X, Zhang Z. Dietary flavonoids as cancer prevention agents. J Environ Sci Health C Environ Carcinog Ecotoxicol Rev 2011;29:1–31. ArticlePubMed
- 20. Morrison JA, Pike LA, Lund G, Zhou Q, Kessler BE, Bauerle KT, et al. Characterization of thyroid cancer cell lines in murine orthotopic and intracardiac metastasis models. Horm Cancer 2015;6:87–99. ArticlePubMedPMCPDF
- 21. Shoemaker M, Cohen I, Campbell M. Reduction of MTT by aqueous herbal extracts in the absence of cells. J Ethnopharmacol 2004;93:381–384. ArticlePubMed
- 22. Talorete TP, Bouaziz M, Sayadi S, Isoda H. Influence of medium type and serum on MTT reduction by flavonoids in the absence of cells. Cytotechnology 2006;52:189–198. ArticlePubMed
- 23. Brown JM, Attardi LD. The role of apoptosis in cancer development and treatment response. Nat Rev Cancer 2005;5:231–237. ArticlePubMedPDF
- 24. Zhou QM, Wang S, Zhang H, Lu YY, Wang XF, Motoo Y, et al. The combination of baicalin and baicalein enhances apoptosis via the ERK/p38 MAPK pathway in human breast cancer cells. Acta Pharmacol Sin 2009;30:1648–1658. ArticlePubMedPMCPDF
- 25. Elmore S. Apoptosis: a review of programmed cell death. Toxicol Pathol 2007;35:495–516. ArticlePubMedPMC
- 26. Bruncko M, Oost TK, Belli BA, Ding H, Joseph MK, Kunzer A, et al. Studies leading to potent, dual inhibitors of Bcl-2 and Bcl-xL. J Med Chem 2007;50:641–662. ArticlePubMed
- 27. Kim SJ, Kim HJ, Kim HR, Lee SH, Cho SD, Choi CS, et al. Antitumor actions of baicalein and wogonin in HT-29 human colorectal cancer cells. Mol Med Rep 2012;6:1443–1449. ArticlePubMed
- 28. Hong JM, Park CS, Nam-Goong IS, Kim YS, Lee JC, Han MW, et al. Curcumin enhances docetaxel-induced apoptosis of 8505C anaplastic thyroid carcinoma cells. Endocrinol Metab (Seoul) 2014;29:54–61. ArticlePubMedPMC
- 29. Mincione G, Tarantelli C, Vianale G, Di Marcantonio MC, Cotellese R, Francomano F, et al. Mutual regulation of TGF-β1, TβRII and ErbB receptors expression in human thyroid carcinomas. Exp Cell Res 2014;327:24–36. ArticlePubMed
- 30. Massague J, Blain SW, Lo RS. TGFbeta signaling in growth control, cancer, and heritable disorders. Cell 2000;103:295–309. ArticlePubMed
- 31. Sinpitaksakul SN, Pimkhaokham A, Sanchavanakit N, Pavasant P. TGF-beta1 induced MMP-9 expression in HNSCC cell lines via Smad/MLCK pathway. Biochem Biophys Res Commun 2008;371:713–718. ArticlePubMed
- 32. Sun W, Xu Y, Zhao C, Hao F, Chen D, Guan J, et al. Targeting TGF-β1 suppresses survival of and invasion by anaplastic thyroid carcinoma cells. Am J Transl Res 2017;9:1418–1425. PubMedPMC
- 33. Gulubova M, Ivanova K, Ananiev J, Gerenova J, Zdraveski A, Stoyanov H, et al. VEGF expression, microvessel density and dendritic cell decrease in thyroid cancer. Biotechnol Biotechnol Equip 2014;28:508–517. ArticlePubMedPMC
- 34. Robinson CJ, Stringer SE. The splice variants of vascular endothelial growth factor (VEGF) and their receptors. J Cell Sci 2001;114(Pt 5):853–865. ArticlePubMedPDF
- 35. Chen F, Zhuang M, Peng J, Wang X, Huang T, Li S, et al. Baicalein inhibits migration and invasion of gastric cancer cells through suppression of the TGF-β signaling pathway. Mol Med Rep 2014;10:1999–2003. ArticlePubMed
- 36. Araki K, Shimura T, Suzuki H, Tsutsumi S, Wada W, Yajima T, et al. E/N-cadherin switch mediates cancer progression via TGF-β-induced epithelial-to-mesenchymal transition in extrahepatic cholangiocarcinoma. Br J Cancer 2011;105:1885–1893. ArticlePubMedPMCPDF
- 37. Onder TT, Gupta PB, Mani SA, Yang J, Lander ES, Weinberg RA. Loss of E-cadherin promotes metastasis via multiple downstream transcriptional pathways. Cancer Res 2008;68:3645–3654. ArticlePubMed
- 38. Johnson GL, Lapadat R. Mitogen-activated protein kinase pathways mediated by ERK, JNK, and p38 protein kinases. Science 2002;298:1911–1912. ArticlePubMed
- 39. Petrulea MS, Plantinga TS, Smit JW, Georgescu CE, Netea-Maier RT. PI3K/Akt/mTOR: a promising therapeutic target for non-medullary thyroid carcinoma. Cancer Treat Rev 2015;41:707–713. ArticlePubMed
- 40. Wang W, Xi M, Duan X, Wang Y, Kong F. Delivery of baicalein and paclitaxel using self-assembled nanoparticles: synergistic antitumor effect in vitro and in vivo. Int J Nanomedicine 2015;10:3737–3750. PubMedPMC
- 41. Kim SH, Shin HY, Kim YS, Kang JG, Kim CS, Ihm SH, et al. Tunicamycin induces paraptosis potentiated by inhibition of BRAFV600E in FRO anaplastic thyroid carcinoma cells. Anticancer Res 2014;34:4857–4868. PubMed
- 42. Haddad RI, Lydiatt WM, Ball DW, Busaidy NL, Byrd D, Callender G, et al. Anaplastic thyroid carcinoma, version 2.2015. J Natl Compr Canc Netw 2015;13:1140–1150. ArticlePubMedPMC
- 43. Hao G, Yu Y, Gu B, Xing Y, Xue M. Protective effects of berberine against doxorubicin-induced cardiotoxicity in rats by inhibiting metabolism of doxorubicin. Xenobiotica 2015;45:1024–1029. ArticlePubMed
References
Effects of the combined treatment with baicalein and docetaxel on the viability in 8505c cells. The cells were treated with baicalein (A, C) and docetaxel (B, D) individually or in combination (E, F) for 24 hours (A, B, E) and 48 hours (C, D, F). The cell viability was determined by MTT (thiazolyl blue tetrazolium bromide) assay. The data are presented as the mean±SEM of three independent experiments. aP<0.05; bP<0.1 vs. normal cells.
Effects of the combined treatment with baicalein and docetaxel on apoptosis in 8505c cells. The cells were treated with baicalein and docetaxel individually or in combination for 24 hours. (A) Nuclear fragmentation was determined by the observation of Hoechst staining using a fluorescence microscope (×400). The arrows indicate DNA fragmentation in apoptotic cells. Non-treated cells (a); baicalein-treated cells at 20 µM (b), 50 µM (c), and 100 µM (d); docetaxel-treated cells at 10 nM (e); cells treated the combination of docetaxel at 10 nM and baicalein at 20 µM (f), 50 µM (g), and 100 µM (h). The expression of Bax, caspase-3, cleaved caspase-3 (B), and Bcl-2 (C) proteins was measured by Western blotting analysis. The histogram (D, E, F, G) is presented as the mean±SEM of the band density for three independent experiments compared with β-actin expression. aP<0.05; bP<0.01 vs. baicalein alone and docetaxel combined treatment.
Effects of the combined treatment with baicalein and docetaxel on metastasis in 8505c cells. The cells were treated with baicalein and docetaxel individually or in combination for 24 hours. The expression of vascular endothelial growth factor (VEGF), transforming growth factor β1 (TGF-β1) (A), E-cadherin, and N-cadherin (D) proteins were measured by Western blotting analysis. The histogram (B, C, E, F) was presented as the mean±SEM of the band density for three independent experiments compared with β-actin expression. aP<0.01; bP<0.001 vs. baicalein alone and docetaxel combined treatment.
Effects of the combined treatment with baicalein and docetaxel on the signaling pathway in 8505c cells. The cells were treated with baicalein and docetaxel individually or in combination for 24 hours. The expression of mammalian target of rapamycin (mTOR) (A) and the phosphorylation of extracellular signal-regulated kinase (ERK) and Akt (B) were determined by Western blotting analysis. (C, D, E) Each histogram was presented as the mean±SEM of the band density for three independent experiments compared with β-actin expression (for mTOR) or the total expression (for ERK or Akt). aP<0.05; bP<0.01 vs. baicalein alone and docetaxel combined treatment.

Figure & Data
References
Citations
- Modulation of hypoxia-inducible factor-1 signaling pathways in cancer angiogenesis, invasion, and metastasis by natural compounds: a comprehensive and critical review
Sajad Fakhri, Seyed Zachariah Moradi, Farahnaz Faraji, Leila Kooshki, Kassidy Webber, Anupam Bishayee
Cancer and Metastasis Reviews.2024; 43(1): 501. CrossRef - Baicalein Alleviates Arsenic-induced Oxidative Stress through
Activation of the Keap1/Nrf2 Signalling Pathway in Normal Human
Liver Cells
Qi Wang, Aihua Zhang
Current Molecular Medicine.2024; 24(3): 355. CrossRef - Natural products reverse cancer multidrug resistance
Jia-Yu Zou, Qi-Lei Chen, Xiao-Ci Luo, Davaadagva Damdinjav, Usama Ramadan Abdelmohsen, Hong-Yan Li, Tungalag Battulga, Hu-Biao Chen, Yu-Qing Wang, Jian-Ye Zhang
Frontiers in Pharmacology.2024;[Epub] CrossRef - Identification of novel characteristic biomarkers and immune infiltration profile for the anaplastic thyroid cancer via machine learning algorithms
C. Li, X. Dong, Q. Yuan, G. Xu, Z. Di, Y. Yang, J. Hou, L. Zheng, W. Chen, G. Wu
Journal of Endocrinological Investigation.2023; 46(8): 1633. CrossRef - Promising Role of the Scutellaria baicalensis Root Hydroxyflavone–Baicalein in the Prevention and Treatment of Human Diseases
Marcelina Chmiel, Monika Stompor-Gorący
International Journal of Molecular Sciences.2023; 24(5): 4732. CrossRef - STEAP1 Knockdown Decreases the Sensitivity of Prostate Cancer Cells to Paclitaxel, Docetaxel and Cabazitaxel
Sandra M. Rocha, Daniel Nascimento, Rafaella S. Coelho, Ana Margarida Cardoso, Luís A. Passarinha, Sílvia Socorro, Cláudio J. Maia
International Journal of Molecular Sciences.2023; 24(7): 6643. CrossRef - Baicalein as Promising Anticancer Agent: A Comprehensive Analysis on Molecular Mechanisms and Therapeutic Perspectives
A K M Helal Morshed, Supti Paul, Arafat Hossain, Tuli Basak, Md. Sanower Hossain, Md. Mehedi Hasan, Md. Al Hasibuzzaman, Tanjim Ishraq Rahaman, Md. Abdur Rashid Mia, Pollob Shing, Md Sohel, Shabana Bibi, Dipta Dey, Partha Biswas, Md. Nazmul Hasan, Long Ch
Cancers.2023; 15(7): 2128. CrossRef - The role of flavonoids in the regulation of epithelial‐mesenchymal transition in cancer: A review on targeting signaling pathways and metastasis
Carina Proença, Marisa Freitas, Daniela Ribeiro, Ana T. Rufino, Eduarda Fernandes, José Miguel P. Ferreira de Oliveira
Medicinal Research Reviews.2023; 43(6): 1878. CrossRef - Developing a ternary conductive hydrogel of polyacrylamide, polyaniline, and carbon nanotube: A potential chemiresistive gas sensor
Mohsen Peykari, Saeed Pourmahdian
Journal of Composite Materials.2023; 57(27): 4291. CrossRef - Inhibiting MEK1 R189 citrullination enhances the chemosensitivity of docetaxel to multiple tumour cells
Teng Xue, Shujia Fei, Jian Gu, Nan Li, Pengxue Zhang, Xiaoqiu Liu, Paul R Thompson, Xuesen Zhang
Philosophical Transactions of the Royal Society B: Biological Sciences.2023;[Epub] CrossRef - Baicalein improves the chemoresistance of ovarian cancer through regulation of CirSLC7A6
Shuqing Li, Zhihui Yi, Mingqing Li, Zhiling Zhu
Journal of Ovarian Research.2023;[Epub] CrossRef - Primary cell cultures for the personalized therapy in aggressive thyroid cancer of follicular origin
Poupak Fallahi, Silvia Martina Ferrari, Giusy Elia, Francesca Ragusa, Armando Patrizio, Sabrina Rosaria Paparo, Gianni Marone, Maria Rosaria Galdiero, Giovanni Guglielmi, Rudy Foddis, Alfonso Cristaudo, Alessandro Antonelli
Seminars in Cancer Biology.2022; 79: 203. CrossRef - Synergistic effects of BAY606583 on docetaxel in esophageal cancer through modulation of ERK1/2
Zinab Mohammadi, Jahanbakhsh Asadi, Seyyed Mehdi Jafari
Cell Biochemistry and Function.2022; 40(6): 569. CrossRef - Regulation of Cell Signaling Pathways and Non-Coding RNAs by Baicalein in Different Cancers
Ammad Ahmad Farooqi, Gulnara Kapanova, Sundetgali Kalmakhanov, Gulnur Tanbayeva, Kairat S. Zhakipbekov, Venera S. Rakhmetova, Marat K. Syzdykbayev
International Journal of Molecular Sciences.2022; 23(15): 8377. CrossRef - Crosstalk between xanthine oxidase (XO) inhibiting and cancer chemotherapeutic properties of comestible flavonoids- a comprehensive update
Md Sohanur Rahaman, Md Afjalus Siraj, Md Arman Islam, Prayas Chakma Shanto, Ordha Islam, Md Amirul Islam, Jesus Simal-Gandara
The Journal of Nutritional Biochemistry.2022; 110: 109147. CrossRef - Anticancer effects of natural phytochemicals in anaplastic thyroid cancer (Review)
Yitian Li, Jing Zhang, Huihui Zhou, Zhen Du
Oncology Reports.2022;[Epub] CrossRef - The Multifaceted Role of Baicalein in Cancer Management through Modulation of Cell Signalling Pathways
Arshad Husain Rahmani, Ahmad Almatroudi, Amjad Ali Khan, Ali Yousif Babiker, Malak Alanezi, Khaled S. Allemailem
Molecules.2022; 27(22): 8023. CrossRef - Ouabain Effects on Human Anaplastic Thyroid Carcinoma 8505C Cells
Mariana Pires Teixeira, Natalia Ferreira Haddad, Eliza Freitas Passos, Marcelle Novaes Andrade, Maria Luisa Arantes Campos, Joyle Moreira Carvalho da Silva, Camila Saggioro de Figueiredo, Elizabeth Giestal-de-Araujo, Denise Pires de Carvalho, Leandro Mira
Cancers.2022; 14(24): 6168. CrossRef - Baicalein Represses Cervical Cancer Cell Growth, Cell Cycle Progression and Promotes Apoptosis via Blocking AKT/mTOR Pathway by the Regulation of circHIAT1/miR-19a-3p Axis
Jiaojiao Hu, Runkun Wang, Yi Liu, Jianbo Zhou, Ka Shen, Yun Dai
OncoTargets and Therapy.2021; Volume 14: 905. CrossRef - Phytochemicals in thyroid cancer: analysis of the preclinical studies
Stefania Bulotta, Francesca Capriglione, Marilena Celano, Valeria Pecce, Diego Russo, Valentina Maggisano
Endocrine.2021; 73(1): 8. CrossRef - Cancer-associated fibroblasts (CAFs) in thyroid papillary carcinoma: molecular networks and interactions
Jeehoon Ham, Bin Wang, Joseph William Po, Amandeep Singh, Navin Niles, Cheok Soon Lee
Journal of Clinical Pathology.2021; 74(12): 759. CrossRef - Clinical Study of Virtual Reality Augmented Technology Combined with Contrast-Enhanced Ultrasound in the Assessment of Thyroid Cancer
Qinghua Liu, Jian Cheng, Jingjing Li, Lei Liu, Hongbo Li, Zhihan Lv
Journal of Healthcare Engineering.2021; 2021: 1. CrossRef - Potential of baicalein in the prevention and treatment of cancer: A scientometric analyses based review
Elika Verma, Aviral Kumar, Uzini Devi Daimary, Dey Parama, Sosmitha Girisa, Gautam Sethi, Ajaikumar B. Kunnumakkara
Journal of Functional Foods.2021; 86: 104660. CrossRef - E-cadherin on epithelial–mesenchymal transition in thyroid cancer
Xiaoyu Zhu, Xiaoping Wang, Yifei Gong, Junlin Deng
Cancer Cell International.2021;[Epub] CrossRef - Combinatorial Therapies in Thyroid Cancer: An Overview of Preclinical and Clinical Progresses
Gheysen Laetitia, Saussez Sven, Journe Fabrice
Cells.2020; 9(4): 830. CrossRef - Preclinical and clinical combination therapies in the treatment of anaplastic thyroid cancer
Daniela Gentile, Paola Orlandi, Marta Banchi, Guido Bocci
Medical Oncology.2020;[Epub] CrossRef - Interleukin-22 enhances chemoresistance of lung adenocarcinoma cells to paclitaxel
Zhiliang Huang, Yu Gao, Dianchen Hou
Human Cell.2020; 33(3): 850. CrossRef - Plant natural products with anti-thyroid cancer activity
Javad Sharifi-Rad, Sadegh Rajabi, Miquel Martorell, Maria Dolores López, María Trinidad Toro, Susi Barollo, Decio Armanini, Patrick Valere Tsouh Fokou, Giuseppe Zagotto, Giovanni Ribaudo, Raffaele Pezzani
Fitoterapia.2020; 146: 104640. CrossRef - Baicalein: A metabolite with promising antineoplastic activity
Hardeep Singh Tuli, Vaishali Aggarwal, Jagjit Kaur, Diwakar Aggarwal, Gaurav Parashar, Nidarshana Chaturvedi Parashar, Muobarak Tuorkey, Ginpreet Kaur, Raj Savla, Katrin Sak, Manoj Kumar
Life Sciences.2020; 259: 118183. CrossRef - Impact of Antioxidant Natural Compounds on the Thyroid Gland and Implication of the Keap1/Nrf2 Signaling Pathway
Ana Paunkov, Dionysios V. Chartoumpekis, Panos G. Ziros, Niki Chondrogianni, Thomas W. Kensler, Gerasimos P. Sykiotis
Current Pharmaceutical Design.2019; 25(16): 1828. CrossRef - Reversal of Multidrug Resistance in Cancer by Multi-Functional Flavonoids
Qingmei Ye, Kai Liu, Qun Shen, Qingyue Li, Jinghui Hao, Fangxuan Han, Ren-Wang Jiang
Frontiers in Oncology.2019;[Epub] CrossRef - Inhibition of Cancer Stem-Like Phenotype by Curcumin and Deguelin in CAL-62 Anaplastic Thyroid Cancer Cells
Mehmet A. Kocdor, Hakan Cengiz, Halil Ates, Hilal Kocdor
Anti-Cancer Agents in Medicinal Chemistry.2019; 19(15): 1887. CrossRef - Induction of apoptotic but not autophagic cell death by Cinnamomum cassia extracts on human oral cancer cells
Ching‐Han Yu, Shu‐Chen Chu, Shun‐Fa Yang, Yih‐Shou Hsieh, Chih‐Yi Lee, Pei‐Ni Chen
Journal of Cellular Physiology.2019; 234(4): 5289. CrossRef - Licochalcone A induces apoptotic cell death via JNK/p38 activation in human nasopharyngeal carcinoma cells
Chun‐Yi Chuang, Cheng‐Ming Tang, Hsin‐Yu Ho, Chung‐Han Hsin, Chia‐Jui Weng, Shun‐Fa Yang, Pei‐Ni Chen, Chiao‐Wen Lin
Environmental Toxicology.2019; 34(7): 853. CrossRef - Rab23 contributes to the progression of colorectal cancer via protein kinase B and extracellular signal‑regulated kinase signaling pathways
Tongbi Zhao, Dong Han, Huan Meng
Oncology Letters.2019;[Epub] CrossRef
 PubReader
 ePub Link
 Cite
Cite