
Articles
- Page Path
- HOME > Endocrinol Metab > Volume 35(4); 2020 > Article
-
Original ArticleClinical Study Identification of Novel Genetic Variants Related to Trabecular Bone Score in Community-Dwelling Older Adults
-
Sung Hye Kong1*
 , Ji Won Yoon2*, Jung Hee Kim1, JooYong Park3, Jiyeob Choi3, Ji Hyun Lee4, A Ram Hong5, Nam H. Cho6, Chan Soo Shin1
 -
Endocrinology and Metabolism 2020;35(4):801-810.
DOI: https://doi.org/10.3803/EnM.2020.735
Published online: November 24, 2020
1Department of Internal Medicine, Seoul National University Hospital, Seoul National University College of Medicine, Seoul, Korea
2Department of Internal Medicine, Seoul National University Hospital Healthcare System Gangnam Center, Seoul, Korea
3Department of Preventive Medicine, Seoul National University College of Medicine, Seoul, Korea
4Department of Internal Medicine, Veterans Health Service Medical Center, Seoul, Korea
5Department of Internal Medicine, Chonnam National University Hwasun Hospital, Hwasun, Korea
6Department of Preventive Medicine, Ajou University School of Medicine, Suwon, Korea
- Corresponding author: Nam H. Cho. Department of Preventive Medicine, Ajou University School of Medicine, 164 World cup-ro, Yeongtong-gu, Suwon 16499, Korea, Tel: +82-31-219-5900, Fax: +82-31-219-5901, E-mail: chnaha@ajou.ac.kr
- *These authors contributed equally to this work.
Copyright © 2020 Korean Endocrine Society
This is an Open Access article distributed under the terms of the Creative Commons Attribution Non-Commercial License (https://creativecommons.org/licenses/by-nc/4.0/) which permits unrestricted non-commercial use, distribution, and reproduction in any medium, provided the original work is properly cited.
- 4,599 Views
- 112 Download
ABSTRACT
-
Background
- As the genetic variants of trabecular bone microarchitecture are not well-understood, we performed a genome-wide association study to identify genetic determinants of bone microarchitecture analyzed by trabecular bone score (TBS).
-
Methods
- TBS-associated genes were discovered in the Ansung cohort (discovery cohort), a community-based rural cohort in Korea, and then validated in the Gene-Environment Interaction and Phenotype (GENIE) cohort (validation cohort), consisting of subjects who underwent health check-up programs. In the discovery cohort, 2,451 participants were investigated for 1.42 million genotyped and imputed markers.
-
Results
- In the validation cohort, identified as significant variants were evaluated in 2,733 participants. An intronic variant in iroquois homeobox 3 (IRX3), rs1815994, was significantly associated with TBS in men (P=3.74E-05 in the discovery cohort, P=0.027 in the validation cohort). Another intronic variant in mitogen-activated protein kinase kinase 5 (MAP2K5), rs11630730, was significantly associated with TBS in women (P=3.05E-09 in the discovery cohort, P=0.041 in the validation cohort). Men with the rs1815994 variant and women with the rs11630730 variant had lower TBS and lumbar spine bone mineral density. The detrimental effects of the rs1815994 variant in men and rs11630730 variant in women were also identified in association analysis (β=−0.0281, β=−0.0465, respectively).
-
Conclusion
- In this study, the rs1815994 near IRX3 in men and rs11630730 near MAP2K5 in women were associated with deterioration of the bone microarchitecture. It is the first study to determine the association of genetic variants with TBS. Further studies are needed to confirm our findings and identify additional variants contributing to the trabecular bone microarchitecture.
- Traditionally, measurements of bone mineral density (BMD) are considered essential for diagnosing osteoporosis, which is defined as BMD ≤−2.5 in the T-score [1]. This definition indicates that low BMD significantly increases fracture risk. However, more than half of fragility fractures occur in non-osteoporotic women [2,3]. Thus, other determinants of bone strength, such as the bone microarchitecture and bone geometry, contribute to skeletal fragility [4]. From this perspective, trabecular bone score (TBS), an analytical tool used to measure grey-level textures on lumbar spine (LS) dual X-ray absorptiometry (DXA) images, was introduced to provide information related to the bone trabecular microarchitecture. Previous studies demonstrated that independent of BMD, TBS was associated with the incidence of new fracture and had an additive effect on predicting fracture risk [5,6].
- Genome-wide association studies (GWAS) have revealed a large number of loci associated with BMD and fractures. Initial studies identified loci associated with BMD, such as RANKL, OPG, ESR1, FTO, RUNX2, and LRP5 [7–11]. Since then, many GWAS have been performed, revealing more than 100 candidate genes for osteoporosis [12–14]. Among them, novel variants such as ZBTB40, AXIN1, and WLS were selected for further studies [13,15]. However, the genetic determinants affecting trabecular bone microarchitectures and BMD may differ. Some studies observed differences in genetic heritability between cortical and trabecular bones. The heritability of trabecular volumetric BMD has been reported to be as high as 59%, whereas that of cortical volumetric BMD was relatively low at 40% [16]. Additionally, GWAS revealed distinct genetic associations in the lumbar and hip BMD, suggesting that the genetic influences differ in cortical and trabecular bones [13]. However, the genetic contributors to the trabecular bone microarchitecture that influence TBS are unknown.
- This study was conducted to identify the genetic determinants of the bone microarchitecture analyzed by TBS. Using both discovery and validation cohorts, we first aimed to identify genome-wide significant genetic variants associated with TBS and then to validate the identified variants in the validation cohort.
INTRODUCTION
- Participants in the discovery set
- Participants were recruited from the Ansung cohort based in Ansung city, Gyeonggi-do, Korea, as a part of the Korean Genome Epidemiology Study (KoGES) [17,18]. The investigation was performed in 2008 and involved 4,206 people in a community-dwelling population. Participants without BMD and TBS (n=200) or GWAS data (n=1,427) were excluded. Men under the age of 50 years (n=168), premenopausal women (n=262), participants being administered anti-osteoporotic drugs (n= 169), or those diagnosed with malignancy (n=15) were also excluded. The total number of participants included in the analysis was 2,451 (1,000 men and 1,451 women). The present study was approved by the Institutional Review Board of Seoul National University Hospital (IRB number 1805-086-946) and was performed according to the Helsinki declaration on the use of human subjects for research. Informed consent was obtained from all patients in the cohort.
- Participants in the validation set
- Participants in the validation cohort belonged to the Gene-Environment Interaction and Phenotype (GENIE) cohort, which is a sub-cohort of The Health and Prevention Enhancement of the Seoul National University Hospital Gangnam Center in Korea [19]. The cohort includes patients who visited the Seoul National University Hospital Healthcare System Gangnam Center for health check-up between January 2014 and December 2014. Among the 8,000 patients in the GENIE cohort, participants without BMD and TBS data (n=4,085) were excluded. Also, men under the age of 50 years and premenopausal women (n= 1,138), or participants diagnosed with malignancy (n=44) were excluded. In the final analysis, 2,733 (949 men and 1,784 women) were eligible for validation according to the criteria described above for the discovery set. This retrospective study was approved by the Institutional Review Board (H-1712-067-906) of the Seoul National University Hospital; the requirement for informed consent was waived by the institution.
- Measurements of BMD and TBS
- The BMD (g/cm2) of skeletal sites (LS, femoral neck, and total hip [TH]) and muscle mass were measured using DXA (GE Lunar Prodigy, GE Healthcare, Little Chalfont, UK) and analyzed (Encore Software version 11.0, Encore Software, Minneapolis, MN, USA) according to the manufacturer’s instructions. The BMD precision error (% coefficient of variance [CV]) was 1.7%, 1.8%, and 1.7% for the LS, femoral neck, and TH, respectively, in the Ansung and GENIE cohorts [20,21]. For the LS BMD, the L1–4 value was used for analyses. LSs with compression fracture or severe sclerotic change were omitted from the analyses (e.g., L2–4 were included in analyses if there was a compression fracture at L1). All TBS measurements were retrospectively performed using TBS iNsight Software version 2.0.0.1 (Med-Imaps, Pessac, France) using spine DXA files from the database to ensure that all investigators were blinded to all clinical parameters and outcomes. The software used the raw DXA image of the anteroposterior spine for the same region of interest as the BMD measurement. The precision error (%CV) was 1.5% for the TBS. The instruments were calibrated using anthropomorphic phantoms.
- Genotyping and imputation
- We extracted genomic DNA from peripheral leukocytes of the participants. The discovery and validation cohorts were analyzed using Affymetrix Genome-Wide Human single nucleotide polymorphism (SNP) Array 5.0 and Affymetrix Axiom KORV1.1–96 Array (Affymetrix, Santa Clara, CA, USA), respectively, which was performed by DNAlink Inc. (Seoul, Korea). Only unrelated subjects with <5% missing genotype were included in the analysis. Markers showing significant deviations from the Hardy-Weinberg equilibrium (P<1.0×10⁻⁶), a genotype call rate <0.95, and minor allele frequency <0.01 were excluded. A total of 351,669 SNPs in the discovery cohort and 345,072 SNPs in the validation cohort were directly genotyped and were available for analyses. Imputation was performed using IMPUTE software (https://mathgen.stats.ox.ac.uk/impute) [22]. The HapMap phased genotype information of Japanese individuals from Tokyo, Japan (JPT) and unrelated Han Chinese individuals from Beijing, China (CHB) (build 36 release 22) was used as a reference. Imputed SNPs with a high genotype information content (info >0.5) were used [23]. The same quality control criteria were applied to the imputed SNPs and genotyped SNPs.
- Statistical analyses
- Association testing was performed using PLINK v1.9 (http://pngu.mgh.harvard.edu/purcell/plink/) [24]. Linear regression assuming an additive genotypic model was used for TBS. Age, sex, and body mass index (BMI) were used as covariates. The results of the discovery cohort can be downloaded from the following webpage: http://bri.snuh.org/bench/_/notice/5250/view.do. In the validation cohort, only variants that passed the significance threshold (P<5.0×10⁻⁸) or false discovery rate (FDR) (P<0.05) in the discovery cohort were analyzed [25,26]. The significance threshold for the validation cohort follow-up was P<0.05. Genome-wide significance was considered as P<5.0×10⁻⁸. Analyses were performed separately for each sex to identify sex-specific effects.
- All analyses were performed with the R language and environment for statistical computing (R Foundation for Statistical Computing, Vienna, Austria). We used Plink v1.9 [24] and data from the 1000 Genome Project Phase 3 [27] to identify proxy SNPs (r2<0.7). Each GWAS locus was defined based on the positions of the left and rightmost proxy SNPs. All SNP and gene locations were relative to the hg38 genome assembly. We also included the closest gene up- and down-stream.
METHODS
- Characteristics of the included cohorts
- Anthropometrics and bone phenotypes of the discovery and validation cohorts (KoGES for discovery, GENIE for validation) are shown in Table 1. In the discovery cohort, the mean age of the participants was 62.6 years, and 59.2% of them were female. LS, femur neck [27], and TH BMDs were higher in men than in women. In the validation cohort, as the mean age was 51.1 years and 65.3% of them were women, participants were younger and more likely to be women. The BMI of the subjects was also higher in the validation cohort. For BMD, the LS BMD was higher in the validation cohort than in the discovery cohort (1.184±0.170, 1.007±0.194 g/cm2, P=0.005, respectively). Additionally, in women, FN, TH BMD, and TBS were higher in the validation cohort than in the discovery cohort.
- GWAS in the discovery cohort
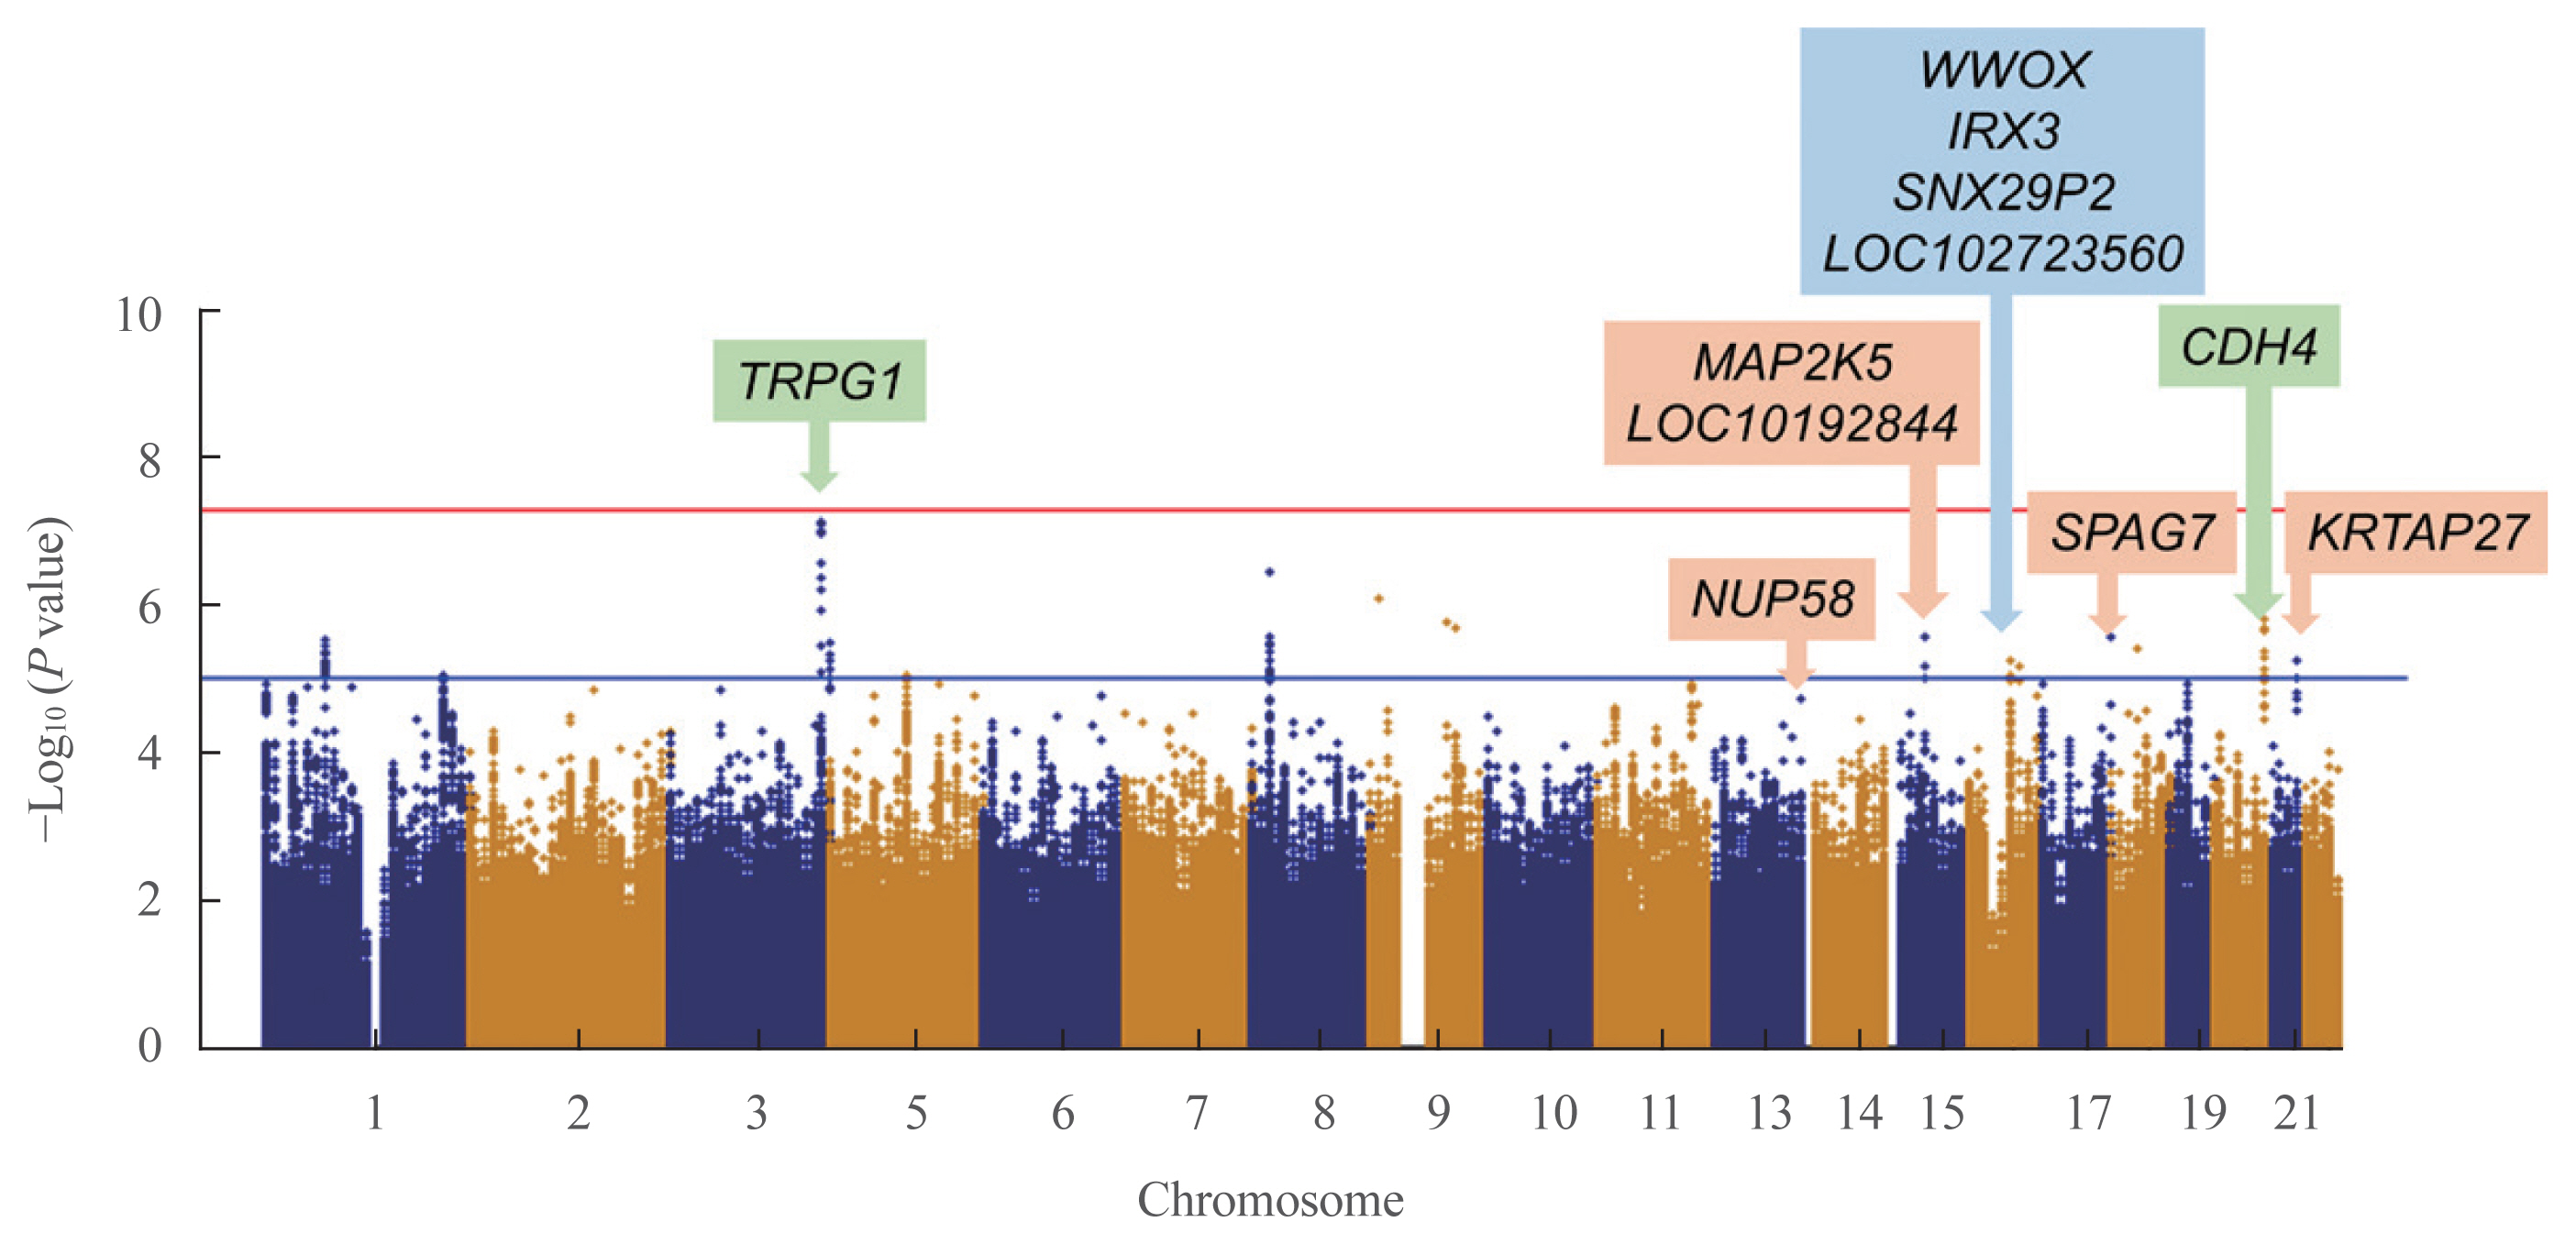
- To detect associations between the genetic variants and TBS, we performed linear regression analysis after adjusting for age, sex, and BMI. In the discovery cohort, 351,669 SNPs were genotyped and passed our quality control filters. After imputation, 1,418,709 SNPs were available for analyses. The Manhattan plot showing significant SNPs is presented in Fig. 1. Two independent variants were selected based on their suggestive associations that passed the significance threshold or FDR post hoc analyses (P<0.05) (Table 2). In the total population, the rs62289585 variant (gene LOC107986169, intronic variant, position chr3: 189493025 [reference GRCh38.p12]) in the intron near trpG1 (anthranilate synthase subunit II) was associated with TBS (P=7.391.0×10−8) and remained significant after adjusting for age, sex, and BMI (P=1.19×10⁻⁷). Additionally, the rs55885339 variant (gene CDH4, intronic variant, position chr20:61652860 [reference GRCh38.p12]) was associated with TBS (P=1.65×10⁻⁶) and was significant after adjustments (P=3.45×10⁻⁶).
- Because the TBS is largely influenced by sex, subgroup analysis according to sex was performed. In men, four SNPs were significantly related to TBS, which were rs7206379 (gene WWOX, intronic variant, position chr16:78260046), rs78861306 (gene LOC102723560, intronic variant, position chr16:62751082), rs3851758 (near gene SNX29P2, intronic variant, position chr16: 29248901), and rs1815994 variants (near gene IRX3, intronic variant, position chr16:54523817) in chromosome 16 with reference of GRCh38.p12. In women, five SNPs were also found to be significant, which were rs11630730 (gene MAP2K, intronic variant, position chr15:67565508), rs67059207 (gene SPAG7, intronic variant, position chr17:4965798), rs9507502 (gene MUP58, intronic variant, position chr13:25345858), rs2244721 (near gene KRTAP27, intronic variant, position chr21:30350740), and rs785021 variants (near gene LOC101928442, intronic variant, position chr15:47856460) with reference of GRCh38.p12. Significant SNPs in men and women differed from those found in the total participants.
- GWAS in the validation cohort
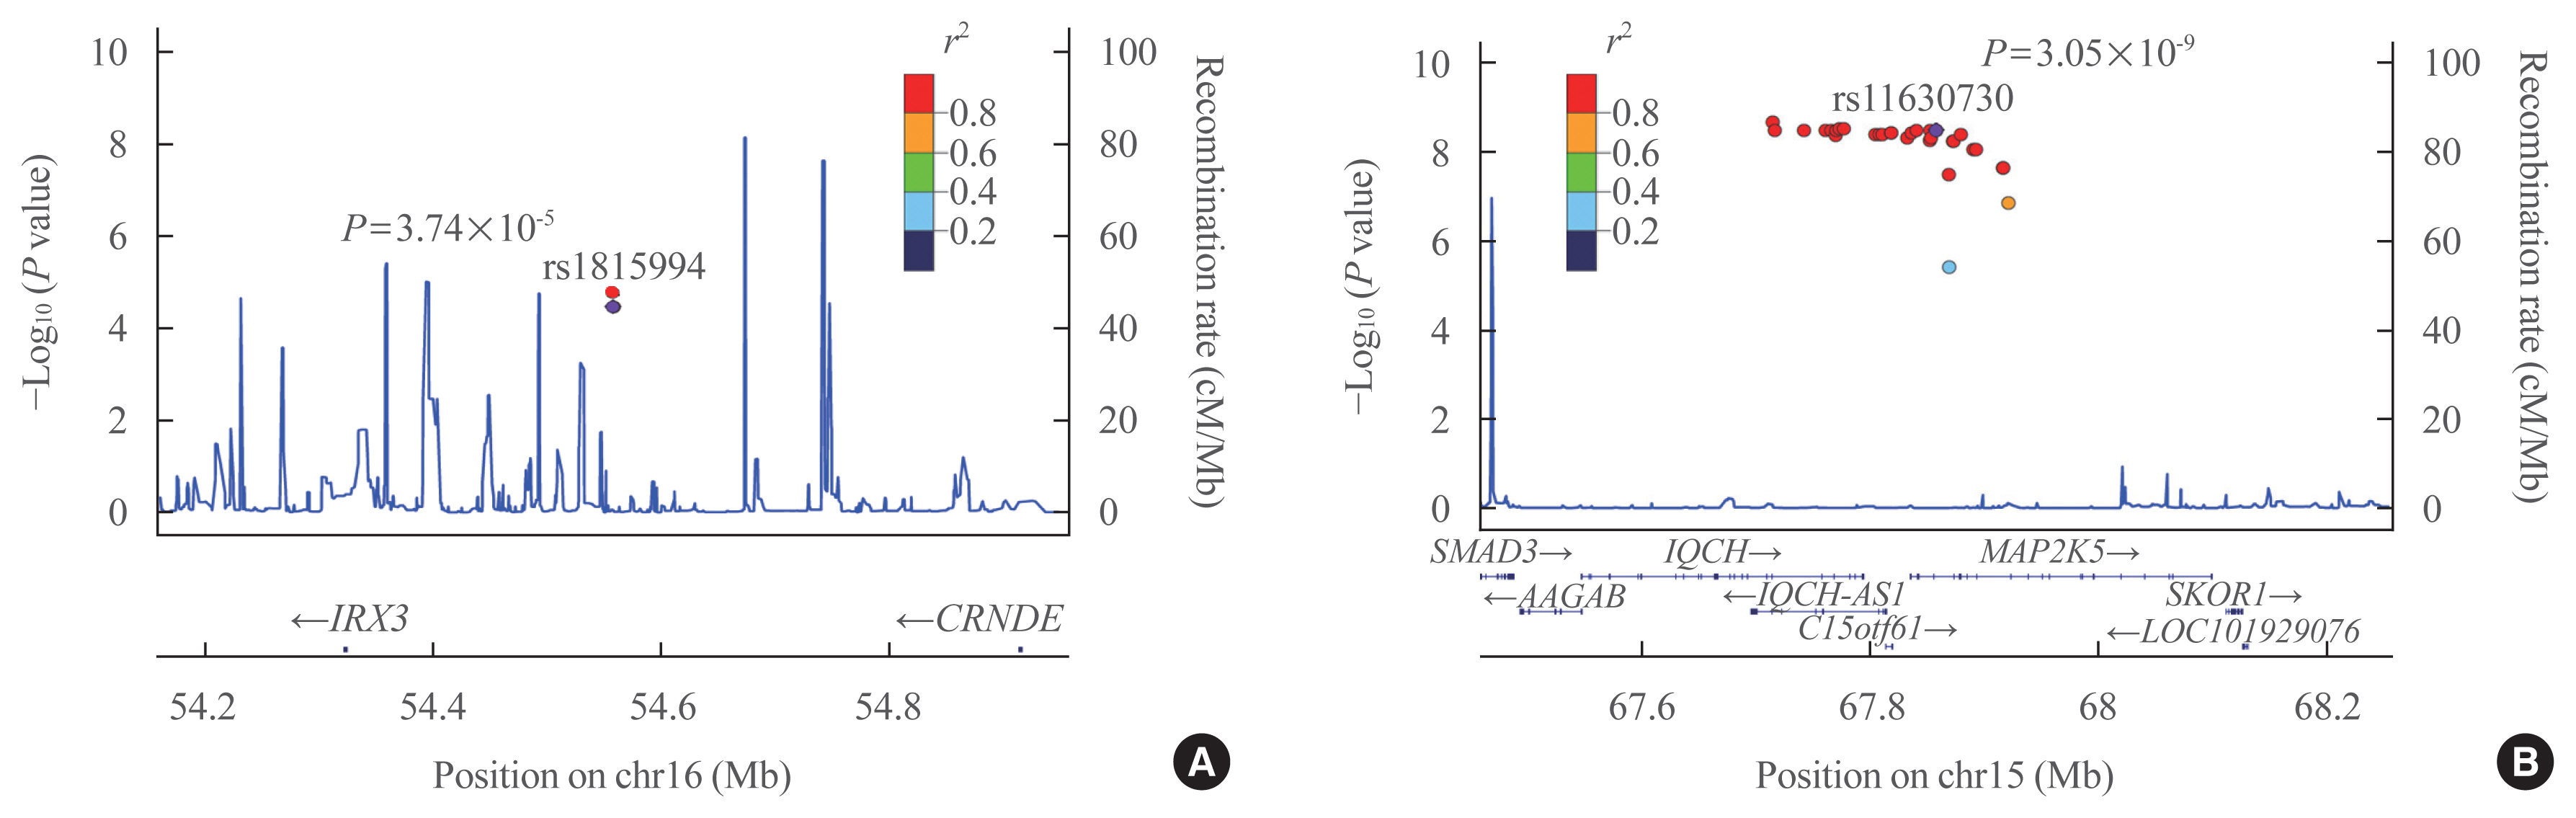
- Eleven variants were further evaluated in the GENIE cohort, which was used as the validation cohort (Table 2). Among them, two SNPs showed significant associations with TBS in the validation cohort (P<0.05) (Table 2). In men, the rs1815994 variant in the intron of IRX3 was associated with TBS (P=3.74×10⁻⁵ in the discovery cohort, P=0.027 in the validation cohort). In women, the rs11630730 variant in the intron of mitogen-activated protein kinase kinase 5 (MAP2K5) was related to TBS in both cohorts (P=3.74×10⁻⁵ in the discovery cohort, P=0.027 in the validation cohort). Regional association plots of the variants near rs1815994 and rs11630730 are shown in Fig. 2.
- Phenotypes related to bone according to the rs1815994 and rs11630730 variants
- Among the two variants which passed the threshold for the discovery and validation cohorts, men with the AA genotype of rs1815994 variant near IRX3 showed a higher TBS than those with the AG or GG genotype (1.438±0.003, 1.414±0.010, 1.359±0.030; P=0.038, P=0.010, respectively) (Supplemental Fig. S1). There was a similar trend in the LS BMD, in which men with the AA genotype showed a higher LS BMD than those with the AG or GG genotype (1.101±0.009, 1.050±0.019, 0.962±0.097 g/cm2; P=0.041, P=0.020, respectively). However, the femur neck and TH BMD were similar among genotypes of the rs1815994 variant.
- According to the rs11630730 variant near MAP2K5, women with the AA genotype showed a higher TBS than those with the AG genotype (1.394±0.002, 1.346±0.017, respectively; P= 0.037) (Supplemental Fig. S2). The LS BMD was higher in women with the AG genotype than in those with the GG genotype (0.953±0.007, 0.707±0.090 g/cm2, respectively; P=0.046). The femur neck and TH BMDs were similar among genotypes of the rs11630730 variant. The detrimental effects of the rs1815994 variant in men and rs11630730 variant in women were also identified in association analysis (β=−0.0281, β=−0.0465, respectively) (Table 2).
- In the validation cohort, men with the AG genotype of rs1815994 variant had higher TBS than those with GG genotype (1.449±0.066, 1.399±0.065, P=0.042, respectively). Also, men with AA and AG genotype of rs1815994 variant higher LS BMD than those with GG genotype (1.249±0.184, 1.261±0.168, 1.071±0.161, P=0.032, respectively). Women with AG genotype of rs11630730 variant had higher TBS than those with GG genotype (1.391±0.065, 1.312±0.087, P=0.039, respectively). The femur neck and TH BMD were similar between genotypes in both genders.
RESULTS
- In this 2-stage GWAS, we discovered and confirmed that rs1815994 near IRX3 in men and rs11630730 near MAP2K5 in women were associated with the deterioration of bone microarchitecture reflected by TBS in both cohorts. We also identified additional novel variants such as rs7206379, rs78861306, and rs3851758 near WWOX, LOC102723560, and SNX29P2, respectively, in men and rs67059207, rs9507502, rs2244721, and rs785021 variants near SPAG7, MUP58, KRTAP27, and LOC101928442, respectively, in women. However, these genes were significant only in the discovery cohort. This is the first study to identify a presumable functional variant associated with TBS.
- IRX3 encodes for iroquois-class homeodomain protein IRX-3, which is a member of the iroquois homeobox family and a transcriptional factor involved in neural development [28]. IRX3 is reported to be related to obesity [29], angiogenesis [30], and limb skeletal formation [31]. However, the functional role of IRX3 in the bone microarchitecture is not fully understood. A previous study showed that Irx3 and Irx5 regulate early skeletal formation by modulating sonic hedgehog signaling [31]. As sonic hedgehog signaling is known to alter the architecture and mechanical properties of trabecular bone [32], the rs1815994 variant near IRX3 may regulate the bone microarchitecture in older adults. In another study, Irx3 and Irx5 were found to be associated with skeletal mineralization [33]. Osteoblast-specific deletion of Irx3 and Irx5 causes mineralization defects in cranial bones, as well as bone fragility similar to Hamamy syndrome, which is a rare autosomal recessive syndrome involving mental retardation and osteopenia with repeated fractures [34]. Additionally, a recent study showed that Irx3 regulated chondrogenic differentiation in mouse mesenchymal cells. Irx3 expression was increased with chondrocyte differentiation of mesenchymal cells following Bmp2 treatment in the study [35]. As reported, chondrocyte-induced signaling such as Indian hedgehog was essential for maintaining the growth plate and articular surface and was required for sustaining the trabecular bone structure [36]. Therefore, IRX3 near rs1815994 variant may be a novel target for maintaining trabecular microarchitecture, which should be further examined.
- Another notable result of this study was the identification of the rs11630730 variant near MAP2K5 associated with TBS in women. MAP2K5 encodes for MAPK/ERK kinase 5 and is ubiquitously expressed in most human tissues [31]. This gene plays a critical role in activating the MAPK7/ERK5 pathway, which is essential for skeletal development and homeostasis [37]. In a previous study, the MAPK/ERK pathway was highly activated in osteoblasts in mature osteoblasts in vitro and in vivo. When the ERK pathway was inactivated by knock-down of MAP2Ks, mice without MAP2K activity showed severe osteopenia with growth retardation. Interestingly, inactivation of the ERK pathway in adult mice with tamoxifen-inducible Cre recombinase reduced the trabecular bone mass, number, and thickness in mice [37]. In this regard, modulating MAP2K5 activity by the rs11630730 variant may have a significant role in maintaining the trabecular bone microarchitecture. Other studies showed that MAP2K5 is essential for the early stages of myogenesis [38–40]. As ERK5 and MAP2K5 modulate IGF-2 to regulate promyogenic activities, muscle atrophy by an impaired MAPK5/ERK5 pathway can cause impaired bone microarchitecture [39,41]. However, further studies are needed to confirm the association of rs11630730 with decreased expression of MAP2K5 in the bone or muscle. As patients with different genotypes had different BMD and TBS, specific genotypes of the variants could be used as one of the indicators for patients with a low risk of degraded microarchitecture or osteoporosis. In specific, the AA genotype of rs1815994 variant in men and the AA genotype of rs11630730 variant in women could be potential protective markers for osteoporosis or conserved microarchitecture.
- Other genes may have clinical implications as markers for the bone microarchitecture, although they were significant only in the discovery cohort. The rs55885339 variant near CDH4 showed a significant association in the total population in the discovery cohort but was not significant in the validation cohort. CDH4 encodes R-cadherin/cadherin-4 protein, which is a cell adhesion molecule. Cadherins are well-known to be anchored to the cytoskeleton via binding to β-catenin [42]. As β-catenin is vital in the canonical Wnt signaling system, cadherins can modulate osteogenic differentiation, skeletal development, and maintaining homeostasis by regulating binding affinities with β-catenin [43]. In men, we also found an association of the rs7206379 variant, which is near WWOX. WWOX encodes WW domain-containing oxidoreductase, which is a tumor suppressor gene in osteosarcoma and is also related to bone metabolic disease such as osteoporosis [44]. WWOX associates with RUNX2 to suppress its transcriptional activity in osteoblasts [45]. In this regard, both rs55885339 and rs7206379 variants near CDH4 and WWOX may be novel modulators of the bone microarchitecture, which should be validated in further replication studies. Variants and genes found in this study were novel and have not been previously described in other GWAS of BMD or fracture. Additionally, the genetic control of trabecular bone microarchitecture may differ from that of BMD. However, since TBS is a calculated score from BMD results, which is an indirect measurement of the microarchitecture, the result should be carefully interpreted.
- Although the variants in this study have not been reported in the previous studies regarding BMD, known variants associated with BMD may be relevant to the variants from the study. In previous reports, over 100 loci, including FTO and RUNX2, were found to be linked with BMD [7–11]. Interestingly, SNPs of FTO which is a known variant associated with BMD and IRX3 from our study were in strong linkage disequilibrium and associated with the risk of obesity [12]. As obesity is correlated to the trabecular microarchitecture of bone [13,14], polymorphisms of IRX3, along with FTO, may have an association with the bone microarchitecture. Also, mitogen-activated protein kinases (MAPKs), including MAP2K5 from our study, are traditional signal transducers and reported to act in phosphorylating RUNX2 [15]. Therefore, variants in MAP2K5 could result in different activities of RUNX2, which is also a well-known variant associated with osteoporosis [16], which may have a combined effect on the bone trabecular microarchitecture. However, future works with a focus on the combined effect of different variants are needed.
- We believe that our study provides novel evidence that previous GWAS could not suggest from GWAS with total BMD. This is the first study to demonstrate an association of the variants with TBS, and thus further replication studies are required to confirm and to identify additional variants involved in the trabecular bone microarchitecture. These findings may result in the identification of novel osteoporosis drug targets, particularly for IRX3 and MAP2K5. There were some limitations to this study. A major limitation is the relatively modest sample size for GWAS, which may have caused us to miss some true-positive associations. Additionally, the interpretation of the results needs caution since TBS only reflects the bone microarchitecture, does not measure it directly. However, TBS has been shown to be associated with fracture independently of BMD, and has been widely validated and used in previous clinical studies [46,47]. Importantly, patients in the discovery cohort were older and had a higher BMI than those in the validation cohort. To minimize these differences between cohorts, we adjusted for age, sex, and BMI when calculating the linear association of variants with TBS in both cohorts. However, the different baseline characteristics between cohorts should be considered when interpreting the results, mainly when the variants showed a significant association in only one cohort.
- In this GWAS, we identified an intronic variant of IRX3, rs1815994, in men and MAP2K, rs11630730, in women associated with the trabecular bone microarchitecture analyzed based on the TBS. These results broaden the understanding of the genetic factors contributing to the trabecular microarchitecture and may provide novel targets for fracture prevention.
DISCUSSION
Supplementary Data
Supplemental Fig. S1
Supplemental Fig. S2
-
CONFLICTS OF INTEREST
We thank DNALink.Inc. for supporting the analysis of the genomic data in GENIE cohort.
-
AUTHOR CONTRIBUTIONS
Conception or design: S.H.K., J.H.K. Acquisition, analysis, or interpretation of data: S.H.K., J.W.Y., J.H.K., J.C., J.Y.P., J.H.L., A.R.H., N.H.C., C.S.S. Drafting the work or revising: S.H.K., J.W.Y., J.H.K., C.S.S. Final approval of the manuscript: S.H.K., C.S.S.
Article information
-
Acknowledgements
- The research was funded by Korean Health Technology R&D Project (A092077).
| Characteristic | Discovery set (Ansung cohort) | Validation set (GENIE cohort) | ||||
|---|---|---|---|---|---|---|
|
|
|
|||||
| Total (n=2,451) | Men (n=1,000) | Women (n=1,451) | Total (n=2,733) | Men (n=949) | Women (n=1,784) | |
| Age, yr | 62.6±10.6 | 62.7±10.4 | 62.5±10.7 | 51.1±8.4a | 54.6±8.5a | 49.2±7.8a |
|
|
||||||
| Female sex | 1,451 (59.2) | - | - | 1,784 (65.3)a | - | - |
|
|
||||||
| BMI, kg/m2 | 24.3±3.3 | 23.7±3.0 | 24.7±3.4 | 22.7±2.9a | 24.3±2.4 | 21.8±2.7a |
|
|
||||||
| Lumbar spine BMD, g/cm2 | 1.007±0.194 | 1.090±0.185 | 0.952±0.180 | 1.184±0.170a | 1.156±0.160a | 1.237±0.174a |
|
|
||||||
| Femur neck BMD, g/cm2 | 0.834±0.146 | 0.897±0.143 | 0.790±0.131 | 0.879±0.119 | 0.865±0.113 | 0.921±0.127a |
|
|
||||||
| Total hip BMD, g/cm2 | 0.899±0.154 | 0.965±0.144 | 0.853±0.144 | 0.945±0.127 | 0.924±0.119 | 1.012±0.129a |
|
|
||||||
| Trabecular bone score | 1.406±0.112 | 1.432±0.098 | 1.388±0.117 | 1.415±0.068 | 1.433±0.071 | 1.405±0.064a |
| Chr | Position (bp) | A1 | Nearby gene | Discovery set (Ansung cohort) | Validation set (GENIE cohort) | |||||
|---|---|---|---|---|---|---|---|---|---|---|
|
|
|
|||||||||
| β | P value | P valuea | β | P value | P valuea | |||||
| Variant | ||||||||||
| rs62289585 | 3 | 189210814 | G | TRPG1 | −0.0294 | 7.39E-08 | 1.19E-07 | −0.0016 | 0.890 | 0.686 |
| rs55885339 | 20 | 60227916 | T | CDH4 | −0.0161 | 1.65E-06 | 3.45E-06 | 0.0036 | 0.541 | 0.118 |
|
|
||||||||||
| Men | ||||||||||
| rs7206379 | 16 | 78293943 | G | WWOX | −0.0318 | 9.40E-07 | 1.08E-06 | 0.0018 | 0.620 | 0.548 |
| rs78861306 | 16 | 62784986 | G | LOC102723560 | −0.0443 | 1.14E-06 | 1.30E-06 | −0.0035 | 0.590 | 0.425 |
| rs3851758 | 16 | 29260222 | T | SNX29P2 | −0.0310 | 1.55E-05 | 1.72E-05 | −0.0031 | 0.202 | 0.269 |
| rs1815994 | 16 | 54557729 | G | IRX3 | −0.0281 | 3.39E-05 | 3.74E-05 | −0.0075 | 0.012 | 0.027 |
|
|
||||||||||
| Women | ||||||||||
| rs11630730 | 15 | 67857846 | G | MAP2K5 | −0.0465 | 3.05E-09 | 7.77E-09 | −0.0123 | 0.031 | 0.041 |
| rs67059207 | 17 | 4869093 | C | SPAG7 | −0.0349 | 1.27E-07 | 1.25E-07 | 0.0023 | 0.388 | 0.662 |
| rs9507502 | 13 | 25919996 | G | NUP58 | −0.0327 | 7.78E-07 | 1.05E-06 | 0.0059 | 0.237 | 0.282 |
| rs2244721 | 21 | 31723058 | A | KRTAP27 | −0.0385 | 6.43E-06 | 2.30E-05 | 0.0076 | 0.231 | 0.292 |
| rs785021 | 15 | 48148657 | G | LOC101928442 | −0.0181 | 1.45E-05 | 2.43E-05 | 0.0035 | 0.239 | 0.279 |
Associations were tested with minor alleles by linear regression for the trabecular bone score. The effect size is shown as β. The minor allele and its physical position are indexed to the positive strand of the National Center for Biotechnology Information (NCBI) build 36. The nearby gene is defined as the gene nearest to the variant within the boundary of the 50-Kb distance. Chr, chromosome number; A1, minor allele; β, an effect size of linear regression; GENIE, Gene-Environment Interaction and Phenotype.
a P values from multivariate linear regression analyses with adjustments of age and body mass index.
- 1. Kanis JA, McCloskey EV, Johansson H, Oden A, Melton LJ 3rd, Khaltaev N. A reference standard for the description of osteoporosis. Bone 2008;42:467–75.ArticlePubMed
- 2. Schuit SC, van der Klift M, Weel AE, de Laet CE, Burger H, Seeman E, et al. Fracture incidence and association with bone mineral density in elderly men and women: the Rotterdam Study. Bone 2004;34:195–202.ArticlePubMed
- 3. Siris ES, Chen YT, Abbott TA, Barrett-Connor E, Miller PD, Wehren LE, et al. Bone mineral density thresholds for pharmacological intervention to prevent fractures. Arch Intern Med 2004;164:1108–12.ArticlePubMed
- 4. Seeman E, Delmas PD. Bone quality: the material and structural basis of bone strength and fragility. N Engl J Med 2006;354:2250–61.ArticlePubMed
- 5. Hans D, Goertzen AL, Krieg MA, Leslie WD. Bone microarchitecture assessed by TBS predicts osteoporotic fractures independent of bone density: the Manitoba study. J Bone Miner Res 2011;26:2762–9.ArticlePubMed
- 6. Boutroy S, Hans D, Sornay-Rendu E, Vilayphiou N, Winzenrieth R, Chapurlat R. Trabecular bone score improves fracture risk prediction in non-osteoporotic women: the OFELY study. Osteoporos Int 2013;24:77–85.ArticlePubMed
- 7. Kiel DP, Demissie S, Dupuis J, Lunetta KL, Murabito JM, Karasik D. Genome-wide association with bone mass and geometry in the Framingham Heart Study. BMC Med Genet 2007;8(Suppl 1):S14.ArticlePubMedPMC
- 8. Richards JB, Rivadeneira F, Inouye M, Pastinen TM, Soranzo N, Wilson SG, et al. Bone mineral density, osteoporosis, and osteoporotic fractures: a genome-wide association study. Lancet 2008;371:1505–12.ArticlePubMedPMC
- 9. Styrkarsdottir U, Halldorsson BV, Gretarsdottir S, Gudbjartsson DF, Walters GB, Ingvarsson T, et al. Multiple genetic loci for bone mineral density and fractures. N Engl J Med 2008;358:2355–65.ArticlePubMed
- 10. Pei YF, Liu L, Liu TL, Yang XL, Zhang H, Wei XT, et al. Joint association analysis identified 18 new loci for bone mineral density. J Bone Miner Res 2019;34:1086–94.ArticlePubMed
- 11. Guo Y, Liu H, Yang TL, Li SM, Li SK, Tian Q, et al. The fat mass and obesity associated gene, FTO, is also associated with osteoporosis phenotypes. PLoS One 2011;6:e27312.ArticlePubMedPMC
- 12. Richards JB, Kavvoura FK, Rivadeneira F, Styrkarsdottir U, Estrada K, Halldorsson BV, et al. Collaborative meta-analysis: associations of 150 candidate genes with osteoporosis and osteoporotic fracture. Ann Intern Med 2009;151:528–37.ArticlePubMedPMC
- 13. Estrada K, Styrkarsdottir U, Evangelou E, Hsu YH, Duncan EL, Ntzani EE, et al. Genome-wide meta-analysis identifies 56 bone mineral density loci and reveals 14 loci associated with risk of fracture. Nat Genet 2012;44:491–501.ArticlePubMedPMC
- 14. Masi L, Agnusdei D, Bilezikian J, Chappard D, Chapurlat R, Cianferotti L, et al. Taxonomy of rare genetic metabolic bone disorders. Osteoporos Int 2015;26:2529–58.ArticlePubMed
- 15. Richards JB, Zheng HF, Spector TD. Genetics of osteoporosis from genome-wide association studies: advances and challenges. Nat Rev Genet 2012;13:576–88.ArticlePubMed
- 16. Havill LM, Mahaney MC, L Binkley T, Specker BL. Effects of genes, sex, age, and activity on BMC, bone size, and areal and volumetric BMD. J Bone Miner Res 2007;22:737–46.ArticlePubMed
- 17. Cho YS, Go MJ, Kim YJ, Heo JY, Oh JH, Ban HJ, et al. A large-scale genome-wide association study of Asian populations uncovers genetic factors influencing eight quantitative traits. Nat Genet 2009;41:527–34.ArticlePubMed
- 18. Hong KW, Kim SS, Kim Y. Genome-wide association study of orthostatic hypotension and supine-standing blood pressure changes in two Korean populations. Genomics Inform 2013;11:129–34.ArticlePubMedPMC
- 19. Lee C, Choe EK, Choi JM, Hwang Y, Lee Y, Park B, et al. Health and Prevention Enhancement (H-PEACE): a retrospective, population-based cohort study conducted at the Seoul National University Hospital Gangnam Center, Korea. BMJ Open 2018;8:e019327.ArticlePubMedPMC
- 20. Kim JH, Choi HJ, Ku EJ, Hong AR, Kim KM, Kim SW, et al. Regional body fat depots differently affect bone microarchitecture in postmenopausal Korean women. Osteoporos Int 2016;27:1161–8.ArticlePubMed
- 21. Sohn S, Chung CK, Han I, Park SB, Kim H. Increased bone mineral density in cervical or thoracic Diffuse Idiopathic Skeletal Hyperostosis (DISH): a case-control study. J Clin Densitom 2018;21:68–74.ArticlePubMed
- 22. Marchini J, Howie B, Myers S, McVean G, Donnelly P. A new multipoint method for genome-wide association studies by imputation of genotypes. Nat Genet 2007;39:906–13.ArticlePubMed
- 23. International HapMap Consortium. The international HapMap project. Nature 2003;426:789–96.ArticlePubMed
- 24. Purcell S, Neale B, Todd-Brown K, Thomas L, Ferreira MA, Bender D, et al. PLINK: a tool set for whole-genome association and population-based linkage analyses. Am J Hum Genet 2007;81:559–75.ArticlePubMedPMC
- 25. Pe’er I, Yelensky R, Altshuler D, Daly MJ. Estimation of the multiple testing burden for genomewide association studies of nearly all common variants. Genet Epidemiol 2008;32:381–5.ArticlePubMed
- 26. Glickman ME, Rao SR, Schultz MR. False discovery rate control is a recommended alternative to Bonferroni-type adjustments in health studies. J Clin Epidemiol 2014;67:850–7.ArticlePubMed
- 27. 1000 Genomes Project Consortium, Auton A, Brooks LD, Durbin RM, Garrison EP, Kang HM, et al. A global reference for human genetic variation. Nature 2015;526:68–74.ArticlePubMedPMC
- 28. Bellefroid EJ, Kobbe A, Gruss P, Pieler T, Gurdon JB, Papalopulu N. Xiro3 encodes a Xenopus homolog of the Drosophila Iroquois genes and functions in neural specification. EMBO J 1998;17:191–203.ArticlePubMedPMC
- 29. Landgraf K, Scholz M, Kovacs P, Kiess W, Korner A. FTO obesity risk variants are linked to adipocyte IRX3 expression and BMI of children: relevance of FTO variants to defend body weight in lean children? PLoS One 2016;11:e0161739.ArticlePubMedPMC
- 30. Scarlett K, Pattabiraman V, Barnett P, Liu D, Anderson LM. The proangiogenic effect of iroquois homeobox transcription factor Irx3 in human microvascular endothelial cells. J Biol Chem 2015;290:6303–15.ArticlePubMed
- 31. Fagerberg L, Hallstrom BM, Oksvold P, Kampf C, Djureinovic D, Odeberg J, et al. Analysis of the human tissue-specific expression by genome-wide integration of transcriptomics and antibody-based proteomics. Mol Cell Proteomics 2014;13:397–406.ArticlePubMed
- 32. Kiuru M, Solomon J, Ghali B, van der Meulen M, Crystal RG, Hidaka C. Transient overexpression of sonic hedgehog alters the architecture and mechanical properties of trabecular bone. J Bone Miner Res 2009;24:1598–607.ArticlePubMedPMC
- 33. Cain CJ, Gaborit N, Lwin W, Barruet E, Ho S, Bonnard C, et al. Loss of iroquois homeobox transcription factors 3 and 5 in osteoblasts disrupts cranial mineralization. Bone Rep 2016;5:86–95.ArticlePubMedPMC
- 34. Hamamy HA, Teebi AS, Oudjhane K, Shegem NN, Ajlouni KM. Severe hypertelorism, midface prominence, prominent/simple ears, severe myopia, borderline intelligence, and bone fragility in two brothers: new syndrome? Am J Med Genet A 2007;143A:229–34.ArticlePubMed
- 35. Tamamura Y, Katsube K, Mera H, Itokazu M, Wakitani S. Irx3 and Bmp2 regulate mouse mesenchymal cell chondrogenic differentiation in both a Sox9-dependent and -independent manner. J Cell Physiol 2017;232:3317–36.ArticlePubMed
- 36. Maeda Y, Nakamura E, Nguyen MT, Suva LJ, Swain FL, Razzaque MS, et al. Indian Hedgehog produced by postnatal chondrocytes is essential for maintaining a growth plate and trabecular bone. Proc Natl Acad Sci U S A 2007;104:6382–7.ArticlePubMedPMC
- 37. Kim JM, Yang YS, Park KH, Oh H, Greenblatt MB, Shim JH. The ERK MAPK pathway is essential for skeletal development and homeostasis. Int J Mol Sci 2019;20:1803.ArticlePubMedPMC
- 38. Dinev D, Jordan BW, Neufeld B, Lee JD, Lindemann D, Rapp UR, et al. Extracellular signal regulated kinase 5 (ERK5) is required for the differentiation of muscle cells. EMBO Rep 2001;2:829–34.ArticlePubMedPMC
- 39. Carter EJ, Cosgrove RA, Gonzalez I, Eisemann JH, Lovett FA, Cobb LJ, et al. MEK5 and ERK5 are mediators of the pro-myogenic actions of IGF-2. J Cell Sci 2009;122(Pt 17):3104–12.ArticlePubMedPMC
- 40. Chen TH, Chen CY, Wen HC, Chang CC, Wang HD, Chuu CP, et al. YAP promotes myogenic differentiation via the MEK5-ERK5 pathway. FASEB J 2017;31:2963–72.ArticlePubMed
- 41. Wagner P, Chapurlat R, Ecochard R, Szulc P. Low muscle strength and mass is associated with the accelerated decline of bone microarchitecture at the distal radius in older men: the prospective STRAMBO study. J Bone Miner Res 2018;33:1630–40.ArticlePubMed
- 42. Nagafuchi A. Molecular architecture of adherens junctions. Curr Opin Cell Biol 2001;13:600–3.ArticlePubMed
- 43. Brembeck FH, Rosario M, Birchmeier W. Balancing cell adhesion and Wnt signaling, the key role of beta-catenin. Curr Opin Genet Dev 2006;16:51–9.ArticlePubMed
- 44. Del Mare S, Kurek KC, Stein GS, Lian JB, Aqeilan RI. Role of the WWOX tumor suppressor gene in bone homeostasis and the pathogenesis of osteosarcoma. Am J Cancer Res 2011;1:585–94.PubMedPMC
- 45. Kurek KC, Del Mare S, Salah Z, Abdeen S, Sadiq H, Lee SH, et al. Frequent attenuation of the WWOX tumor suppressor in osteosarcoma is associated with increased tumorigenicity and aberrant RUNX2 expression. Cancer Res 2010;70:5577–86.ArticlePubMedPMC
- 46. Leslie WD, Aubry-Rozier B, Lamy O, Hans D; Manitoba Bone Density Program. TBS (trabecular bone score) and diabetes-related fracture risk. J Clin Endocrinol Metab 2013;98:602–9.ArticlePubMed
- 47. Harvey NC, Gluer CC, Binkley N, McCloskey EV, Brandi ML, Cooper C, et al. Trabecular bone score (TBS) as a new complementary approach for osteoporosis evaluation in clinical practice. Bone 2015;78:216–24.ArticlePubMedPMC
 PubReader
 ePub Link
 Cite
Cite


