Articles
- Page Path
- HOME > Endocrinol Metab > Volume 38(6); 2023 > Article
-
Original ArticleCalcium & bone metabolism Age-Dependent Association of Height Loss with Incident Fracture Risk in Postmenopausal Korean Women
 Keypoint
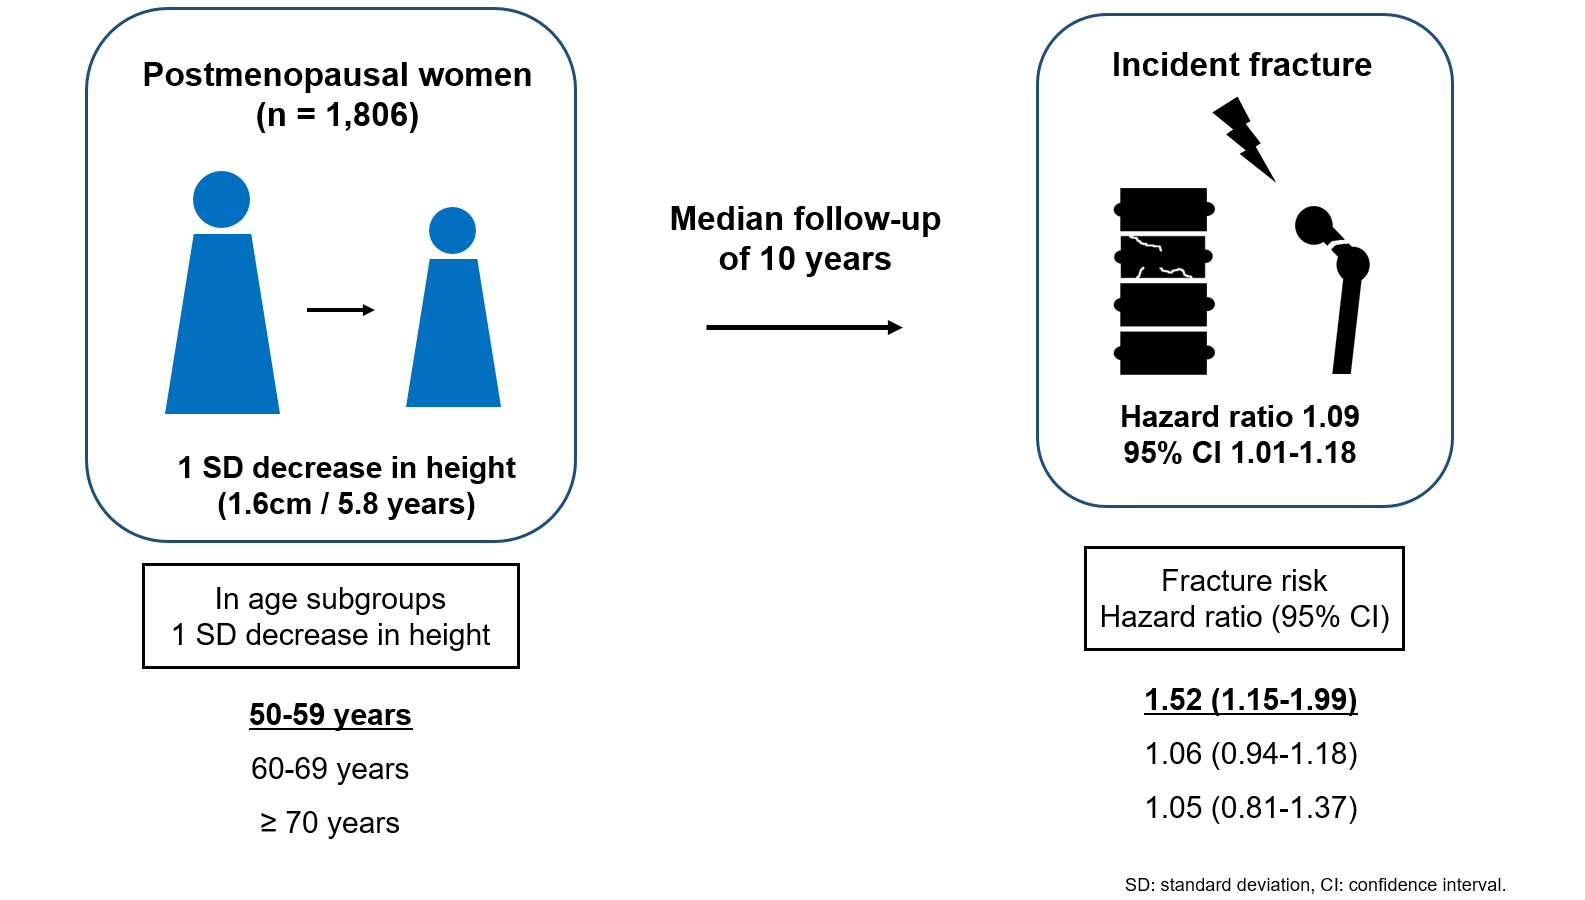
A study of postmenopausal Korean women from the Ansung cohort found that height loss over six years was associated with a higher 10-year fracture risk, especially in women aged 50 to 59. While a 1.6 cm decrease in height predicted a 9% increased overall fracture risk, this association was only significant in the 50 to 59 age group, but not in older age groups. -
Chaewon Lee1*
 , Hye-Sun Park2*, Yumie Rhee3, Namki Hong3
 -
Endocrinology and Metabolism 2023;38(6):669-678.
DOI: https://doi.org/10.3803/EnM.2023.1734
Published online: September 1, 2023
1Yonsei University College of Medicine, Seoul, Korea
2Department of Internal Medicine, Gangnam Severance Hospital, Yonsei University College of Medicine, Seoul, Korea
3Department of Internal Medicine, Severance Hospital, Endocrine Research Institute, Yonsei University College of Medicine, Seoul, Korea
- Corresponding author: Namki Hong. Department of Internal Medicine, Severance Hospital, Endocrine Research Institute, Yonsei University College of Medicine, 50-1 Yonsei-ro, Seodaemun-gu, Seoul 03722, Korea Tel: +82-2-2228-0790, Fax: +82-2-393-6884, E-mail: NKHONG84@yuhs.ac
- *These authors contributed equally to this work.
Copyright © 2023 Korean Endocrine Society
This is an Open Access article distributed under the terms of the Creative Commons Attribution Non-Commercial License (http://creativecommons.org/licenses/by-nc/4.0/) which permits unrestricted non-commercial use, distribution, and reproduction in any medium, provided the original work is properly cited.
- 1,501 Views
- 89 Download
ABSTRACT
-
Background
- Height loss is a simple clinical measure associated with increased fracture risk. However, limited data exists on the association between height loss and fracture risk in postmenopausal Korean women. It is unknown whether this association varies with age.
-
Methods
- Data on height loss over a 6-year period were collected from a community-based longitudinal follow-up cohort (Ansung cohort of the Korean Genome and Epidemiology Study). Incident fractures were defined based on self-reported fractures after excluding those due to severe trauma or toes/fingers. The association between incident fractures and height loss was investigated using a Cox proportional hazards model.
-
Results
- During a median follow-up of 10 years after the second visit, 259/1,806 participants (median age, 64 years) experienced incident fractures. Overall, a 1 standard deviation (SD) decrease in height (1.6 cm/median 5.8 years) was associated with 9% increased risk of fracture (hazard ratio [HR], 1.09; P=0.037), which lost statistical significance after adjustment for covariates. When stratified into age groups (50–59, 60–69, 70 years or older), a 1 SD decrease in height remained a robust predictor of fracture in the 50 to 59 years age group after adjusting for covariates (adjusted hazard ratio [aHR], 1.52; P=0.003), whereas height loss was not an independent predictor of fracture in the 60 to 69 (aHR, 1.06; P=0.333) or the 70 years or older age groups (aHR, 1.05; P=0.700; P for interaction <0.05, for all).
-
Conclusion
- Height loss during the previous 6 years was associated with an increased 10-year fracture risk in postmenopausal women in their 50s.
- Osteoporosis is a skeletal condition characterized by low bone mass and deteriorated bone microarchitecture [1]. Patients with osteoporosis are vulnerable to fragility fractures, even with minimal stress or low-energy trauma. Fragility fractures not only cause pain and disability, but also increase mortality. The mortality in the first year after hip fracture has been reported to be as high as 15% to 36% [2-4]. Patients with hip fracture have a three to four times higher mortality rate compared to the general population at 1 year after the fracture [5]. It subsequently results in a huge socioeconomic burden on patients and their families. Therefore, it is important to predict and select patients with high fracture risk.
- Height loss can occur because of vertebral fractures and physical aging [6,7]. Several studies investigated the association between height loss and skeletal health. Asahi et al. reported that height loss was associated with and a useful indicator of falls and sarcopenia [8]. Leslie et al. [9] further demonstrated that a 1 standard deviation (SD) increase in height loss during an average of 3.8 years was associated with a 1.12-fold higher risk of major osteoporotic fractures, independent of risk factors, including the fracture risk assessment tool (FRAX) score and bone mineral density (BMD).
- Age is one of the most powerful factors associated with fracture risk. Even with the same BMD, the fracture incidence significantly differs according to age [10]. Therefore, the risk factors for fractures might differ depending on the patient’s age. However, the association between height loss and risk of fracture according to age remains unclear. In this study, we explored the association between height loss and fracture risk and further studied whether the association differs depending on age.
INTRODUCTION
- Study participants
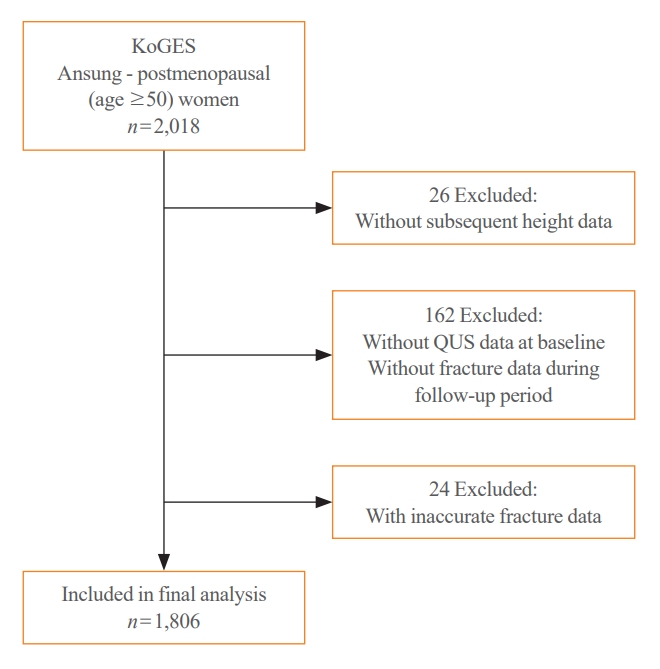
- Participants were recruited from the Korean Genome and Epidemiology Study (KoGES)–Ansan and Ansung cohorts. KoGES is a consortium project that aims to investigate the genetic and environmental etiologies of chronic diseases in Koreans and comprises six prospective cohorts [11]. The Ansan and Ansung cohort study was initiated in 2001 and included 10,030 Koreans aged 40 to 69 years. All investigations, screening, and blood sampling were conducted using standardized protocols by trained health professionals. A detailed description of the cohort data was provided previously [11]. For this study, data from postmenopausal women aged 50 years in the Ansung cohort were collected. Of the 2,018 postmenopausal women in Ansung, 26 without subsequent height data and 162 without quantitative ultrasonography data at baseline or fracture data during the follow-up period were excluded. After excluding 24 participants with inaccurate fracture data, the study included 1,806 postmenopausal women (Fig. 1). Visit 1 data were obtained from the 2001–2002 records, whereas visit 2 data were gathered from the 2005–2006 or 2007–2008 records. The participants were classified into three groups based on their age at visit 2: 50–59 (n=606), 60–69 (n=767), or ≥70 years (n=433). The timeline of this study is shown in Supplemental Fig. S1. All participants provided informed consent and this study was approved by the Institutional Review Board of Severance Hospital, Yonsei University Health System, Seoul, Korea (No. 4-2021-1613).
- Height and fracture data
- The participants’ heights were measured while they were barefoot or wearing thin socks, and recorded to one decimal place. To calculate height loss, the height measured at visit 1 (2001–2002) was subtracted from that measured at visit 2 (2005–2006 or 2007–2008). Estimated height loss over 6 years was determined by dividing the height loss by the follow-up period (in years) and multiplying it by 6 (years), which was the median follow-up period. This estimated value was regarded as a height loss over 6 years throughout the study. The degree of estimated height loss was categorized into three groups: <1, ≥1 to <2, and ≥2 cm. The categories were set based on the previous studies describing the general decline of height in postmenopausal women [12,13]. Self-reported fracture history included all fractures that had occurred prior to visit 2. After visit 2, the participants were followed-up biennially, and asked to report their new fracture events by answering a self-reported questionnaire during the follow-up period. The survey also collected information on the age at which the fracture occurred, fracture site, and cause of the fracture. Asymptomatic vertebral fractures were included, while high-trauma fractures (fractures resulting from accidents or falls from heights higher than standing height) and toe/finger fractures were excluded from the analysis.
- Bone measurements and clinical parameters
- Aligned with height measurements, data of clinical parameters including body weight, medical history, fracture history, and alcohol/smoking history were collected from visit 2. Body weight was measured with participants wearing light clothes, and body mass index (BMI) was obtained by dividing weight by the square of height. Participants who reported a diagnosis of degenerative or rheumatoid arthritis or were undergoing treatment for arthritis were considered to have arthritis. High alcohol intake was defined as the consumption of more than three glasses of alcohol per day (21 units or more per week), and one unit of alcohol was defined as one glass of soju. Based on self-reported questionnaires, smoking status was classified into three groups: nonsmokers, ex-smokers, and current smokers. High-sensitivity C-reactive protein (hsCRP) levels were measured using an immunoradiometric assay (ADVIA 1650, Siemens, Tarrytown, NY, USA).
- Data on bone ultrasonic speed-of-sound (SOS) were collected at visit 1 because of missing values at visit 2. Measurements were taken at the midpoint between the patella and medial malleolus of the less frequently used leg using quantitative ultrasound (Omnisense 7000s, Sunlight Medical Ltd., Petah Tivka, Israel). Three or more measurements were taken to reduce errors, and the mean value was recorded. The FRAX score for major osteoporotic and hip fractures was obtained without BMD because the cohort did not include BMD data obtained by dual-energy X-ray absorptiometry (DXA).
- Statistical analysis
- The baseline characteristics were presented as mean±SD for continuous variables with normal distribution, and median (interquartile range [IQR]) for continuous variables with non-normal distribution. Categorical variables were presented as numbers (%). One-way analysis of variance (ANOVA), Kruskal–Wallis, and chi-squared tests were used to compare the characteristics by age subgroups (50–59, 60–69, and ≥70 years). Cox proportional hazards models were used to determine the relationship between height loss and fractures. Height loss over 6 years was included as a categorical (<1, ≥1 to <2, and ≥2 cm) or continuous variables. The models were initially adjusted for age and BMI and then sequentially adjusted for FRAX for major osteoporotic fractures, SOS at the midshaft tibia, and FRAX scores with SOS for the midshaft tibia. Additionally, to investigate whether the association between height loss and the risk of fracture varied by age, an interaction term between height loss over 6 years and age groups was added to each Cox proportional hazards model. Kaplan–Meier curves were plotted for the overall age group and each age subgroup. Statistical significance was set at P<0.05. Statistical analyses were conducted using the R Statistical Software version 4.2.2 (R Foundation for Statistical Computing, Vienna, Austria).
METHODS
- Baseline characteristics
- Baseline characteristics of the 1,806 women are shown in Table 1. The median age of the participants was 64.0 years (IQR, 56.0 to 69.0). Their median height, weight, and BMI were 151.7 cm (IQR, 148.0 to 155.6), 56.8 kg (IQR, 51.3 to 62.2), and 24.5 kg/m2 (IQR, 22.6 to 26.8), respectively. The median height change over a 6-year period was –0.4 cm (IQR, –1.1 to 0.2), and the mean value of SOS at the midshaft tibia was 3,800.8±160.6 m/sec. Among the participants, 137 (7.6%) reported one or more previous fractures, and 14 of them specifically reported previous vertebral fractures. The 10-year probability of major osteoporotic fracture and hip fracture, calculated by FRAX was 5.3% and 1.0%, respectively.
- When participants were grouped by age, 33.6% were in their 50s, 42.5% were in their 60s, and 24% were aged 70 years or older (Supplemental Table S1). Compared with younger participants, older participants had greater height loss, elevated hsCRP levels, and an increased risk of major osteoporotic and hip fractures, as calculated by FRAX. Additionally, a higher proportion of participants in the older age group were current smokers with arthritis. Furthermore, lower height, weight, and SOS values of the midshaft tibia were observed in the older group.
- Height loss and risk of fracture in overall group
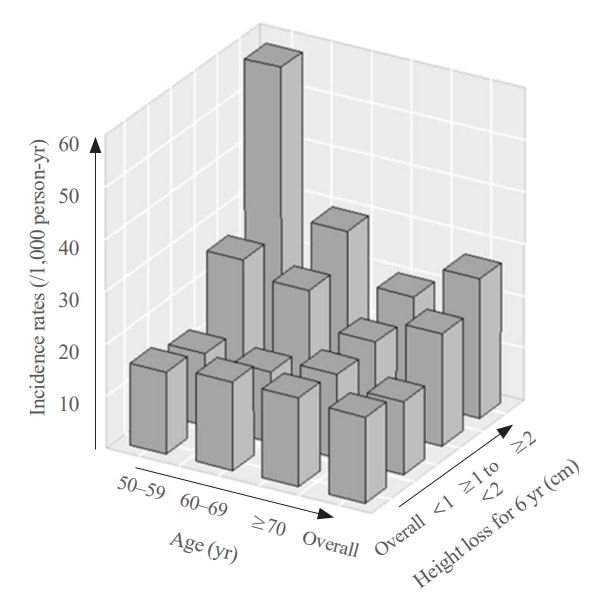
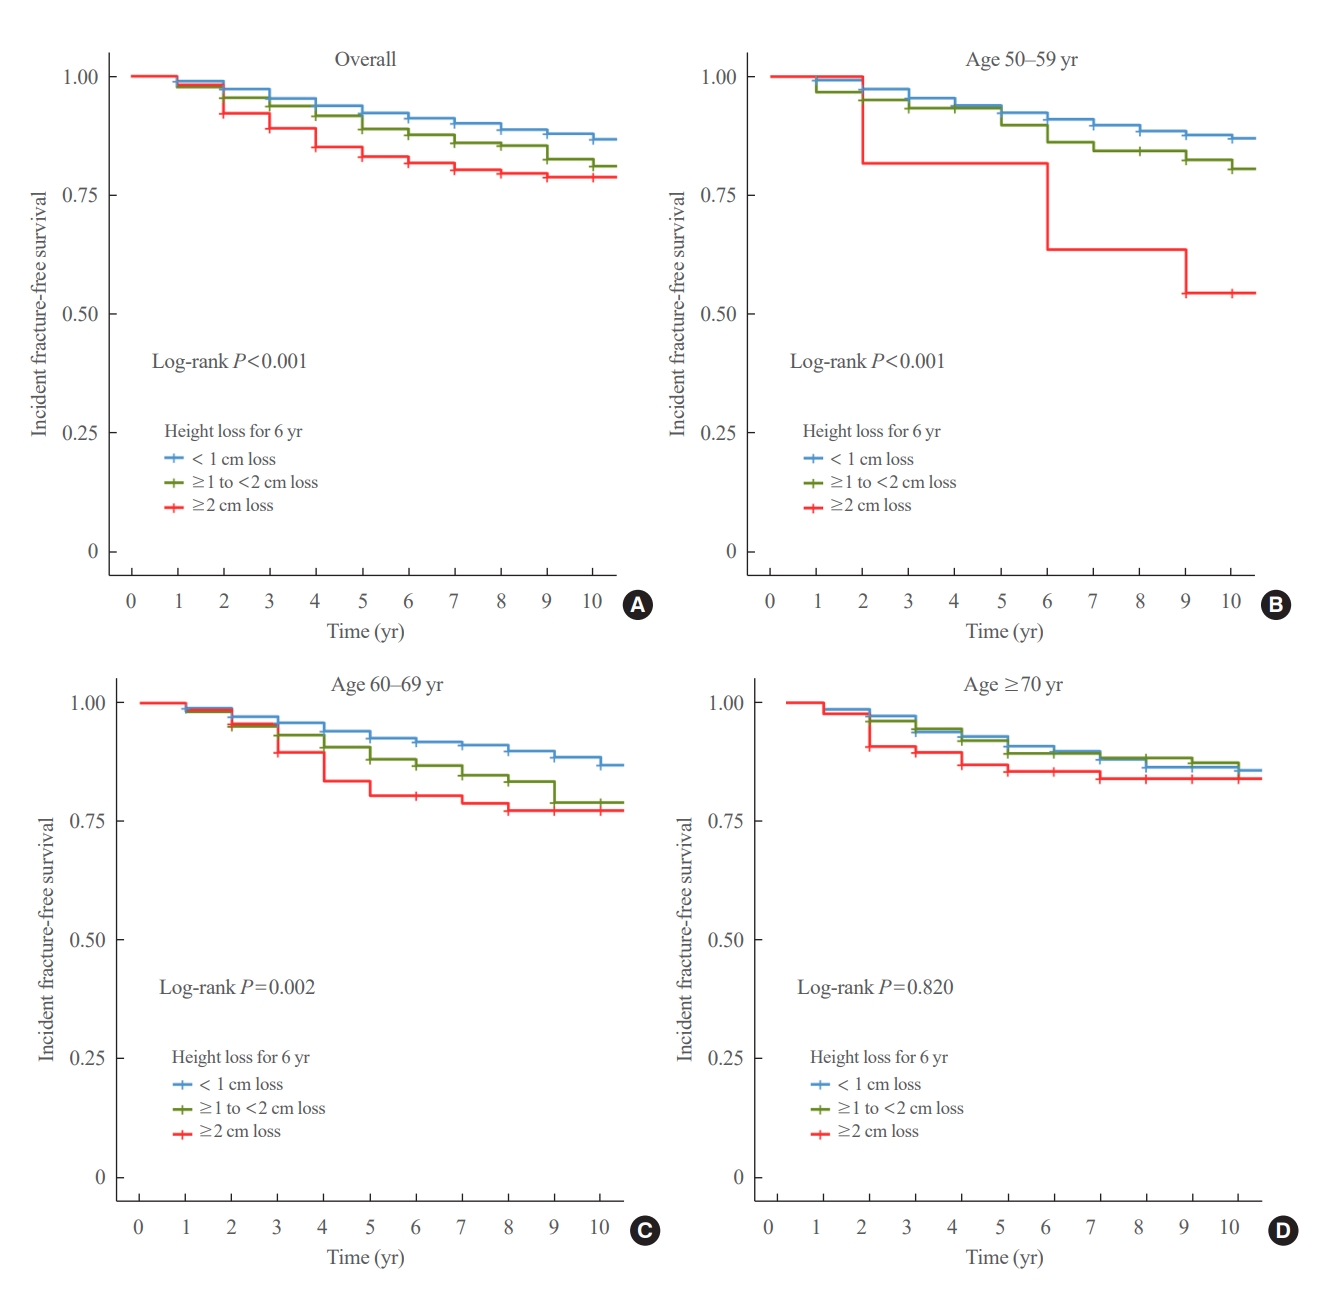
- During a median follow-up of 10 years after visit 2, 259 fractures were reported. The median height loss over a 6-year period was 0.6 cm for people with new fractures and 0.4 cm for people without new fractures. Height loss over a 6-year period was categorized into three groups (<1, ≥1 to <2, and ≥2 cm). The number of participants in each height loss group were 1,283, 356, and 167 individuals, respectively. The fracture incidence rates for each group were 14.0, 21.7, and 26.9 per 1,000 person-years, respectively, with a higher incidence rate in the group with large height loss (Fig. 2). Kaplan–Meier curves and log-rank tests showed significant differences in the risk of fracture between the height loss groups (Fig. 3A).
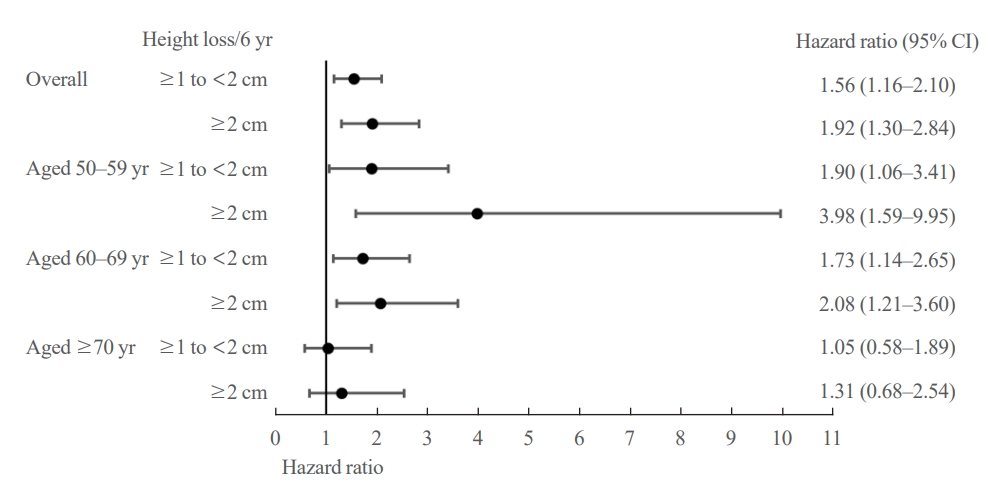
- The difference in fracture risk between the height loss groups was confirmed using a Cox regression model. As shown in Fig. 4, participants with a height loss of ≥1 to <2 cm over the 6-year period had a significantly higher risk of fracture than those with a height loss of <1 cm after 10 years after adjusting for age, BMI, and SOS at the midshaft tibia (adjusted hazard ratio [aHR], 1.56; 95% confidence interval [CI], 1.16 to 2.10). The risk was even higher in participants with height loss of ≥2 cm over the 6-year period than those with a height loss of <1 cm after adjusting covariates (aHR, 1.92; 95% CI, 1.30 to 2.84). The elevated risk of fracture in groups with a height loss of ≥1 to <2 and ≥2 cm compared with those with a height loss of <1 cm was consistent throughout all models (Supplemental Table S2).
- Additionally, height loss was included as a continuous variable in the Cox regression model to demonstrate the association between height loss and fractures (Table 2). Without adjustment (model 1), a 1 SD decrease in height (1.6 cm) was significantly associated with an increased risk of fracture (hazard ratio [HR], 1.09; 95% CI, 1.01 to 1.18). However, after adjusting for covariates such as age, BMI, FRAX score, and SOS in the midshaft tibia, this association was no longer statistically significant.
- To exclude the effects of previous fractures, we performed the same analysis after excluding participants with a history of fractures (Supplemental Tables S3, S4). Similar results were obtained for the Cox model with 1,669 participants. In participants without a previous fracture history, those with height loss of ≥1 to <2 or ≥2 cm had a significantly increased risk of fracture compared to those with height loss of <1 cm (aHR, 1.50; 95% CI, 1.09 to 2.07 and aHR, 2.05; 95% CI, 1.35 to 3.1, respectively) (Supplemental Table S3). A 1 SD decrease in height was associated with a 9% increase in the risk of fracture, but the association was not statistically significant (HR, 1.09; 95% CI, 1.00 to 1.18) (Supplemental Table S3).
- Subgroup analysis
- The participants were divided into three age groups (50–59 [n=606], 60–69 [n=767], and 70 years or older [n=433]). In each age subgroup, the incidence of fracture was assessed based on the degree of height loss. Among participants aged 70 years, the rates were 16.1, 16.9, and 20.2 per 1,000 person-years for the height loss groups of <1, ≥1 to <2, and ≥2 cm, respectively. The 60 to 69 age group had rates of 13.5, 23.7, and 29.7 per 1,000 person-years, while the 50 to 59 age group had the highest incidence rates of 13.8, 26.5, and 58.1 per 1,000 person-years for the height loss groups of <1, ≥1 to <2, and ≥2 cm, respectively, showing a significant difference (Fig. 2). The Kaplan–Meier curves demonstrated that the fracture risk of the ≥2 cm height loss group was high in all age subgroups (Fig. 3). The difference in survival probability according to height loss was statistically significant in the 50–59 and 60–69 years age groups (log-rank P<0.001 and log-rank P=0.002, respectively).
- Participants with height loss of 1≥ to 2 or ≥2 cm were at a higher risk of fracture compared to those with height loss of <1 cm and this remained significant in the 50–59 and 60–69 years age groups (Fig. 4). Of note, participants aged 50 to 59 years with height loss of ≥2 cm were at 3.9-fold higher risk of fracture compared to those with height loss of <1 cm after adjusting for age, BMI, and SOS at the midshaft tibia (aHR, 3.98; 95% CI, 1.59 to 9.95) (Fig. 4). However, this association was not significant in the 70 years or older age group. This age-dependent association was consistent throughout the study period (Supplemental Table S2). When height loss was included as a continuous variable in the Cox model, a 1 SD decrease in height was significantly associated with fracture in the 50 to 59 years age group after adjusting for all covariates (aHR, 1.52; 95% CI, 1.15 to 1.99; P=0.003) (Table 2). However, this association was not robust in the 60 to 69 years age group (aHR, 1.06; 95% CI, 0.94 to 1.18; P=0.333) or in the 70 years or older age group (aHR, 1.05; 95% CI, 0.81 to 1.37; P=0.700) (Table 2).
- After excluding participants with previous fracture history, the risk of fracture in participants with height loss of 1≥ to 2 cm compared to those with height loss of <1 cm was slightly attenuated in both the 50–59 and 60–69 years age groups (aHR, 1.81; 95% CI, 0.97 to 3.37 and aHR, 1.60; 95% CI, 1.00 to 2.55) (Supplemental Table S3). However, the risk of fracture in participants with height loss of ≥2 cm compared to those with height loss of <1 cm remained significant (aHR, 4.19; 95% CI, 1.67 to 10.51 and aHR, 2.32; 95% CI, 1.30 to 4.17, age group of 50–59 and 60–69 years, respectively) (Supplemental Table S3). When height loss was included as a continuous variable in the Cox model, exclusion of participants with previous fractures did not significantly alter the results of the analysis (aHR, 1.56; 95% CI, 1.17 to 2.08 in the 50 to 59 years age group) (Supplemental Table S4).
RESULTS
- Significant strides have been made in the treatment of osteoporosis, which has led to a notable reduction in fracture risk. However, current methods for predicting fractures remain primarily limited to BMD, the FRAX score, or a few clinical factors, such as fracture history [14]. Although the diagnosis of osteoporosis mostly relies on BMD, fractures can arise from various contributing factors [15,16]. Current prediction tools, such as FRAX, include several risk factors such as steroid, family, and smoking history [17]. Despite efforts to incorporate multiple risk factors into prediction tools, some clinically significant risk factors may still be overlooked.
- Height loss is often regarded as a result of vertebral fractures and has been suggested as an indicator of incidental vertebral fractures [18-20]. This study aimed to investigate whether height loss was associated with fracture risk. The results showed that a height loss >2 cm was associated with a 1.99-fold increased risk of fracture, and in those aged 50 to 59 years, the risk increased to 3.90 times. These results were statistically significant, even after adjusting for covariates.
- Previous studies have also reported an increased risk of fractures in participants with height loss [9,21-23]. In a study by Moayyeri et al. [22], annual height loss of >0.5 cm was related with a 1.76-fold increased risk of hip and any fracture. Furthermore, in a study of 1,735 postmenopausal women over the age of 55 years in Southern Poland, a height loss of 3 to 4 cm was suggested as an indicator of increased fracture risk [23]. Despite these findings, some studies have failed to confirm an association between height loss and fractures or osteoporosis. In a study by Center et al. [24], the height loss was not significantly associated with hip fracture risk in women (odds ratio, 1.1; 95% CI, 0.9 to 1.5). Furthermore, height loss was not found to be associated with femoral neck BMD or lumbar spine BMD in Korean women (β±standard error [SE], –2.0±1.6, P=0.213; and β±SE=–1.3±1.0, P=0.222, femoral neck and lumbar spine, respectively) [25]. Given the mixed findings of previous studies, we assumed that an analysis by age group could provide more accurate information on the association between height loss and osteoporotic fractures. Previous studies included middle-aged or older participants; however, the potential influence of age on the relationship between height loss and osteoporotic fractures has not been extensively evaluated.
- In this study, participants were classified by age: 50–59, 60– 69, and 70 years or older. The association between height loss and fracture risk was more robust in the middle-aged group (age 50 to 59) compared to the older age groups (aged 60 to 69 and 70 years or older). This could be attributed to age-related height loss [26]. Height loss may occur with age, even without vertebral fractures [27]. Several factors, including spinal osteoarthritis, degenerative lumbar scoliosis, intervertebral disc degeneration, and lack of physical activity, may result in height loss in older adults [28]. Because this change is common in older adults and the fracture risk is already high in this age group, height loss alone cannot be a significant risk factor for fracture and merely reflects changes that occur with aging. In contrast, height loss is generally not expected to occur in middle-aged individuals; thus, it may be directly associated with fracture risk. Therefore, height loss may be a better predictor of fracture risk in middle-aged than in older adult populations.
- It is also important to note that height loss can be a consequence of preexisting fractures, which could complicate its use as a reliable predictor of future fractures [18]. To address this potential confounding factor, we conducted an additional analysis by excluding participants with a history of fractures. Although the HR was attenuated in certain age/height loss groups, we observed similar findings in patients without a history of fracture. This approach enabled us to confirm the results of the initial analyses. Our results suggest that height loss may be a useful indicator of fracture risk independent of prior fracture.
- We believe that our findings can be incorporated into clinical practice to help identify patients at a high risk of fracture. Although BMD is believed to be the single most powerful predictor of fracture, DXA is often unreliable in patients with degenerative changes or aortic calcification [29]. Additionally, the results might be unreliable without proper quality control of DXA scans and precision tests by radiotechnologists [30]. Quantitative computed tomography is a volumetric method that can overcome the limitations of DXA; however, it has higher radiation doses, less proven fracture prediction, and is less widely available [31]. Height loss is a measurable indicator used to assess the fracture risk. It is worth noting that while previous studies have suggested that height loss of >3 to 4 cm could be predictive of fracture risk [23,32], in this study, even a height loss of only ≥1 cm was associated with increased risk of fracture. There are two possible explanations for this observation. First, it could be attributed to ethnic differences, as previous studies included Western populations, who tend to be taller than Asians. Since our study population comprised Koreans with a shorter average height, smaller height loss may still be linked to fracture risk. Second, a height loss greater than 4 cm, as noted in previous studies, could indicate the presence of an existing fracture. In light of our study, it may be appropriate to consider a height loss of ≥1 cm as a potential risk factor for future fractures, rather than overlooking it, especially in Asians.
- Our study had several limitations. First, only participants who were able to visit the examination center were included in the cohort, potentially leading to a healthy volunteer selection bias. Additionally, the Ansung cohort only surveyed residents aged 40 to 69 at visit 1, resulting in a smaller number of older adult participants. Therefore, a large-scale study with a more diverse population is required to confirm our findings. Second, although the height measurements were conducted by trained staff and mostly taken in the morning to minimize errors, we recognize that certain factors such as diurnal variation and occupational activities may still introduce some measurement errors. It would be beneficial for future studies to incorporate protocols specifically designed to minimize these potential sources of measurement errors. Third, the responses regarding fractures were self-reported, which could have resulted in the underreporting of some fractures. Participants may not have been aware of asymptomatic vertebral fractures, or may have forgotten about fractures that were previously treated. Moreover, some fractures may have been misclassified as non-fractures or excluded from the analysis because of insufficient information. Finally, the FRAX score was calculated without BMD, as assessed by DXA. However, previous studies have shown that the fracture predictive ability of FRAX without BMD is comparable to that of FRAX with BMD [33,34].
- In conclusion, our study suggests that height loss is a significant risk factor for fractures in postmenopausal Korean women, especially those in the 50 to 59 years age group. Our findings highlight the importance of monitoring height loss as a potential marker for fracture risk, particularly in middle-aged women. Age was found to be an effect modifier of this relationship, with the association being more pronounced in younger postmenopausal women. We believe that our findings contribute to the growing body of evidence regarding the association between height loss and fractures. Further research is needed to confirm these findings and identify the underlying mechanisms of height loss and fracture risk in postmenopausal women.
DISCUSSION
Supplementary Material
Supplemental Table S1.
Supplemental Table S2.
Supplemental Table S3.
Supplemental Table S4.
-
CONFLICTS OF INTEREST
No potential conflict of interest relevant to this article was reported
-
AUTHOR CONTRIBUTIONS
Conception or design: C.L., Y.R., N.H. Acquisition, analysis, or interpretation of data: C.L., H.S.P., N.H. Drafting the work or revising: C.L., H.S.P., N.H. Final approval of the manuscript: C.L., H.S.P., Y.R., N.H.
Article information
-
Acknowledgements
- Data used in this study were obtained from the Korean Genome and Epidemiology Study (KoGES; 4851-302), National Institute of Health, Korea Disease Control and Prevention Agency, Republic of Korea.


Model 1=unadjusted; Model 2=adjusted for age and body mass index (BMI); Model 3=adjusted for fracture risk assessment tool (FRAX) for major osteoporotic fracture; Model 4=adjusted for age, BMI, and speed-of-sound (SOS) at midshaft tibia; Model 5=adjusted for FRAX for major osteoporotic fracture and SOS at midshaft tibia.
SD, standard deviation; HR, hazard ratio; CI, confidence interval.
- 1. Baek YH, Cho SW, Jeong HE, Kim JH, Hwang Y, Lange JL, et al. 10-Year fracture risk in postmenopausal women with osteopenia and osteoporosis in South Korea. Endocrinol Metab (Seoul) 2021;36:1178–88.ArticlePubMedPMCPDF
- 2. Civinini R, Paoli T, Cianferotti L, Cartei A, Boccaccini A, Peris A, et al. Functional outcomes and mortality in geriatric and fragility hip fractures-results of an integrated, multidisciplinary model experienced by the “Florence hip fracture unit”. Int Orthop 2019;43:187–92.ArticlePubMedPDF
- 3. Mariconda M, Costa GG, Cerbasi S, Recano P, Aitanti E, Gambacorta M, et al. The determinants of mortality and morbidity during the year following fracture of the hip: a prospective study. Bone Joint J 2015;97-B:383–90.PubMed
- 4. Lee TC, Ho PS, Lin HT, Ho ML, Huang HT, Chang JK. One-year readmission risk and mortality after hip fracture surgery: a national population-based study in Taiwan. Aging Dis 2017;8:402–9.ArticlePubMedPMC
- 5. Dubljanin-Raspopovic E, Markovic-Denic L, Marinkovic J, Nedeljkovic U, Bumbasirevic M. Does early functional outcome predict 1-year mortality in elderly patients with hip fracture? Clin Orthop Relat Res 2013;471:2703–10.ArticlePubMedPMC
- 6. Yoshimura N, Kinoshita H, Takijiri T, Oka H, Muraki S, Mabuchi A, et al. Association between height loss and bone loss, cumulative incidence of vertebral fractures and future quality of life: the Miyama study. Osteoporos Int 2008;19:21–8.ArticlePubMedPDF
- 7. Yeoum SG, Lee JH. Usefulness of estimated height loss for detection of osteoporosis in women. J Korean Acad Nurs 2011;41:758–67.ArticlePubMed
- 8. Asahi R, Yuguchi S, Kamo T, Azami M, Ogihara H, Asano S. Association of height loss with falls and sarcopenia in community-dwelling older women. Osteoporos Sarcopenia 2020;6:59–64.ArticlePubMedPMC
- 9. Leslie WD, Schousboe JT, Morin SN, Martineau P, Lix LM, Johansson H, et al. Measured height loss predicts incident clinical fractures independently from FRAX: a registry-based cohort study. Osteoporos Int 2020;31:1079–87.ArticlePubMedPDF
- 10. Schuit SC, van der Klift M, Weel AE, de Laet CE, Burger H, Seeman E, et al. Fracture incidence and association with bone mineral density in elderly men and women: the Rotterdam Study. Bone 2004;34:195–202.ArticlePubMed
- 11. Kim Y, Han BG; KoGES group. Cohort profile: the Korean Genome and Epidemiology Study (KoGES) Consortium. Int J Epidemiol 2017;46:1350.ArticlePubMedPMC
- 12. Sorkin JD, Muller DC, Andres R. Longitudinal change in height of men and women: implications for interpretation of the body mass index: the Baltimore Longitudinal Study of Aging. Am J Epidemiol 1999;150:969–77.ArticlePubMed
- 13. Son IH, Han YH, Hyun T. Changes in weight, waist circumference, prevalence of obesity, and dietary factors associated with weight gain over 8 years in Korean adults: longitudinal data from the Korean Genome and Epidemiology Study. J Nutr Health 2017;50:336–49.ArticlePDF
- 14. Kanis JA, Harvey NC, Johansson H, Oden A, McCloskey EV, Leslie WD. Overview of fracture prediction tools. J Clin Densitom 2017;20:444–50.ArticlePubMedPMC
- 15. Blake GM, Fogelman I. The clinical role of dual energy X-ray absorptiometry. Eur J Radiol 2009;71:406–14.ArticlePubMed
- 16. Marshall D, Johnell O, Wedel H. Meta-analysis of how well measures of bone mineral density predict occurrence of osteoporotic fractures. BMJ 1996;312:1254–9.ArticlePubMedPMC
- 17. Kanis JA, Johansson H, Harvey NC, McCloskey EV. A brief history of FRAX. Arch Osteoporos 2018;13:118.ArticlePubMedPMCPDF
- 18. Siminoski K, Jiang G, Adachi JD, Hanley DA, Cline G, Ioannidis G, et al. Accuracy of height loss during prospective monitoring for detection of incident vertebral fractures. Osteoporos Int 2005;16:403–10.ArticlePubMedPDF
- 19. Xu W, Perera S, Medich D, Fiorito G, Wagner J, Berger LK, et al. Height loss, vertebral fractures, and the misclassification of osteoporosis. Bone 2011;48:307–11.ArticlePubMedPMC
- 20. Mikula AL, Hetzel SJ, Binkley N, Anderson PA. Validity of height loss as a predictor for prevalent vertebral fractures, low bone mineral density, and vitamin D deficiency. Osteoporos Int 2017;28:1659–65.ArticlePubMedPDF
- 21. Hillier TA, Lui LY, Kado DM, LeBlanc ES, Vesco KK, Bauer DC, et al. Height loss in older women: risk of hip fracture and mortality independent of vertebral fractures. J Bone Miner Res 2012;27:153–9.ArticlePubMedPMC
- 22. Moayyeri A, Luben RN, Bingham SA, Welch AA, Wareham NJ, Khaw KT. Measured height loss predicts fractures in middle-aged and older men and women: the EPIC-Norfolk prospective population study. J Bone Miner Res 2008;23:425–32.ArticlePubMed
- 23. Pluskiewicz W, Adamczyk P, Drozdzowska B. Height loss in postmenopausal women-do we need more for fracture risk assessment?: results from the GO Study. Osteoporos Int 2021;32:2043–9.ArticlePubMedPMCPDF
- 24. Center JR, Nguyen TV, Pocock NA, Noakes KA, Kelly PJ, Eisman JA, et al. Femoral neck axis length, height loss and risk of hip fracture in males and females. Osteoporos Int 1998;8:75–81.ArticlePubMedPDF
- 25. Ahn KS, Kang CH, Cho SB, Cho KH, Han KD, Park YG, et al. Height loss was associated with osteoporosis in Korean elderly men, not in women: the Korea National Health and Nutrition Examination Survey 2008-2010. J Clin Densitom 2019;22:59–66.ArticlePubMed
- 26. Ji S, Lee E, Kim BJ, Baek JY, Yi Y, Jang IY, et al. Height loss as an indicator of ageing through its association with frailty and sarcopenia: an observational cohort study. Arch Gerontol Geriatr 2023;110:104916.ArticlePubMed
- 27. Peter RS, Fromm E, Klenk J, Concin H, Nagel G. Change in height, weight, and body mass index: longitudinal data from Austria. Am J Hum Biol 2014;26:690–6.PubMed
- 28. Galbusera F, van Rijsbergen M, Ito K, Huyghe JM, Brayda-Bruno M, Wilke HJ. Ageing and degenerative changes of the intervertebral disc and their impact on spinal flexibility. Eur Spine J 2014;23 Suppl 3:S324–32.ArticlePubMedPDF
- 29. Kinoshita H, Tamaki T, Hashimoto T, Kasagi F. Factors influencing lumbar spine bone mineral density assessment by dual-energy X-ray absorptiometry: comparison with lumbar spinal radiogram. J Orthop Sci 1998;3:3–9.ArticlePubMed
- 30. Kim HS, Yang SO. Quality control of DXA system and precision test of radio-technologists. J Bone Metab 2014;21:2–7.ArticlePubMedPMC
- 31. Link TM, Lang TF. Axial QCT: clinical applications and new developments. J Clin Densitom 2014;17:438–48.ArticlePubMed
- 32. Ensrud KE, Schousboe JT, Kats AM, Vo TN, Taylor BC, Cawthon PM, et al. Height loss in old age and fracture risk among men in late life: a prospective cohort study. J Bone Miner Res 2021;36:1069–76.ArticlePubMedPMCPDF
- 33. Gadam RK, Schlauch K, Izuora KE. Frax prediction without BMD for assessment of osteoporotic fracture risk. Endocr Pract 2013;19:780–4.ArticlePubMedPMC
- 34. Kanis JA, McCloskey E, Johansson H, Oden A, Leslie WD. FRAX(®) with and without bone mineral density. Calcif Tissue Int 2012;90:1–13.ArticlePubMedPDF
 PubReader
 ePub Link
 Cite
Cite