The Role of Circulating Slit2, the One of the Newly Batokines, in Human Diabetes Mellitus
Article information

Abstract
Background
Slit2 is a new secreted protein from adipose tissue that improves glucose hemostasis in mice; however, there is no study about the serum levels and precise role of Slit2 in human. The aim of this study is to explore the serum level of Slit2 in human, and to identify the role of Slit2 in diabetes mellitus (DM).
Methods
The participants of this study consist of 38 subjects with newly diagnosed DM, and 75 healthy subjects as a control group. Serum Slit2 levels were measured using an enzyme-linked immunosorbent assay. Relationship between circulating Slit2 and diabetic related factors was investigated in diabetic group compared with non-diabetic group. Additionally, the correlations between the serum level of Slit2 and diverse metabolic parameters were analyzed.
Results
Circulating Slit2 level was more decreased in diabetic group than in control group, but there was no significant difference statistically. Interestingly, serum levels of Slit2 were significantly negatively correlated to the serum concentrations of fasting glucose (coefficient r=–0.246, P=0.008), the serum concentrations of postprandial glucose (coefficient r=–0.233, P=0.017), and glycosylated hemoglobin (HbA1c; coefficient r=–0.357, P<0.001).
Conclusion
From our study, the first report of circulating Slit2 levels in human, circulating Slit2 level significantly negatively correlated with serum glucose and HbA1c. Our results suggest that the circulating Slit2 may play a role in maintainence of glucose homeostasis in human, even though exact contribution and mechanism are not yet known.
INTRODUCTION
Recent experimental studies have revealed the association of brown adipose tissue (BAT) activity with prevention against metabolic disease, such as type 2 diabetes mellitus (T2DM), obesity and dyslipidemia [1]. BAT is traditionally known for consuming energy in response to cold [2], but also has a secretory role, which contribute to protection against chronic inflammation for thermogenesis, and the BAT-derived endocrine regulatory factors called batokines [13]. Slit2, a newly discovered batokines, was identified as a member of family of Slit homolog proteins, which are produced endogenously by beige fat cells under the control of cold exposure and PR domain containing 16 (PRDM16) [4]. Slits are known to have the role in axon guidance [56], and recently Svensson et al. [4] described the role of Slit2 in regulating glucose homeostasis in adipose tissue. C-terminal fragments of Slit2 are the active fragments in the regulation of beige adipocyte induction [4]. Additionally, increased circulating Slit2-C can promote thermogenesis of adipose tissue, increase energy expenditure, and improve glucose homeostasis in obese mice [4]. Although expression of Slit2 protein in adipose tissue may be linked to activate a thermogenic protein kinase A pathway in vivo [4], the role of Slit2 in human is not yet fully understood, and circulating Slit2 has not been studied. For these reasons, the aim of our study was to investigate the relationship between circulating Slit2 levels and several metabolic parameters in participants with newly diagnosed T2DM and control participants.
METHODS
Subjects
We studied a total of 45 participants with newly diagnosed T2DM and 78 control participants from the outpatient clinic of the Division of Endocrinology and Metabolism of Chungnam National University Hospital from January 2015 to July 2016 were studied. The inclusion criteria were as follows: body mass index (BMI) >18.0 kg/m2, age >18 years, absence of any clinical sign of infection or inflammation, no alcohol or drug abuse, systolic blood pressure (SBP) less than 140 mm Hg and diastolic blood pressure (DBP) less than 100 mm Hg, no pregnancy and no previous history of diabetes mellitus. Ten participants were excluded because of liver cirrhosis (one case), malignancies (five cases of thyroid cancer, one case of prostate cancer, and one case of pituitary adenoma), severe rheumatoid arthritis (one case), and low BMI 16.2 kg/m2 (one case). Finally, 113 participants were assessed to diabetes mellitus status [7]. Our experimental protocol was performed in accordance with the Declaration of Helsinki [8].
Clinical parameters
On the day on which the study commenced, all participants underwent physical examinations. Height, body weight, waist circumference (WC), SBP, and DBP were recorded [9]. Blood pressure were measured after 10 minutes of rest from each patient's right arm in the seating position by using an Omron IntelliSense Automatic Blood Pressure Monitor (Omron, Kyoto, Japan) height and body weight were measured without shoes in the morning. BMI was calculated as weight in kilograms (kg) divided by height in meters squared (m2), and WC was measured midway between the superior iliac spine at the end of gentle expiration and the lower rib margin in a standing position.
Biochemical parameters measurements
All blood samples were collected in the morning after an overnight fast of more than 8 hours into tubes containing ethylenediaminetetraacetic acid (EDTA) [9]. We measured the levels of fasting glucose, C-peptide, insulin, triglycerides, total cholesterol (TC), low density lipoprotein cholesterol (LDL-C), high density lipoprotein cholesterol (HDL-C), apolipoprotein B, aspartate aminotransferase, alanine aminotransferase, blood urea nitrogen, creatinine, high-sensitivity C-reactive protein (hs-CRP), and glycosylated hemoglobin (HbA1c). Blood chemistry and lipid profiles were measured using a blood chemistry analyzer (Hitachi 747, Hitachi, Tokyo, Japan). HbA1c was measured by high-performance liquid chromatography (Bio-Rad, Hercules, CA, USA). Insulin and C-peptide were measured by radioimmunoassay (Roche, Penzberg, Germany). We also performed the 75-g oral glucose tolerance test. The homeostasis model assessment of insulin resistance (HOMA-IR) was calculated as follows: fasting insulin level (µU/mL)×fasting glucose level (in mmol/L)/22.5 and the homeostasis model assessment of β-cell index (HOMA-β) was calculated as follows: fasting insulin level (µU/mL)×20/fasting glucose level (in mmol/L)–3.5 [89].
Slit2 measurements
Serum Slit2 levels were measured using a quantitative sandwich enzyme-linked immunosorbent assay (ELISA) kit (LifeSpan BioSceinces Inc., Seattle, WA, USA; ELISA kit for human Slit2, catalog No. LS-F21017). The ELISA quantitatively immunoassayed human Slit2 levels. The intra-assay coefficient of variation (CV) of the ELISA kit was <10% and the inter-assay CV of the ELISA Kit was <10%.
Statistical analysis
Continuous variables are expressed as the mean±standard deviation (SD), and the significance of between-group differences was evaluated using Student t test or the Mann-Whitney U test. Categorical variables are expressed as percentages, and between-group differences were compared with the chi-sqaure test. To evaluate associations between Slit2 level and other variables, we subjected the data to Pearson and partial correlation analyses. A two-tailed P value <0.05 was regarded as statistically significant. All statistical analyses were performed with SPSS version 21.0 (IBM Co., Armonk, NY, USA) [89].
Ethics statement
The protocol for this research was approved by the Institutional Review Board of Chungnam National University Hospital (Reg. No. CNUH 2014-12-013).
RESULTS
Clinical and biochemical characteristics of study subjects
Baseline characteristics of the subjects are shown in Table 1. Totally, 113 participants (mean age 49.6±12.2 years, 43.4% male) completed this study. The mean BMI, WC, serum glucose, and HOMA-IR values were 24.9±4.1 kg/m2, 85.3±11.3 cm, 125.1±54.3 mg/dL, and 3.24±1.99 mg/dL, respectively. The T2DM group had significantly higher levels of fasting glucose, fasting C-peptide, postprandial glucose, HOMA-IR, hemoglobin, DBP, hs-CRP, and apolipoprotein B than did those without diabetes. The T2DM group also had lower levels of HOMA-β. Circulating Slit2 level values in the diabetic group were 1.855±1.306 ng/dL, and values in the control group were 2.352±1.864 ng/dL. Serum Slit2 levels were lower in the diabetic group than in the control group, but there was no significally significant difference.

Characteristics of Study Population
Associations between serum Slit2 level and various variables
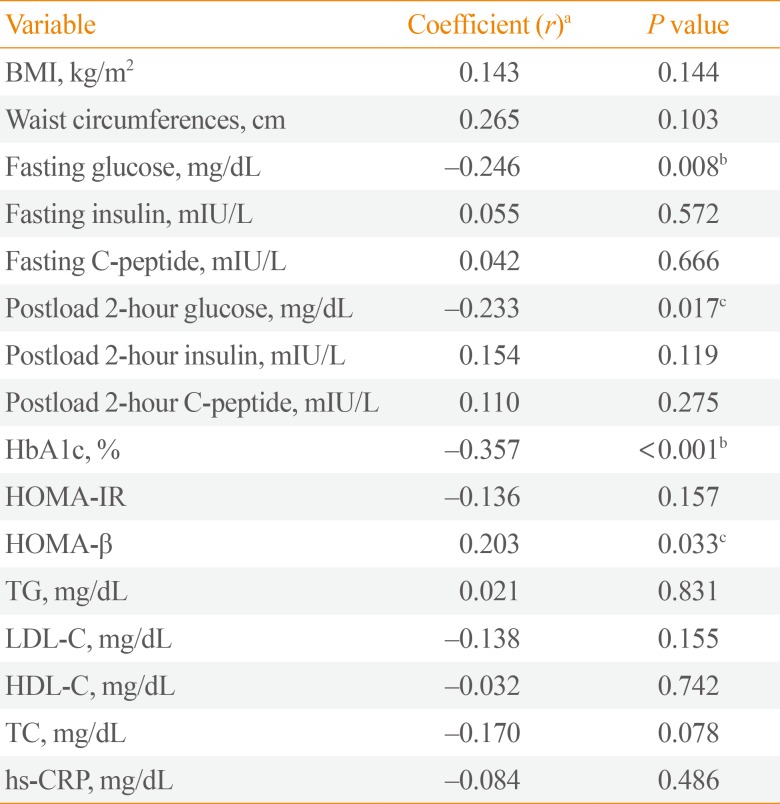
To investigate the serum levels of Slit2 in human diabetes, we investigated correlations between serum circulating Slit2 level and multiple metabolic parameters, including BMI, WCs, fasting glucose, fasting C-peptide, HbA1c, HOMA-IR, HOMA-β, and lipid profiles (Table 2). Increased serum Slit2 level were negatively correlated with fasting plasma glucose level (coefficient r=–0.246, P=0.008), postprandial glucose (coefficient r=–0.233, P=0.017), and HbA1c (coefficient r=–0.357, P< 0.001). In addition, positive correlations were evident between Slit2 level and HOMA-β (r=0.203, P=0.033). However, Slit2 level was not correlated with hs-CRP level or lipid profiles including TG, TC, LDL-C, and HDL-C.

Correlation Analysis between Slit2 Level and Metabolic Parameters
DISCUSSION
In our study, we demonstrated for the first time that the circulating Slit2 was linked to human serum glucose level and insulin secretary function. Our results showed that human circulating Slit2 was negatively correlated with serum glucose, HOMA-β, and HbA1c, although there was no significant difference statistically between diabetic group and control group.
Slit2 was first characterized in neuronal development [10] and was found to interact with Robo1 to mediate myogenesis [11], endothelial cell migration, and leukocyte chemotaxis [12]. The role of Slit2 has been shown to induce tumor angiogenesis and to regulate the lymphangiogenesis in various human cancers [1314]. The full-length Slit2 protein is a secreted 200 kDa ligand that is cleaved into two fragments, a 140 kDa N-terminal product (Slit2-N), and a 50 to 60 kDa C-terminal product (Slit2-C) [15]. Many studies have revealed that N-Slit2 binds cell membrane via Robo receptor, whearas Slit2-C is diffusible [16]. However, few studies focused on the role of Slit2-N in human diabetes. Increased levels of advanced glycation end-productions can increase the levels of Slit2 in human retinal pigment epithelium cells via the PI3K (phosphatidylinositol-4,5-bisphosphate 3-kinase)/Akt pathway in patients with diabetic retinopathy [17]. Additionally, Zhao et al. [18] reported the Slit2-N inhibited lipopolysaccharide-induced endothelial inflammation via binding with Robo4 receptor. However, the direct role of Slit2 in metabolic disease and glucose homeostasis is not fully understood.
Recently, Svensson et al. [4] demonstrated the functional specificity of circulaitng Slit2, the active C fragments of Slit2, in regulating thermogenesis. They identified that the Slit2 was the new secreted factor from beige adipose cells using PRDM16, the major transcriptional coregulator that controls the development of brown adipocytes [19], transgenic mice, and cold exposure experiments. Moreover, they demonstrated that the recombinant Slit2 protein induced a themogenic program in mice and in cells, and observed the reduction of in the thermogenic gene expression and expression of mitochondrial genes in brown adipocytes in whole body Slit2 knockout mice. Notably, they identified that the Slit2-C, which is a circulating active form of Slit2, regulated whole-body energy expenditure and induced the improvement of glucose homeostasis in obese mice, which was distinct from previous studies of Slit2. Despite the fact that Slit2 protein expression in adipose tissue may be related to thermogenesis in vivo [4], the function of circulating Slit2 proteins in humans has not been studied. For these reasons, we evaluated serum circulating Slit2 level in human for the first time.
The results of our study are consistent with previous studies on Slit2-C, since circulating Slit2 was negatively correlated with serum fasting glucose level, serum postprandial glucose level, and HbA1c level in human, although there is no significant difference of circulating Slit2 level between T2DM subjects and control subjects. Interestingly, HOMA-β index, an indicator for β-cell function, was significantly positively related with circulating Slit2 level. From our result, we suggest serum circulating Slit2 may have a specific role in the regulation of glucose homeostasis and in the maintainance of β-cell functions, although further large scaled studies are still required.
Even though our study clearly showed that serum circulating Slit2 levels are significantly related with glucose homeostasis and β-cell fuction in humans, as in previous studies [4], we could not evaluate the exact roles and mechanisms of Slit2. Furthur studies are necessary, since little is known about the the exact receptor and the enzymatic processing of Slit2-C. Furtheremore, Slit2-C has multiple domains, and the mechanism underlying these processes should be explored by research in vivo and in vitro, including through binding assays of Slit2-C and the expression of receptors specific for circulating Slit2-C.
In conclusion, these preliminary results suggest a possible association: circulating Slit2 may play a pivote role in maintenance of glucose homeostasis in humans.
ACKNOWLEDGMENTS
This research was supported by the National Research Foundation of Korea (NRF) funded by the Ministry of Science, ICT & Future Planning (NRF-2017R1D1A1B03027820), the National Research Foundation of Korea (NRF) grant funded by the Korean Government (NRF-2016R1D1A1A09916900), and the research fund of the Daejeon and Chungcheong Branch of Korean Endocrine Society (2017).
Notes
CONFLICTS OF INTEREST: No potential conflict of interest relevant to this article was reported.