Decreased Serum Level of Sclerostin in Older Adults with Sarcopenia
Article information

Abstract
Background
Although muscles and bones interact with each other through various secretory factors, the role of sclerostin, an osteocyte-secreted factor, on muscle metabolism has not been well studied. We investigated the levels of serum sclerostin in Korean older adults with sarcopenia.
Methods
Blood samples were collected from 129 participants who underwent evaluation of muscle mass and function in an outpatient geriatric clinic of a teaching hospital. Sarcopenia and related parameters were determined using cutoff values for the Asian population. Serum sclerostin levels were measured using an enzyme-linked immunosorbent assay.
Results
The mean age of the participants was 69.6 years, and 20 participants (15.5%) were classified as having sarcopenia. After adjusting for age, sex, and body mass index, serum sclerostin levels were significantly lower in participants with sarcopenia, low muscle mass, or weak muscle strength (P=0.003 to 0.045). Serum sclerostin levels were positively associated with skeletal muscle index and grip strength after adjusting for confounders (P=0.001 and P=0.003), whereas sarcopenic phenotype score showed a negative association (P=0.006). These increases in muscle mass and strength were also dose dependent as serum sclerostin levels increased (P for trends=0.003 and P for trends=0.015). Higher serum sclerostin levels were associated with lower odds ratio (ORs) for sarcopenia, low muscle mass, and weak muscle strength after adjusting for confounders (OR, 0.27 to 0.50; P<0.001 to 0.025).
Conclusion
Higher serum sclerostin levels were associated with a lower risk of sarcopenia, low muscle mass, and weak muscle strength in Korean older adults.
INTRODUCTION
Sarcopenia is an age-related disease, in which the muscle mass, strength, and function may decline with age [1,2]. The pathophysiology of sarcopenia is complex and results from the biological alterations in the structure of the muscles, hormonal imbalances, and external influences such as energy intake deficiencies [3]. Sarcopenia increases the risk of falls and fractures, reduces the quality of life, and increases the risk of disease and even death. It has become a major threat to the health of older adults [4-6]. Despite its seriousness, questions related to the cellular mechanisms, biomarkers, accurate diagnostic tests, and effective treatment strategies for sarcopenia remain unresolved [7].
Similar to sarcopenia, osteoporosis is an age-related disease characterized by reduced bone density, poor bone quality, and reduced bone strength with an increase in fracture risk [8,9]. Sarcopenia and osteoporosis often coexist in the fragile population, leading to significantly worse outcomes compared with those observed in either condition alone. Several studies have demonstrated considerable overlap in the pathophysiology of these two diseases, suggesting the possibility of treating these conditions together [10,11]. Since both muscles and bones are endocrine organs, the interaction between these two organs via their secretory functions has recently received special attention [12].
Sclerostin is a secreted glycoprotein expressed predominantly by mature osteocytes that serves as a negative regulator of Wnt signaling and bone formation in the human body [13]. Although the main role of sclerostin is to regulate bone mass through paracrine action, recent studies have suggested the possible endocrine effects of sclerostin on non-skeletal tissues such as adipose tissues, mineral metabolism, and vascular calcification, with the detection of sclerostin protein in the circulation [14-16]. However, few studies have demonstrated the effect of sclerostin on muscle metabolism. Therefore, we aimed to investigate the levels of serum sclerostin in older Korean adults with sarcopenia.
METHODS
Study design and participants
This was a cross-sectional study conducted in a cohort of community-dwelling Korean older adults who had undergone a comprehensive functional assessment at the outpatient geriatric clinic of Asan Medical Center (Seoul, Korea), a tertiary teaching hospital, between March 2019 and February 2021. These participants were not admitted in inpatient facilities or nursing homes and were all ambulatory with or without walking aids. Patients with end-stage renal failure on dialysis, symptomatic heart failure, and a life expectancy of <1 year due to malignancy were excluded. All 129 eligible participants provided written informed consent for blood sample collection and were enrolled in this study. The study was approved by the Institutional Review Board of Asan Medical Center (no. 2020-0259) and complied with the ethical rules for human experimentation as stated in the Declaration of Helsinki.
Clinical assessments
Data on the demographic characteristics and surgical and medical history were collected through detailed interviews and review of medical records by nurses experienced in geriatric assessments. A bioelectrical impedance analyzer (InBody S10, InBody, Seoul, Korea) was used to assess the body composition, including muscle mass [17]. The sum of the muscle mass of the four extremities was defined as the appendicular skeletal muscle mass (ASM; kg) and was divided by height2 to obtain the skeletal muscle mass index (SMI; kg/m2) to determine the anthropometric differences among participants [18]. Handgrip strength of the dominant hand was measured with the elbow flexed at 90° while the patient was in a comfortable sitting position using a Jamar hydraulic hand dynamometer (Patterson Medical, Warrenville, IL, USA). The maximum value of two tests taken after a break of at least 1 minute was recorded. A short physical performance battery (SPPB) consisting of five chair stands, standing balance, and walking speed was performed using a hardware and algorithms of an electronic SPPB toolkit developed by Dyphi Inc. (Daejeon, Korea) to assess the participants’ physical performance [19,20]. For repeated chair stands, the time required to complete five sit-to-stand maneuvers as quickly as possible was measured. In the standing balance test including a semi-tandem stance, a tandem stance, and a side-by-side stance, the participants were instructed to stand for up to 10 seconds. With regard to walking speed, the 4-m typical gait speed was recorded, with a separate 1-m acceleration distance excluded from the speed calculation [21]. The total SPPB score ranged from 0 to 12 points, with a higher score indicating better lower extremity function.
Sarcopenia was diagnosed as a dichotomized classification based on the guidelines of the 2019 Asian Working Group for Sarcopenia (AWGS) [22]. In brief, participants with low muscle mass (SMI <7.0 kg/m2 for men and <5.7 kg/m2 for women), weak muscle strength (handgrip strength <28 kg for men and <18 kg for women), and/or poor physical performance (five chair stands ≥12 seconds, walking speed <1.0 m/sec, or SPPB score ≤9 points) were considered to have sarcopenia. The sarcopenia phenotype score (SPS) for a continuous measure incorporating multiple features of sarcopenia, which ranged from 0 (best) to 3 (worst), was calculated as the numbers of abnormal parameters among the following three items: low muscle mass (SMI <7.0 kg/m2 for men and <5.7 kg/m2 for women), weak muscle strength (handgrip strength <28 kg for men and <18 kg for women), and slow walking speed (gait speed <1.0 m/sec) [23].
Sclerostin measurements in human serum
Blood samples were collected after overnight fasting for a minimum of 8 hours. After sample centrifugation at 3,000 rpm for 5 minutes at 4°C, the supernatants were carefully collected to exclude the cell components. All samples with hemolysis or clotting were discarded. Thereafter, the serum samples were stored at −80°C before measuring the concentrations. Serum levels of sclerostin were measured using a sclerostin competitive enzyme-linked immunosorbent assay (ELISA) kit (Cat. No. BI20492, Biomedica, Vienna, Austria) according to the manufacturer’s instructions. The lower limit of detection for the sclerostin competitive ELISA kit was 3.2 pmol/L, and the intra- and inter-assay coefficient of variabilities were 7% and 5%, respectively.
Statistical analysis
Data are expressed as mean±standard deviation for continuous variables and as numbers with percentages for categorical variables. Variables were compared according to the status of sarcopenia using t test for continuous variables and chi-square test or Fisher’s exact test for categorical variables. The least-square means with the corresponding 95% confidence intervals (CIs) of serum sclerostin levels were calculated based on the status of sarcopenia and abnormalities in sarcopenia-related parameters using analysis of covariance (ANCOVA) after adjusting for age, sex, and body mass index (BMI). Multiple linear regression analyses were performed to evaluate the associations between serum sclerostin levels and sarcopenia-related parameters. To further analyze the changes in sarcopenia-related parameters according to quartiles of serum sclerostin levels, multivariate-adjusted least-square means with 95% CIs were estimated and compared using ANCOVA. Trends shown by sarcopenia-related parameters across increasing serum sclerostin levels were estimated using multiple linear regression analysis. Multiple logistic regression analysis was performed to evaluate the odds ratios (ORs) for sarcopenia and abnormalities in sarcopenia-related parameters. The confounders included in the multivariate model were age, sex, and BMI. The analyses were performed using IBM SPSS statistics version 19.0 (IBM Co., Armonk, NY, USA), and a P value of <0.05 was considered significant.
RESULTS
Baseline characteristics of the study participants
Among the 129 participants, 64 (49.6%) were men, and 20 (15.5%) were classified as having sarcopenia according to the AWGS definition. The mean age of the participants was 69.6 years. Participants with sarcopenia had older age, lower BMI, lower ASM, lower SMI, lower grip strength, and lower SPPB total score than those without sarcopenia (P<0.001 to 0.035); meanwhile, SPS was higher in participants with sarcopenia than in those without sarcopenia (P<0.001) (Table 1).

Baseline Characteristics of the Study Participants According to Sarcopenia Status
Serum sclerostin levels according to sarcopenia status and related parameters
Serum sclerostin level was lower in participants with sarcopenia (30.7±13.3 pmol/L) than in those without sarcopenia (46.6±15.0 pmol/L, P<0.001) (Fig. 1). Even after adjusting for age, sex, and BMI, serum sclerostin levels were significantly lower in participants with sarcopenia (P=0.003). Moreover, serum sclerostin levels were significantly lower in participants with low muscle mass or weak muscle strength than in those with normal muscle mass or strength before and after adjusting for confounders (P=0.001 to 0.045). However, the serum sclerostin levels did not differ according to physical performance status before and after adjusting for confounders (Fig. 1).
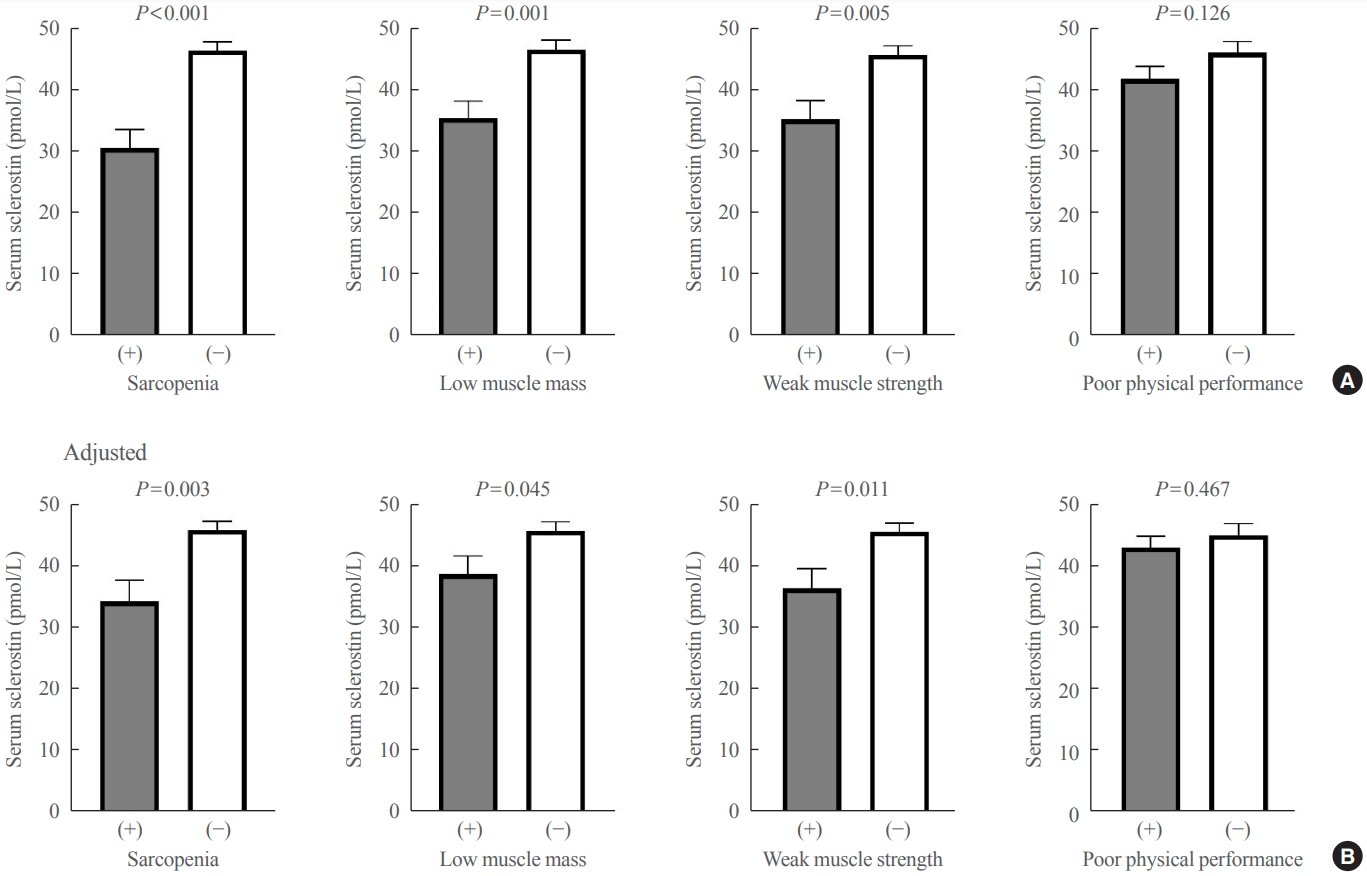
Differences in serum sclerostin levels according to sarcopenia status and abnormalities in sarcopenia-related parameters (A) before and (B) after adjusting for age, sex, and body mass index. Values are expressed as least-square means with 95% confidence interval.
Association of serum sclerostin level with sarcopenia-related parameters
Serum sclerostin levels were positively associated with ASM, SMI, and grip strength before and after adjusting for age, sex, and BMI (P<0.001 to 0.004), whereas SPS was negatively associated with serum sclerostin levels before and after adjusting for confounders (P<0.001 and P=0.006, respectively) (Table 2). However, no significant associations were found between serum sclerostin levels and gait speed, chair stand time, and SPPB total score before and after adjusting for confounders.
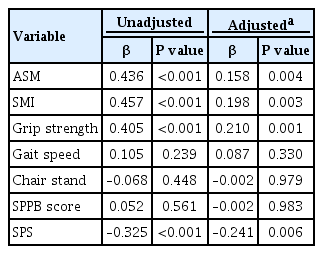
Associations between Serum Sclerostin Levels and Sarcopenia-Related Parameters by Linear Regression Analysis
Sarcopenia-related parameters according to serum sclerostin level
To determine whether a dose dependent association exists between serum sclerostin levels and sarcopenia-related parameters, we analyzed the change in sarcopenia-related parameters according to the quartiles of serum sclerostin levels (Fig. 2). Before adjusting for confounders, SMI and grip strength increased as the quartile of serum sclerostin level increased (all P for trends <0.001), whereas no change was observed in gait speed, chair stand time, and SPPB total score according to the serum sclerostin quartiles. SPS decreased as the quartile of serum sclerostin levels increased (P for trend=0.011). After adjusting for age, sex, and BMI, SMI, and grip strength still significantly increased as the quartile of serum sclerostin level increased (P for trends=0.003 and P for trends=0.015, respectively), whereas SPS decreased (P for trend=0.016). No significant changes were observed in gait speed, chair stand time, and SPPB total score according to the serum sclerostin quartiles after adjusting for confounders. In the post hoc analysis, SMI and grip strength in the highest sclerostin quartile were significantly higher than those in the lowest sclerostin quartile, while SPS in the highest sclerostin quartile was significantly lower than that in the lowest sclerostin quartile before and after adjusting for confounders (Fig. 2).
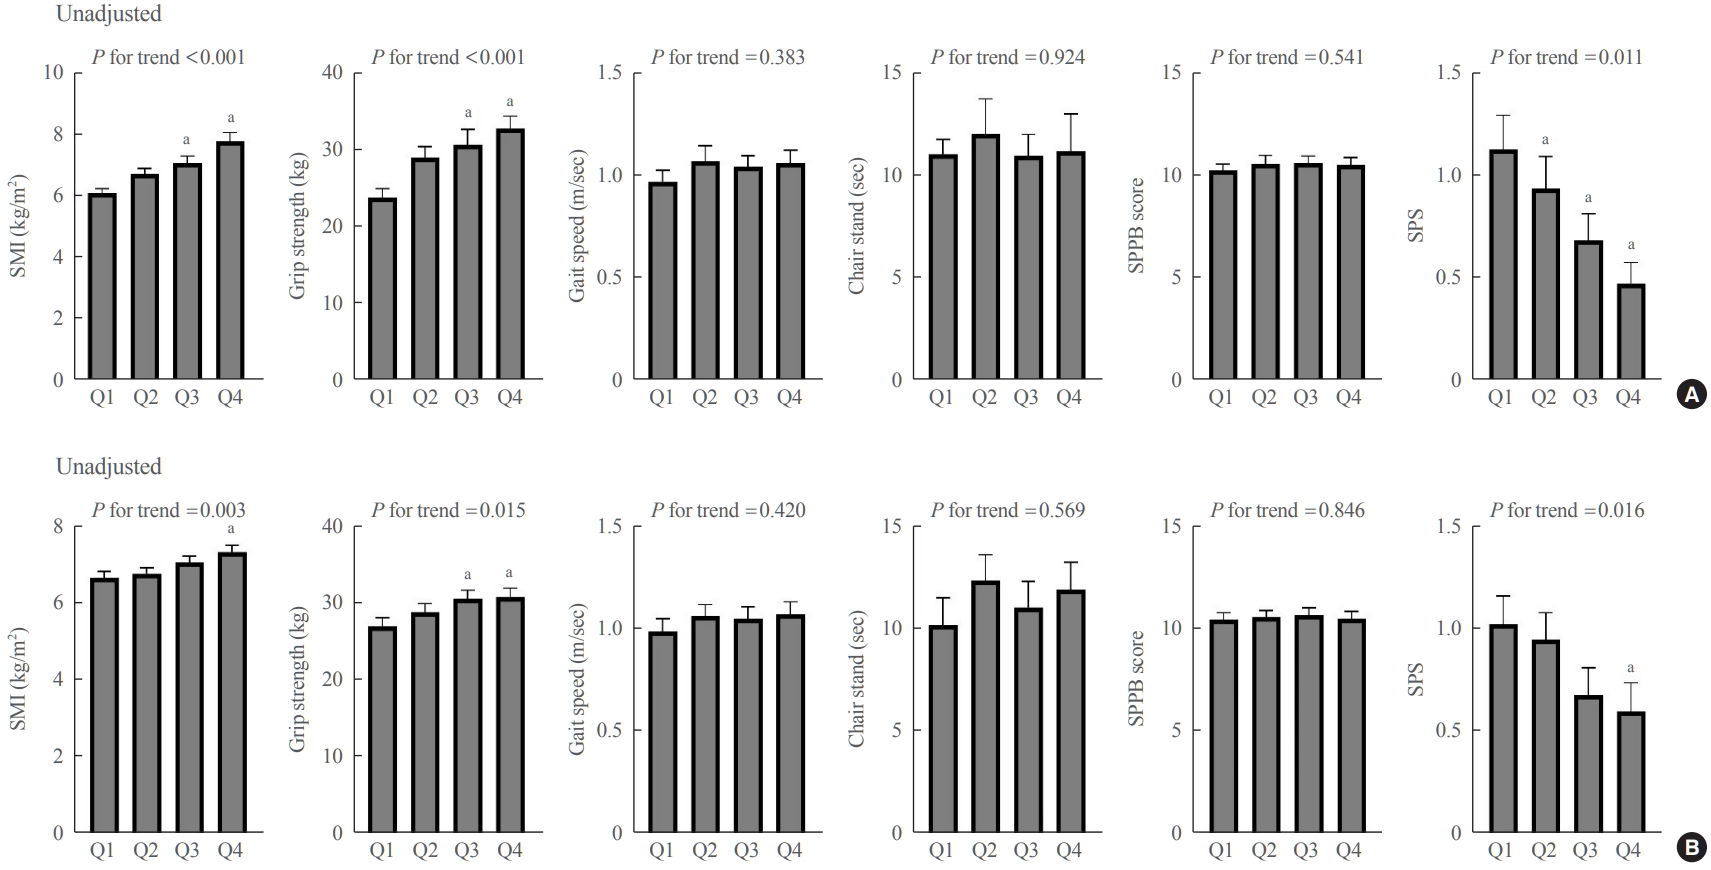
Differences in sarcopenia-related parameters according to serum sclerostin quartiles (A) before and (B) after adjusting for age, sex, and body mass index. Values are expressed as least-square means with 95% confidence interval. SMI, skeletal muscle index; SPPB, short physical performance battery; SPS, sarcopenia phenotype score. a P<0.05 vs. Q1 in the post hoc analysis.
Risk of sarcopenia and abnormalities in sarcopenia-related parameters according to serum sclerostin level
The odds of sarcopenia and related parameters were assessed using logistic regression analysis (Table 3). Before and after adjusting for age, sex, and BMI, higher serum sclerostin levels were associated with lower ORs for sarcopenia, low muscle mass, and weak muscle strength (OR, 0.27 to 0.50; P<0.001 to 0.025), whereas the risk of poor physical performance was not associated with serum sclerostin levels.
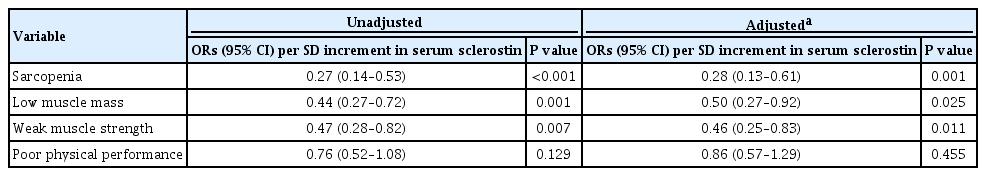
Logistic Regression Analysis to Determine the ORs for Sarcopenia and Related Parameters According to Serum Sclerostin Levels
DISCUSSION
This study showed that serum sclerostin levels were significantly lower in Korean older adults with sarcopenia, low muscle mass, or weak muscle strength, even after considering the confounding effects of age, sex, and BMI. Serum sclerostin levels were also positively associated with muscle mass and strength. Moreover, the increase in muscle mass and strength was dose dependent according to the increase in serum sclerostin levels. Finally, the risk of sarcopenia, low muscle mass, or weak muscle strength decreased with an increase in serum sclerostin levels in Korean older adults.
Sarcopenia and osteoporosis are the most representative aging-related diseases of the musculoskeletal system caused by progressive decline in mass and strength of the muscles and bones, usually after the sixth decade of life [24,25]. Since sarcopenia and osteoporosis share common risk factors [10,26], these two disorders often co-occur and are synergistically associated with frailty, falls, fractures, hospitalizations, and mortality [27-29]. Therefore, several efforts have been made to identify the common diagnostic biomarkers and therapeutic targets in patients with both diseases [10]. In addition, more research is required to understand the biological mechanisms underlying the interaction between sarcopenia and osteoporosis.
In this context, recent in vitro studies have paid special attention to the crosstalk between muscles and bones [30]. The traditional viewpoint in the interaction between these two organs is that the mechanical forces applied to the muscles are transmitted to the skeleton to initiate bone formation [31]. Recently, both muscles and bones have been identified as secretory endocrine organs, and their secretory factors (myokines and osteokines) have shown regulatory effects on a range of tissues, including muscles and bones, through the autocrine, paracrine, and endocrine mechanisms [32]. Among various osteokines, osteocalcin and insulin-like growth factor-1 have anabolic effects on the muscles, while the receptor activator of nuclear factor kappa β ligand and fibroblast growth factor 23 showed catabolic effects [12]. However, a few studies have demonstrated the action of sclerostin, an osteocyte-secreted factor that inhibits osteoblastogenesis, on muscle metabolism, and the results have been inconsistent [33-35]. Some recent studies identified the receptors for sclerostin (low-density lipoprotein receptor-related protein complex [LRP5/6]) in muscle cells [33] and demonstrated that the secretome of osteocytes inhibits skeletal muscle cell differentiation [34]. However, in an animal model of spinal cord injury, sclerostin antibody did not slow the muscle atrophy, unlike the expected action of sclerostin as an inhibitor of muscle hypertrophy [35]. Moreover, some in vitro and ex vivo evidence suggests that the osteocytes in culture can stimulate myogenesis and contractile function [36]. Albeit the effect of osteocyte-derived sclerostin on muscle metabolism has not reached a conclusion so far, reports of recent studies suggested the possibility of the close interaction between muscle and bone via sclerostin. In this regard, the significantly decreased levels of serum sclerostin in Korean older adults with sarcopenia in our study provides additional clinical evidence to this interaction and shows the possible role of circulatory sclerostin as a biomarker for both sarcopenia and osteoporosis.
However, the decreased levels of serum sclerostin in our study participants with sarcopenia suggested a contrary anabolic role of circulatory sclerostin in the muscles compared with its known catabolic role in the bones. Although the reason for our counterintuitive finding remains unclear, some explanations could be inferred from the change in serum sclerostin levels according to bone strength in previous studies [37]. In previous in vitro and in vivo studies, higher mechanical loading in the bone was associated with lower serum sclerostin secretion, which may reflect the compensatory adaptation of osteocytes to existing bone strains [38,39]. These findings suggest that individuals with lower bone strength may have higher mechanical strains in the remaining bone, resulting in a decrease in sclerostin expression to compensate for bone fragility. Accordingly, a previous Korean study reported that low serum sclerostin levels were associated with a high prevalence of osteoporotic fractures and low bone mineral density values [40]. Moreover, the muscles can protect bone loading, and their ability to attenuate loads is compromised when the muscles are dysfunctional [31,41]. Therefore, individuals with weakened muscle may have higher bone strain, which also results in compensatory adaptation of osteocytes as the sclerostin secretion decreased. On the contrary, a previous clinical study investigating the association between serum sclerostin levels and muscle mass in middle-aged or older adults showed that serum sclerostin levels increased in individuals with low muscle mass [42]. However, this inverse association between muscle-related parameters and serum sclerostin levels was only limited to muscle mass in that study, while our study demonstrated consistent positive associations of muscle mass and strength with serum sclerostin levels. Finally, a recent study demonstrated that skeletal muscle is a new source of sclerostin [43]. In this study, sclerostin was expressed in the myogenic cell lines at all stages of differentiation. In mice, the expression of sclerostin was dynamically modulated in a muscle-specific manner throughout the lifespan and showed a decreasing trend in older mice. Therefore, the decrease in serum sclerostin levels in sarcopenic individuals in our study might reflect the decrease in muscle cell-secreted sclerostin according to the muscle mass.
These hypotheses for lower serum sclerostin levels in older sarcopenic adults point to the potential involvement of sclerostin secreted from bone and muscle as a biomarker and therapeutic target for sarcopenia. Moreover, recent clinical trials proving the efficacy of romosozumab, a monoclonal antibody against sclerostin, on fracture risk in postmenopausal women revealed that romosozumab also tended to reduce the risk of falls [44- 46]. Because frail people often have weak muscles, there is a possibility that fewer falls with romosozumab administration could be attributable to muscle anabolic effects of this drug. Further clinical studies assessing the roles of romosozumab on muscle mass and strength will give more insight into the potential of sclerostin inhibition as a sarcopenia treatment target.
Our study has several strengths. First, our study included various structural and functional parameters of muscle health, including muscle mass, grip strength, gait speed, time to complete five chair stands, SPPB score, and SPS, which contributed to the greater reliability of the results. Second, the Asian-specific cutoff point was adopted for the diagnosis of sarcopenia [22], because the muscle parameters may vary depending on ethnicity, body size, lifestyle, and cultural background. However, this study has several limitations. First, this observational study could not determine the causal relationship between the variables. Second, our study population was exclusively South Korean; therefore, whether our results are applicable to other populations remains uncertain. Third, various confounding factors could not be considered in the multivariate analyses due to the relatively small sample size. Finally, our bioelectrical impedance analysis methodology might not provide valid estimates of the total body water when hydration states are altered, potentially leading to errors in muscle mass assessments. Finally, only the serum sclerostin levels were measured in our study. Since recent evidence suggests the presence of sclerostin in muscle tissue, measurement of muscle-specific sclerostin will provide a more plausible association between circulatory sclerostin and muscle-related parameters.
In conclusion, our study showed that higher serum sclerostin levels were associated with a lower risk of sarcopenia, low muscle mass, and weak muscle strength in Korean older adults. Therefore, serum sclerostin levels may be a biomarker for muscle health, and further in vitro research investigating the role of sclerostin in muscle metabolism, especially in relation to the bone, may provide new therapeutic targets for both sarcopenia and osteoporosis.
Notes
CONFLICTS OF INTEREST
No potential conflict of interest relevant to this article was reported.
AUTHOR CONTRIBUTIONS
Conception or design: S.H.A., H.W.J., S.H., B.J.K. Acquisition, analysis, or interpretation of data: S.H.A., J.Y.B., S.J.P., J.Y.L., E.C., Y.S.L. Drafting the work or revising: S.H.A., H.W.J., J. Y.B. Final approval of the manuscript: E.L., I.Y.J., S.H., B.J.K.
Acknowledgements
This work was supported by grants from the Korean Endocrine Society of New Faculty Research Award 2019 and the Asan Institute for Life Science, Asan Medical Center, Seoul, Korea (grant number: 2022IP0077).