Comparative Analysis of Driver Mutations and Transcriptomes in Papillary Thyroid Cancer by Region of Residence in South Korea
Article information

Abstract
Background
Radiation exposure is a well-known risk factor for papillary thyroid cancer (PTC). South Korea has 24 nuclear reactors in operation; however, no molecular biological analysis has been performed on patients with PTC living near nuclear power plants.
Methods
We retrospectively included patients with PTC (n=512) divided into three groups according to their place of residence at the time of operation: inland areas (n=300), coastal areas far from nuclear power plants (n=134), and nuclear power plant areas (n=78). After propensity score matching (1:1:1) by age, sex, and surgical procedure, the frequency of representative driver mutations and gene expression profiles were compared (n=50 per group). Epithelial-mesenchymal transition (EMT), BRAF, thyroid differentiation, and radiation scores were calculated and compared.
Results
No significant difference was observed in clinicopathological characteristics, including radiation exposure history and the frequency of incidentally discovered thyroid cancer, among the three groups. BRAFV600E mutation was most frequently detected in the groups, with no difference among the three groups. Furthermore, gene expression profiles showed no statistically significant difference. EMT and BRAF scores were higher in our cohort than in cohorts from Chernobyl tissue bank and The Cancer Genome Atlas Thyroid Cancer; however, there was no difference according to the place of residence. Radiation scores were highest in the Chernobyl tissue bank but exhibited no difference according to the place of residence.
Conclusion
Differences in clinicopathological characteristics, frequency of representative driver mutations, and gene expression profiles were not observed according to patients’ region of residence in South Korea.
INTRODUCTION
The incidence of thyroid cancer has increased in the last few decades, especially in South Korea [1-3]. This may be because of the introduction of high-sensitivity neck ultrasound for detecting papillary thyroid cancer (PTC), mainly papillary thyroid microcarcinoma [4-6]. However, previous studies have reported that various risk factors for PTC, such as radiation exposure, high iodine intake, obesity, and family history of PTC, are responsible for the actual increase in the prevalence of thyroid cancer [7-11]. Among these risk factors, the best known is radiation exposure [12,13].
Furthermore, many studies targeting external exposure, such as radiation therapy, reported an increased incidence of PTC among survivors of the atomic bombings in Hiroshima and Nagasaki and residents near the Chernobyl nuclear power plant accident [12,14]. As the thyroid equivalent dose of children and adolescents increased because of the Chernobyl nuclear power plant accident in 1986, the equivalent thyroid dose from radioactive iodine at the time of the accident was estimated to be 100 to 2,000 mSv [15,16]. According to a report published by the United Nations Scientific Committee on the Effects of Atomic Radiation (UNSCEAR) in 2008, the prevalence of thyroid cancer is proportional to dose; however, no statistically significant increase is observed at doses <100 mSv [17]. In a study of thyroid cancer in adolescents and adults in Bryansk, Russia’s most polluted region after the Chernobyl accident, the standardized incidence ratio of PTC was increased in both men and women; however, a relationship between radiation dose and PTC risk was not observed [18]. In addition, even if an increase in the incidence of thyroid cancer was observed in epidemiological studies, genetic susceptibility, iodine deficiency effect, and screening effect of thyroid cancer induced by the Chernobyl accident act as confounders, suggesting that careful interpretation is required [7].
In South Korea, there are 24 nuclear reactors in operation, located in Gori (Jangan-eup, Gijang-gun, and Busan), Shin-Gori (Seosaeng-myeon, Ulju-gun, and Ulsan), Wolseong/Sinwolseong (Yangnam-myeon, Gyeongju-si, and Gyeongsangbuk-do), Hanbit (Hongnong-eup, Yeonggwang-gun, and Jeollanam-do), and Hanul (Buk-myeon, Uljin-gun, and Gyeongsangbukdo). This distribution indicates that four of the top 10 nuclear power plants density in the world are located in South Korea. Furthermore, 5.31 million people live within a 30 km radius of each of these nuclear power plants; considering that the population of Korea was 51.7 million as of 2019, more than one out of 10 people live within a 30 km radius of a nuclear power plant. Therefore, whether the occurrence of PTC is increased by radiation exposure in this region has been a very important social issue [19].
The driver mutations of radiation exposure-induced PTC are mainly RET/PTC rearrangements, as supported by Genomic Data from Chernobyl Studies [20,21]. However, RET/PTC rearrangements have been detected even in young patients with thyroid cancer who have not been exposed to radiation, and the cause remains unidentified [22]. BRAFV600E mutation has been frequently identified as the driver mutation of sporadic PTC in South Korea [23]. Furthermore, some studies reported that high iodine intake or obesity may be associated with BRAFV600E mutation; however, substantial evidence supporting this finding is lacking [24,25]. In addition, a study of atomic bomb survivors reported that the BRAFV600E mutation is highly prevalent at low doses, as in sporadic PTC [26,27].
In the present study, we compared the frequency of driver mutations according to the patients’ region of residence to investigate the effect of nuclear power plants on the occurrence of PTC in South Korea. In addition, to overcome the limitation of driver mutation analysis, regions were compared in terms of transcriptome analysis. Considering that most nuclear power plant areas are distributed along the coast, a comparison was made between three groups: inland areas, coastal areas far from nuclear power plants, and nuclear power plant areas.
METHODS
Patients and tissue samples
Patients who underwent thyroidectomy at Yonsei Cancer Center (Seoul, Korea) between March 2003 and December 2019 were included in this study, and classical type PTC tissue samples were collected from the same patients. Patients with confirmed Hashimoto’s thyroiditis pathologically were excluded. Patients with a first-degree relative (parent, brother, sister, or child) with thyroid cancer were defined as having a family history. Patients (n=512) were divided into three groups according to their place of residence at the time of operation: inland areas (n=300), coastal areas far from nuclear power plants (n=134), and nuclear power plant areas (n=78). All tissues were frozen in liquid nitrogen immediately after surgery and stored at –80°C before use. To prepare tissue samples, three groups were identified by extracting the group of patients with thyroid cancer and matching age, sex, and surgical procedure in a ratio of 1:1:1 (n=50 per group). The requirement for written informed consent was waived because of the study’s retrospective nature. For tissue samples, consent was obtained from the institutional tissue banks at the time of surgery. The study protocol was approved by the Institutional Review Board of Yonsei Cancer Center, Severance Hospital (IRB-No. 4-2020-0815), Seoul, Korea.
Identification of driver mutations
Genomic DNA from PTC tissue specimens was extracted using the QIAamp DNA Mini kit (Qiagen Inc., Valencia, CA, USA) and used to amplify target genes with polymerase chain reaction (PCR) using specific primers, followed by Sanger sequencing (Applied Biosystems, Foster, CA, USA). The following primers were used: 5´-ATG CTT GCT CTG ATA GGA AA-3´ (forward) and 5´-ATT TTT GTG AAT ACT GGG AA-3´ (reverse) for BRAF; 5´-AGC ATT GCA TTC CCT GTG GT-3´ (forward) and 5´-AGT GTG GTA ACC TCA TTT CCC C-3´ (reverse) for NRASQ61R; 5´-TCT CAG CAC CCC AGG AGA G-3´ (forward) and 5´-GAC ATG CGC AGA GAG GAC AG-3´ (reverse) for HRASQ61R; 5´-CAC GTC TGC AGT CAA CTG GA-3´ (forward) and 5´-ACC CTG ACA TAC TCC CAA GGA-3´ (reverse) for KRASG12V; 5´-CCG TCA TCT TTG GAG CAG GA-3´ (sense) and 5´-TCC ACT GCT CTA ATC CCC CA-3´ (reverse) for KRASQ61K; 5´-ATC GGG TTC CTT GCA TAG GG-3´ (forward) and 5´-ACC CTG ACC ATC CTC TTT GA-3´ (reverse) for eukaryotic translation initiation factor 1A X-linked (EIF1AX); 5´-GTG TTG CTT GAT GGC CCT TG-3´ (sense) and 5´-CAG TGT TGA TCA GGC CCC AT-3´ (reverse) for CAP-Gly domain containing linker protein 2 (CLIP2).
RNA sequencing
Total RNA was extracted according to the manufacturer’s protocol (TRIzol reagent, Qiagen). RNA quality was analyzed using a 2100 Bioanalyzer System (Agilent Technologies, Santa Clara, CA, USA). Macrogen Inc. (Seoul, Korea) prepared a cDNA library using TruSeq Stranded mRNA LT Sample Prep Kit (Illumina, San Diego, CA, USA) according to the sample preparation guide (Part #15031048 Rev E). NovaSeq 6000 (Illumina) was used for 100 nt paired-end sequencing. After trimming low-quality RNA or artifacts, such as adaptor sequences, contaminant DNA, and PCR duplicates from the raw data, data were mapped to the reference genome using HISAT2 (version 2.1.0), and aligned reads were generated using StringTie (version 2.1.3b). The transcripts were normalized to fragments per kilobase of transcript per million mapped reads and transcripts per million kilobases (TPM). Fold changes were calculated using the TPM log2 value to analyze differentially expressed genes (DEGs). To minimize batch effects, we used same reagent lot and instrument used to conduct the experiment, and one researcher (S.P., PhD) performed the experiments, such as DNA and RNA extraction. RNA sequencing was randomly assigned and conducted simultaneously at the same institution (Macrogen Inc., Seoul, Korea). To validate the results from RNA sequencing, real-time quantitative reverse transcription polymerase chain reaction (qRT-PCR) was performed for genes of interest according to standard protocols (refer to Supplemental Fig. S1 for representative results) [28].
Public data acquisition
Normalized raw data for RNA expression from The Cancer Genome Atlas (TCGA, https://tcga-data.nci.nih.gov/tcga/) and GSE33630 from the Gene Expression Omnibus database (GEO, https://www.ncbi.nlm.nih.gov/geo/) were selected.
Gene set enrichment analysis and generation of the scoring system
Genes identified as DEGs (fold changes >2 and two-tailed P<0.05) were subjected to pathway enrichment analysis using gene set enrichment analysis (GSEA) [29,30]. Hallmark gene sets were used for GSEA. Statistical significance was set at P<0.05 and false discovery rate at <0.25. The results were presented using the dot plot to represent feature expression changes across different identity classes (groups). A single-sample GSEA (ssGSEA) was performed to calculate signature gene scores using signature gene sets [31]. The calculated signature scores were hallmark epithelial-mesenchymal transition (EMT), BRAF, thyroid differentiation (TD), and radiation scores [32]. The gene lists used for radiation scores are summarized in Supplemental Table S1.
Fusion gene analysis
To identify fusion oncogenes, deFuse v0.8.1, FusionCatcher v1.00, and Arriba v.1.2.0 were applied to the expression data. The fusion genes found simultaneously in all three algorithms were selected as valid results.
Statistical analyses
Mean comparisons were performed using analysis of variance or Mann-Whitney U test, whereas group comparisons were performed using a two-tailed chi-square test, Fisher’s exact test, or linear-by-linear associations accordingly. Statistical analysis was performed using Prism version 9 (GraphPad Software, SanDiego, CA, USA) and SPSS version 25.0 for Windows (IBM Corporation, Armonk, NY, USA). All P values are two-sided.
RESULTS
Participants’ baseline characteristics
First, we retrospectively included study participants according to their place of residence at the time of operation. Residents of the nuclear power plant area were selected from those who lived within 30 km of the Kori and Wolsong nuclear power plants (n=78). Residents of the inland area were selected from those who lived in Eunpyeong-gu, Seodaemun-gu, Jongno-gu, and Mapo-gu, Seoul, Korea (n=300). Residents of the coastal area far from the nuclear power plant were from Incheon city (n=134). Participants’ baseline characteristics according to their place of residence are presented in Supplemental Table S2.
To reduce the effect of confounding variables, we performed 1:1:1 propensity score matching using logistic regression for age, sex, and extent of surgical procedure (n=50 per group). As shown in Table 1, no significant difference was observed in clinicopathological characteristics, including radiation exposure history, family history of thyroid cancer, and the frequency of incidentally discovered thyroid cancer (incidentaloma) among the three groups.
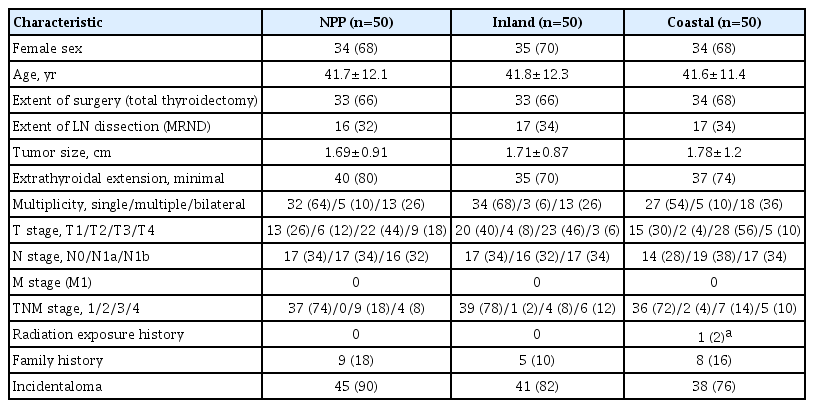
Participants’ Clinicopathological Characteristics according to Residential Area (Inland, Coastal, and Near NPP) after Propensity Score Matching
Comparison of driver mutation according to the place of residence
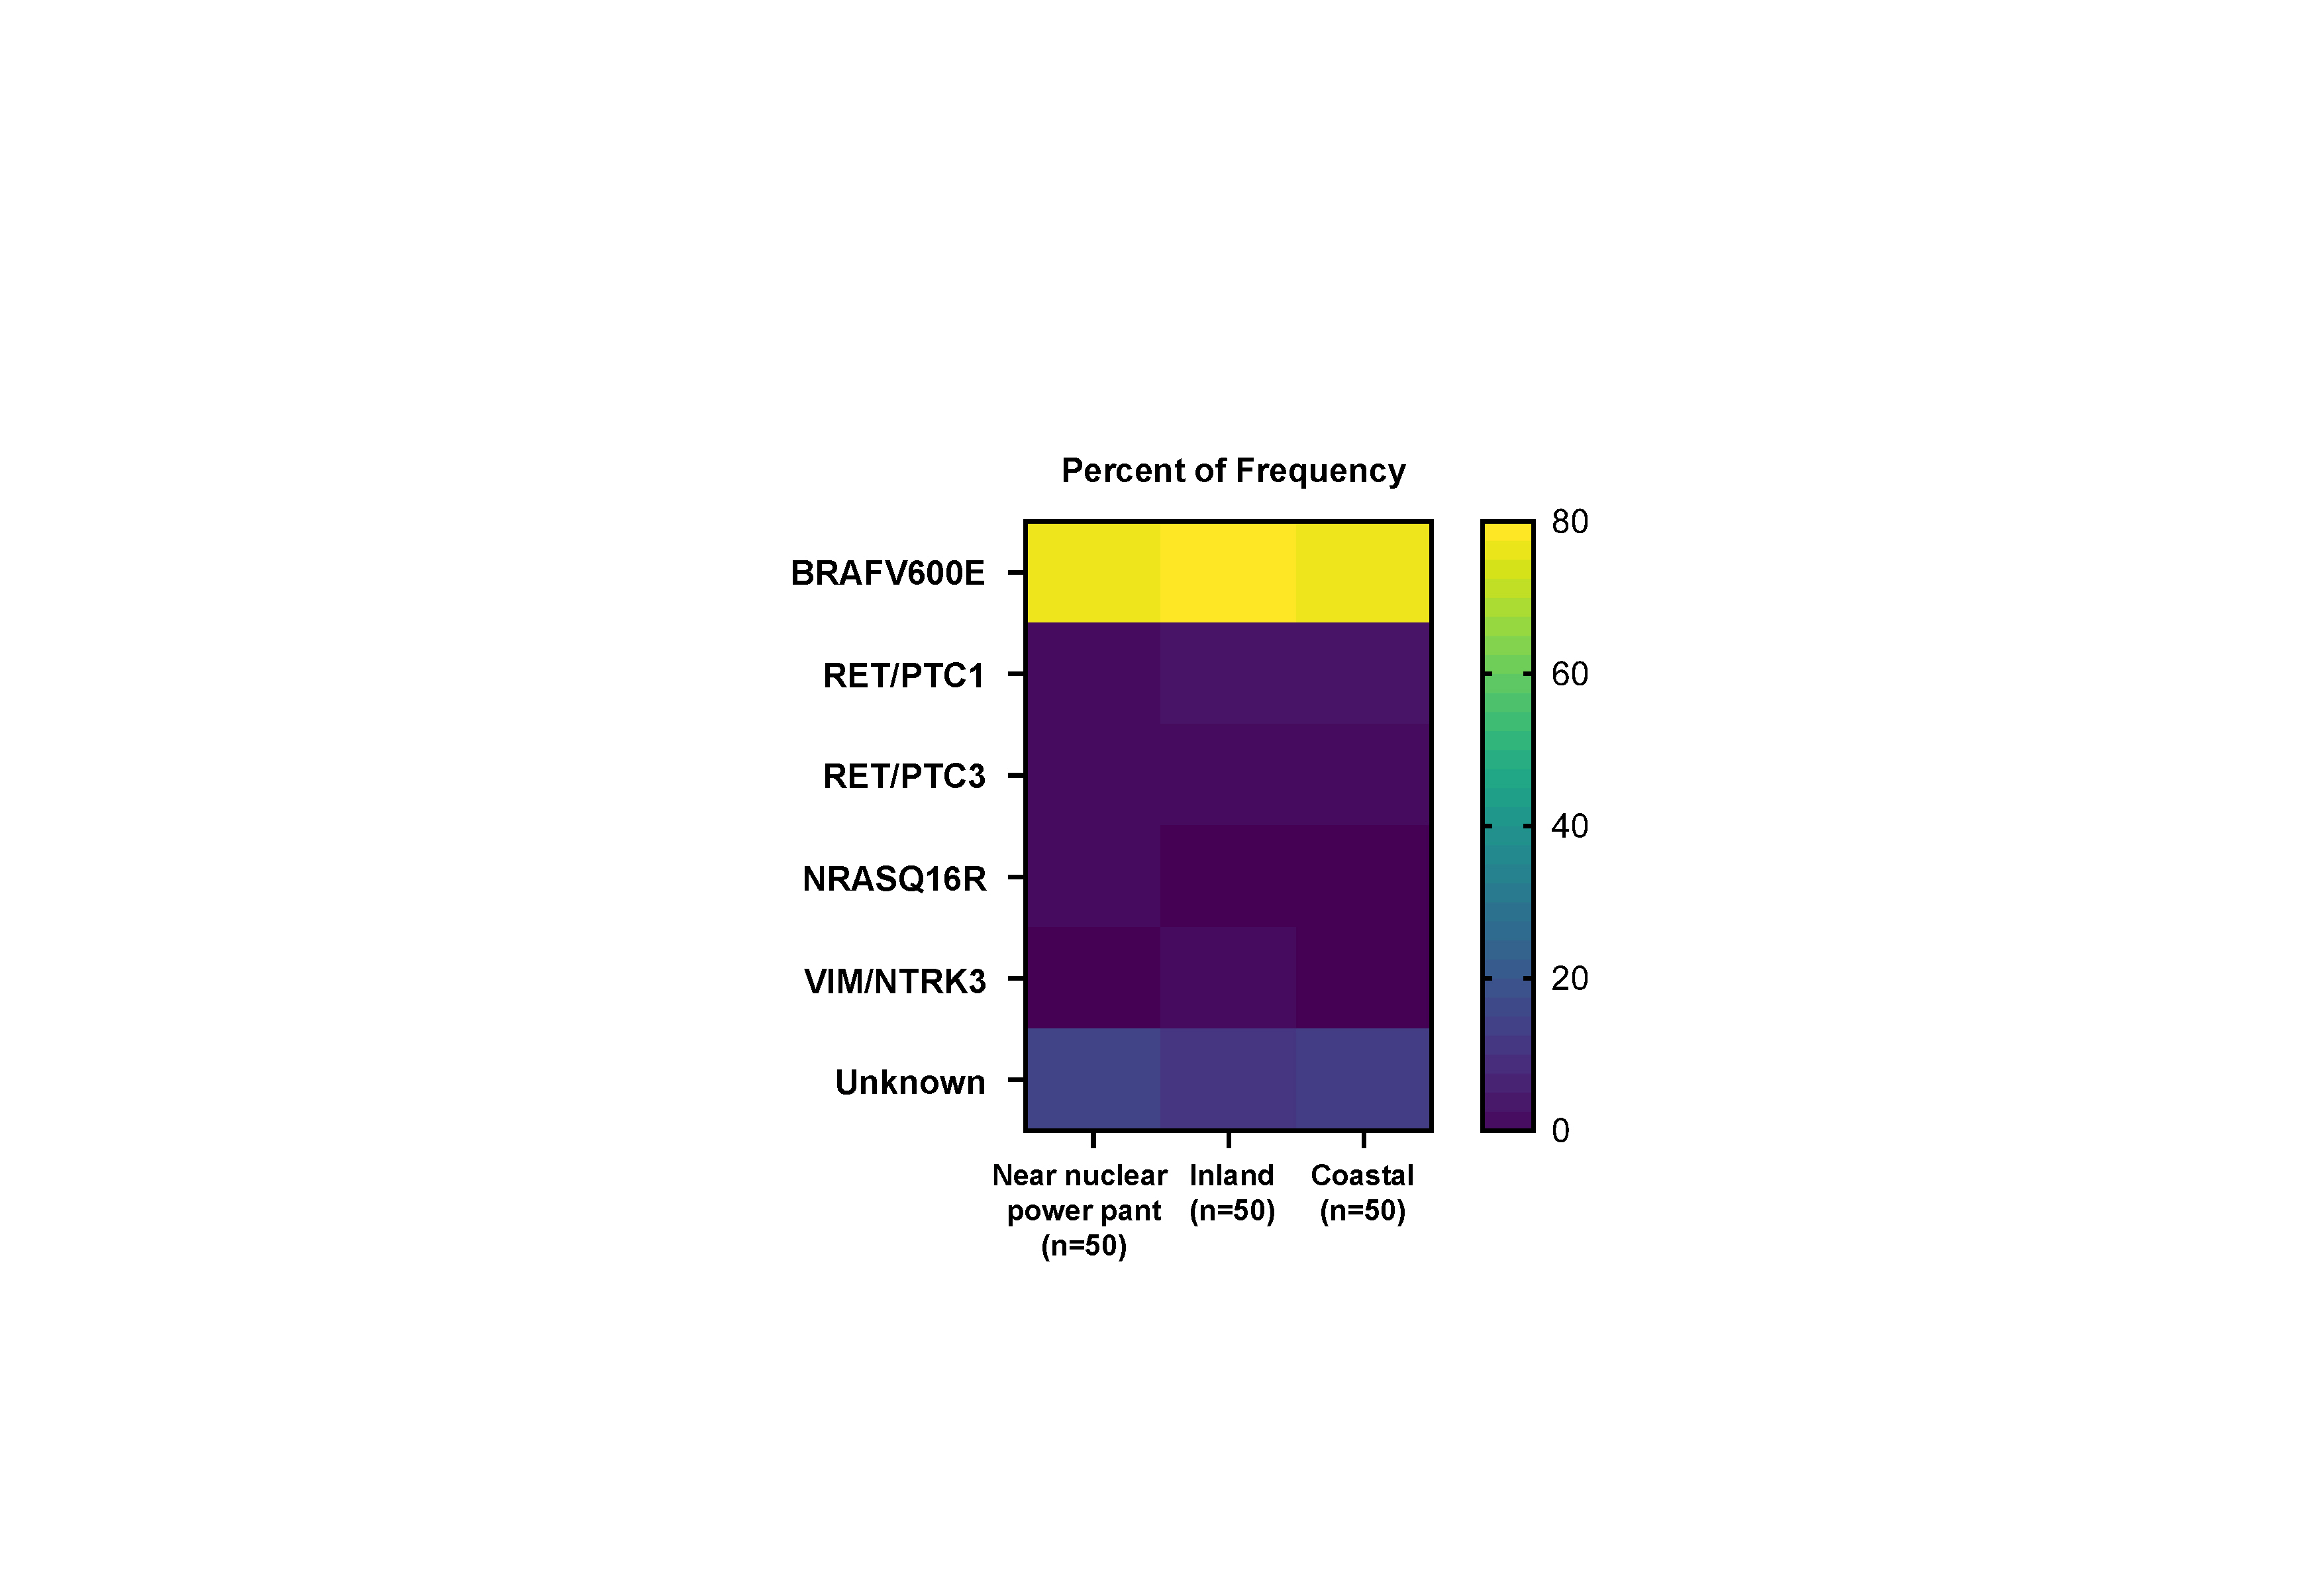
Representative driver genes, including point mutations and fusion genes, were analyzed to evaluate the difference in driver mutations. As shown in Table 2, BRAFV600E mutation was most frequently detected in all the groups, with no difference among the three groups. According to an analysis of the other point mutations, one NRASQ61R was found in the nuclear power plant group; however, it was statistically non-significant. According to the fusion gene analysis, eight cases harboring RET/PTC1 or RET/PTC3 were observed, with no difference among the three groups.

Comparative Analysis of the Frequency of Driver Mutations and Fusion Genes according to Residential Area (Inland, Coastal, and Near NPP)
Comparison of RNA expression according to the place of residence
To understand the biological characteristics of PTC according to the place of residence, we performed GSEA using bulk RNA sequencing. First, we compared gene expression between the inland area and the coastal area far from nuclear power plant groups. The inland area group was enriched in genes associated with the mitotic spindle and myc targets, whereas the coastal area group was enriched in genes associated with reactive oxygen species and xenobiotic metabolism. However, no statistically significant difference was observed (Fig. 1A, B). Furthermore, no significant difference was observed between the inland area and nuclear power plant groups and between the coastal area and nuclear power plant groups (Fig. 1C-F).
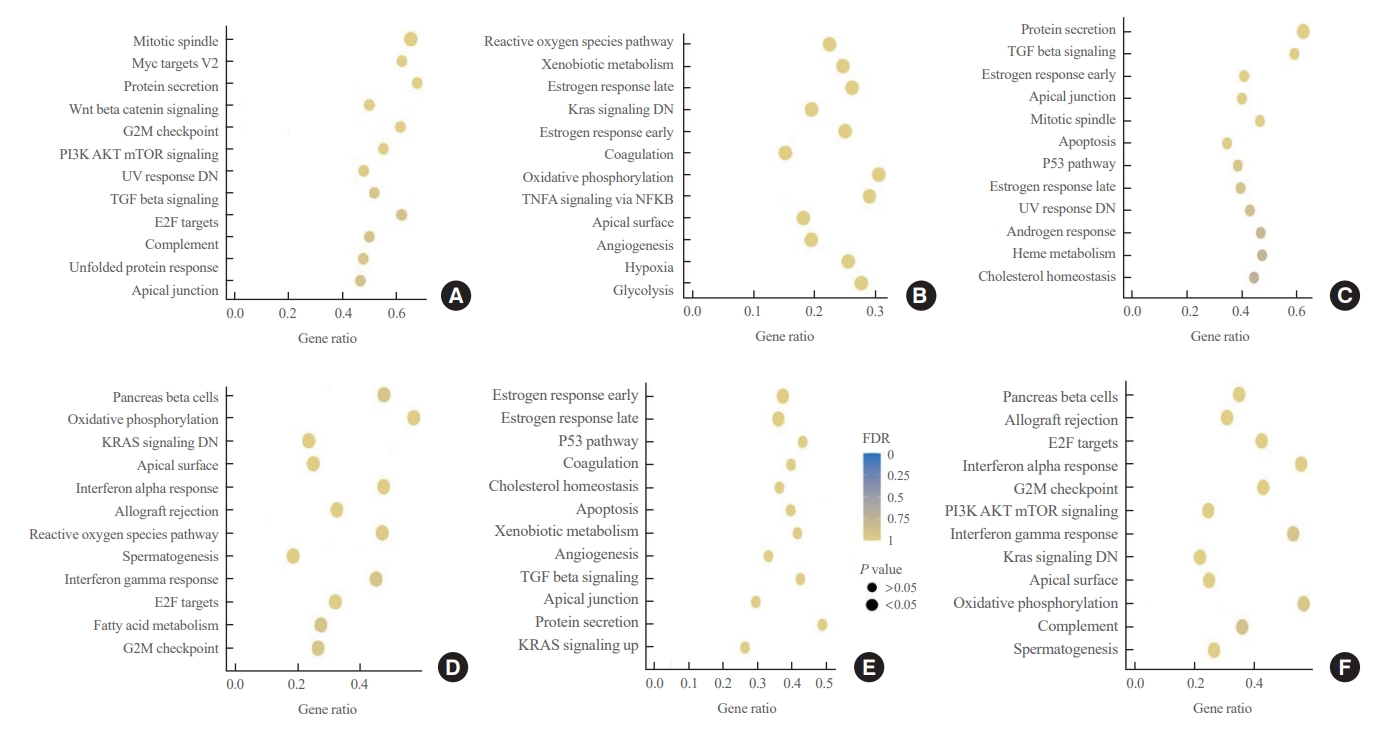
Dot plot for the gene set enrichment analysis (GSEA) results according to patients’ residential area (n=50 per group). GSEA presents gene sets enriched in the patient cohort in inland areas compared with that in coastal areas (A), patient cohort in coastal areas compared with that in inland areas (B), patient cohort in inland areas compared with that in areas near nuclear power plants (NPPs) (C), patient cohort in areas near NPPs compared with that in inland areas (D), patient cohort in coastal areas compared with that in areas near NPPs (E), and patient cohort in areas near NPPs compared with that in coastal areas (F). G2M, gap 2 mitosis; PI3K, phosphoinositide 3-kinase; mTOR, mammalian target of rapamycin; UV, ultraviolet; DN, down; TGF, transforming growth factor; E2F, E2F transcription factor; TNFA, tumor necrosis factor alpha; NFKB, nuclear factor kappa-light-chain-enhancer of activated B cells; FDR, false discovery rate.
Comparison of signature gene scores according to the place of residence
Finally, we generated and compared signature gene scores using genes associated with EMT, BRAF, TD, and radiation-induced damage. To achieve diverse data analysis, public repository data were used as control groups, including Chernobyl tissue bank and The Cancer Genome Atlas Thyroid Cancer (TCGA THCA). EMT scores were higher in the nuclear power plant, inland area, and coastal area groups than in the Chernobyl tissue bank and TCGA THCA groups. However, no difference was observed according to the place of residence (Fig. 2A). The results of the comparisons of BRAF scores were similar to those of the comparisons of EMT scores (Fig. 2B). TD scores were highest in the Chernobyl tissue bank group, followed by the TCGA THCA group (Fig. 2C). Radiation scores were also highest in the Chernobyl tissue bank group (Fig. 2D). Notably, no difference was observed in these signature gene scores according to the place of residence.
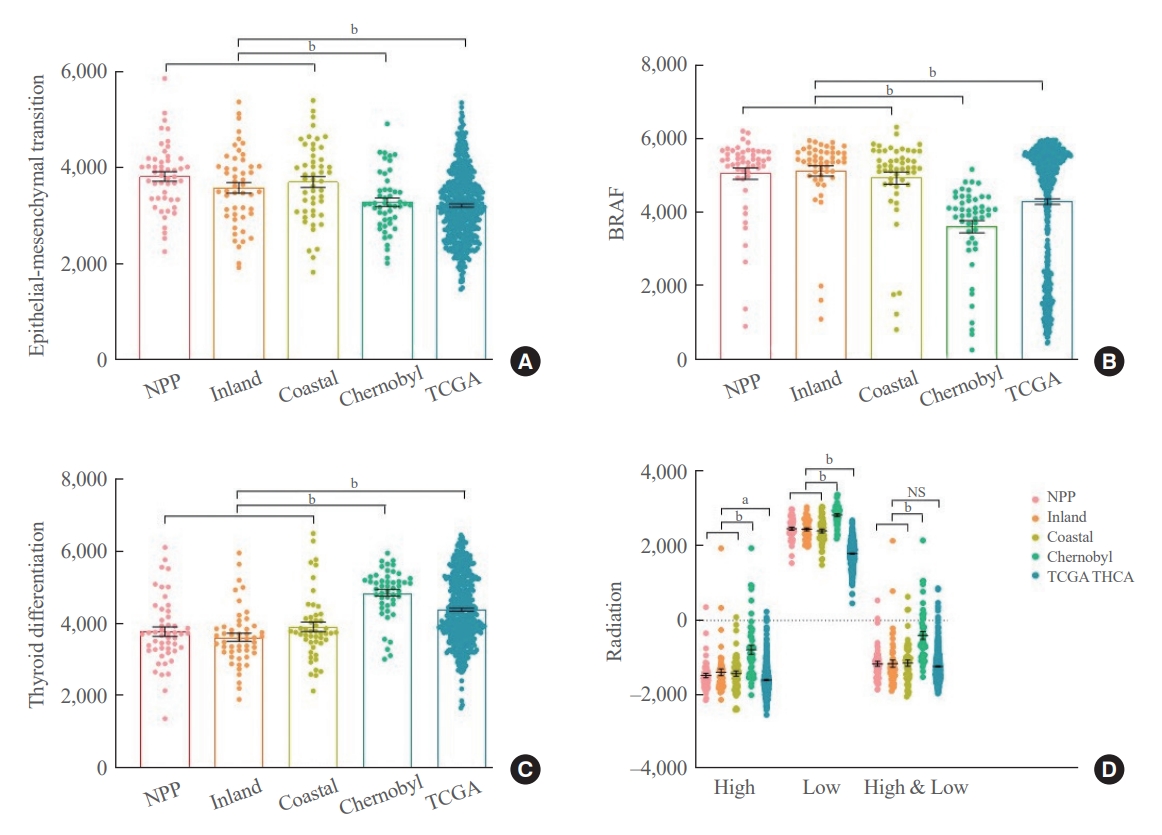
Comparisons of signature gene scores among our cohort, the Chernobyl tissue bank, and The Cancer Genome Atlas Thyroid Cancer (TCGA THCA). Scores representing the expression status of genes associated with epithelial-mesenchymal transition (A), BRAF (B), thyroid differentiation (C), and radiation exposure (D). Group comparisons were performed using Mann-Whitney U test and Student t test accordingly. Error bars are presented with standard errors of the mean. NPP, nuclear power plant. aP<0.05; bP<0.01.
DISCUSSION
In this study, we aimed to investigate the genomic and transcriptomic differences in patients with PTC according to the region of residence in South Korea. Therefore, we first performed direct sequencing to find representative driver gene mutations, such as BRAFV600E, NRASQ61R, HRASQ61R, KRASG12V, KRASQ61K, EIF1AXG9D, EIF1AXG9R, EIF1AXG8R, and CLIP2S17C [33,34]. As previously reported, the BRAFV600E mutation was most frequently detected, whereas the other point mutations were not observed except for NRASQ61R harbored in one PTC case. BRAFV600E mutation has been reported to result from low dose ionizing radiation and high iodide intake; however, the present study’s data did differ according to the region of residence. Next, we performed fusion gene analysis using bulk RNA sequencing data and found eight RET/PTC1 or three positive PTC cases. However, there was no difference according to geographic locations. RET/PTC1 and RET/PTC3 were representative genetic alterations induced by radiation exposure [20]. However, because these rearrangements have been reported sporadically independent from radiation [22], we postulated that these eight cases are associated with sporadic occurrence. Furthermore, we found two fusion genes: vimentin (VIM)/neurotrophic receptor tyrosine kinase 3 (NTRK3) and actinin alpha 1 (ACTN1)/BRAF. VIM/NTRK3 has been reported previously; however, ACTN1/BRAF is the first discovery [35]. The frequency of these rearrangements was too small, and the relationship with radiation exposure needs further investigation in future studies.
Before performing transcriptome analysis, we performed propensity score matching (1:1:1) to reduce the effect of some confounding variables, including age, sex, and surgical procedures. We postulated that concerns for radiation-induced cancer among patients in the nuclear power plant area could affect the early diagnosis rate or the incidence rate in men. The surgical method was matched as the possibility of finding indolent metastasis increases as the surgical range widens [36]. Thus, after correcting for differences in demographic features and intervention methods, we investigated the genomic and transcriptomic differences between groups. Notably, there were no differences in important clinicopathological factors, such as the prevalence of incidentally discovered PTC, radiation exposure, family history, tumor size, and tumor, node, and metastasis (TNM) stage before or after matching, among the groups [37]. Because the age of patients in inland areas was higher than that of those in the other two groups, we needed to perform propensity score matching. In addition, because bulk RNA sequencing is a relatively expensive research technique [38], it was challenging to completely enumerate all collected PTC cases. After matching, we performed bulk RNA sequencing using 50 cases per group and GSEA to determine whether priori-defined gene sets showed statistically significant differences according to the region of residence [39,40]. GSEA could compare only two groups; therefore, we compared two groups each. The results suggested that the expression of several gene sets differed between the groups; however, the difference was not statistically significant. Therefore, we concluded that the clinicopathological characteristics, driver mutation, and gene expression profiles were not different according to the region of residence.
To verify our finding, we further calculated signature gene scores using our bulk RNA sequencing data and public repository, including the Chernobyl tissue bank, a representative radiation-induced PTC model [41], and TCGA THCA, a representative sporadically occurred PTC model [33]. Our transcriptome data was generated using the Illumina NovaSeq platform, whereas transcriptome data from the Chernobyl tissue bank and TCGA THCA were generated using Affymetrix Human Genome U133 Plus 2.0 Array (Affymetrix, Santa Clara, CA, USA) and IlluminaGA_mRNA_DGE platform. Direct gene expression analysis, such as GSEA, was impossible because of these different data-generating platform technologies. In addition, to validate that the effect of radiation-induced carcinogenesis is not associated with tumor behavior in our cohort, we generated three radiation scores from previous studies [42]. The high, low, and high/low dose radiation scores included 34, 46, and 29 genes, respectively.
EMT and BRAF scores were higher in our cohort than that in the other two public repository cohorts, indicating that our cohort may have more biologically aggressive PTC. Furthermore, our cohort had the lowest TD scores, which represents differentiation status. However, there was no difference in these three scores according to the region of residence. The cohort from the Chernobyl tissue bank had the highest EMT, BRAF, and TD scores, whereas the cohort from TCGA THCA had the lowest scores. Radiation-related genes include many genes associated with DNA damage response. This represents radiation exposure-induced changes in gene expression profiles, as indicated in the present study’s results. However, it is also known that the expression of some of these genes increases with genetic damage induced by other factors generated by tumor progression [29,30]. These findings suggest that our cohort, which had lower scores than did the cohort from the Chernobyl tissue bank but higher scores than did the cohort from TCGA THCA, has a molecular biologically aggressive PTC among sporadic thyroid cancers, which provides an insight into understanding the molecular biology of PTC in Koreans.
Our study had some limitations. First, the retrospective nature of this study may pose various limitations that could introduce bias, and there was a lack of randomization. Although we conducted propensity score matching, it cannot account for unobserved confounders. Second, we could not prove the direct relationship between the region of residence and radiation exposure. Notwithstanding, like the Korea Radiation Effect and Epidemiology Cohort (KREEC), we also classified an around area as within 5 km, an intermediate proximate area as 5 to 30 km, and a far-distance area as more than 30 km [31,32] and drew comparisons according to these distances. Third, residence information provided by the patients may be inaccurate, even though we included patients with no change of residence on their medical records. Fourth, our study could not investigate patient exposure levels by residence area. However, according to the World Nuclear Association, the annual exposure for people living within a few kilometers of a nuclear power plant is 0.001 mSV. This appears to be a low dose, compared to the amount exposed by flying from New York to Tokyo (0.1 mSV) and typical chest X-ray exposure (0.1 mSV) (https://www.world-nuclear.org/). Finally, owing to funding constraints, bulk RNA sequencing has not been performed in large numbers. Regarding the safety of nuclear power plants, a study that establishes and prospectively tracks a cancer registry is required in the future.
In conclusion, we compared clinicopathological characteristics, frequency of representative driver mutations, and gene expression profiles according to the patients’ region of residence in South Korea. Notably, some data supporting the understanding of the molecular biological characteristics of PTC in Koreans were identified; however, regional differences were not observed.
Supplementary Material
Supplemental Table S1.
Gene Lists Used to Generate Radiation Scores
Supplemental Table S2.
Clinicopathological Characteristics of Patients with Fresh Samples according to Residential Area (Inland, Coastal, and Near NNP)
Supplemental Fig. S1.
Comparison of the results between RNA sequencing and quantitative reverse transcription polymerase chain reaction for IL17A (A) and neurotrophic receptor tyrosine kinase (TRK) (B). The following primers were used: 5´-AGA TTA CTA CAA CCG ATC CAC CT-3´ (sense) and 5´-GGG GAC AGA GTT CAT GTG GTA-3´ (antisense) for IL17A; 5´-GCT GGC TCT TCA ATG GCT C-3´ (sense) and 5´-GTG TAG TTG CCG TTG TTG ACG-3´ (antisense) for TRK. All P values were calculated by Mann-Whitney U test. IL17, interleukin 17 (cytotoxic T-lymphocyte-associated serine esterase 8); NPP, nuclear power plants; NS, non-significant.
Notes
CONFLICTS OF INTEREST
This study was funded by the Radiation Health Institute of Korea Hydro & Nuclear Power (A19LP20). No potential conflict of interest relevant to this article was reported.
AUTHOR CONTRIBUTIONS
Conception or design: J.L., M.J., Y.S.J. Acquisition, analysis, or interpretation of data: J.L., S.J., H.Y.L., S.P. Drafting the work or revising: J.L., M.J., Y.S.J. Final approval of the manuscript: J.L., S.J., H.Y.L., S.P., M.J., Y.S.J.
Acknowledgements
Young Suk Jo was supported by the Korean Thyroid Association Basic Medical Research Award 2022.