Clinicopathological Features and Molecular Signatures of Lateral Neck Lymph Node Metastasis in Papillary Thyroid Microcarcinoma
Article information

Abstract
Background
The predictive factors for lateral neck lymph node metastasis (LLNM) in papillary thyroid microcarcinoma (PTMC) remain undetermined. This study investigated the clinicopathological characteristics, transcriptomes, and tumor microenvironment in PTMC according to the LLNM status. We aimed to identify the biomarkers associated with LLNM development.
Methods
We retrospectively reviewed the medical records of patients with PTMC from two independent institutions between 2018 and 2022 (n=597 and n=467). We compared clinicopathological features between patients without lymph node metastasis (N0) and those with LLNM (N1b). Additionally, laser capture microdissection and RNA sequencing were performed on primary tumors from both groups, including metastatic lymph nodes from the N1b group (n=30; 20 primary tumors and 10 paired LLNMs). We corroborated the findings using RNA sequencing data from 16 BRAF-like PTMCs from The Cancer Genome Atlas. Transcriptomic analyses were validated by immunohistochemical staining.
Results
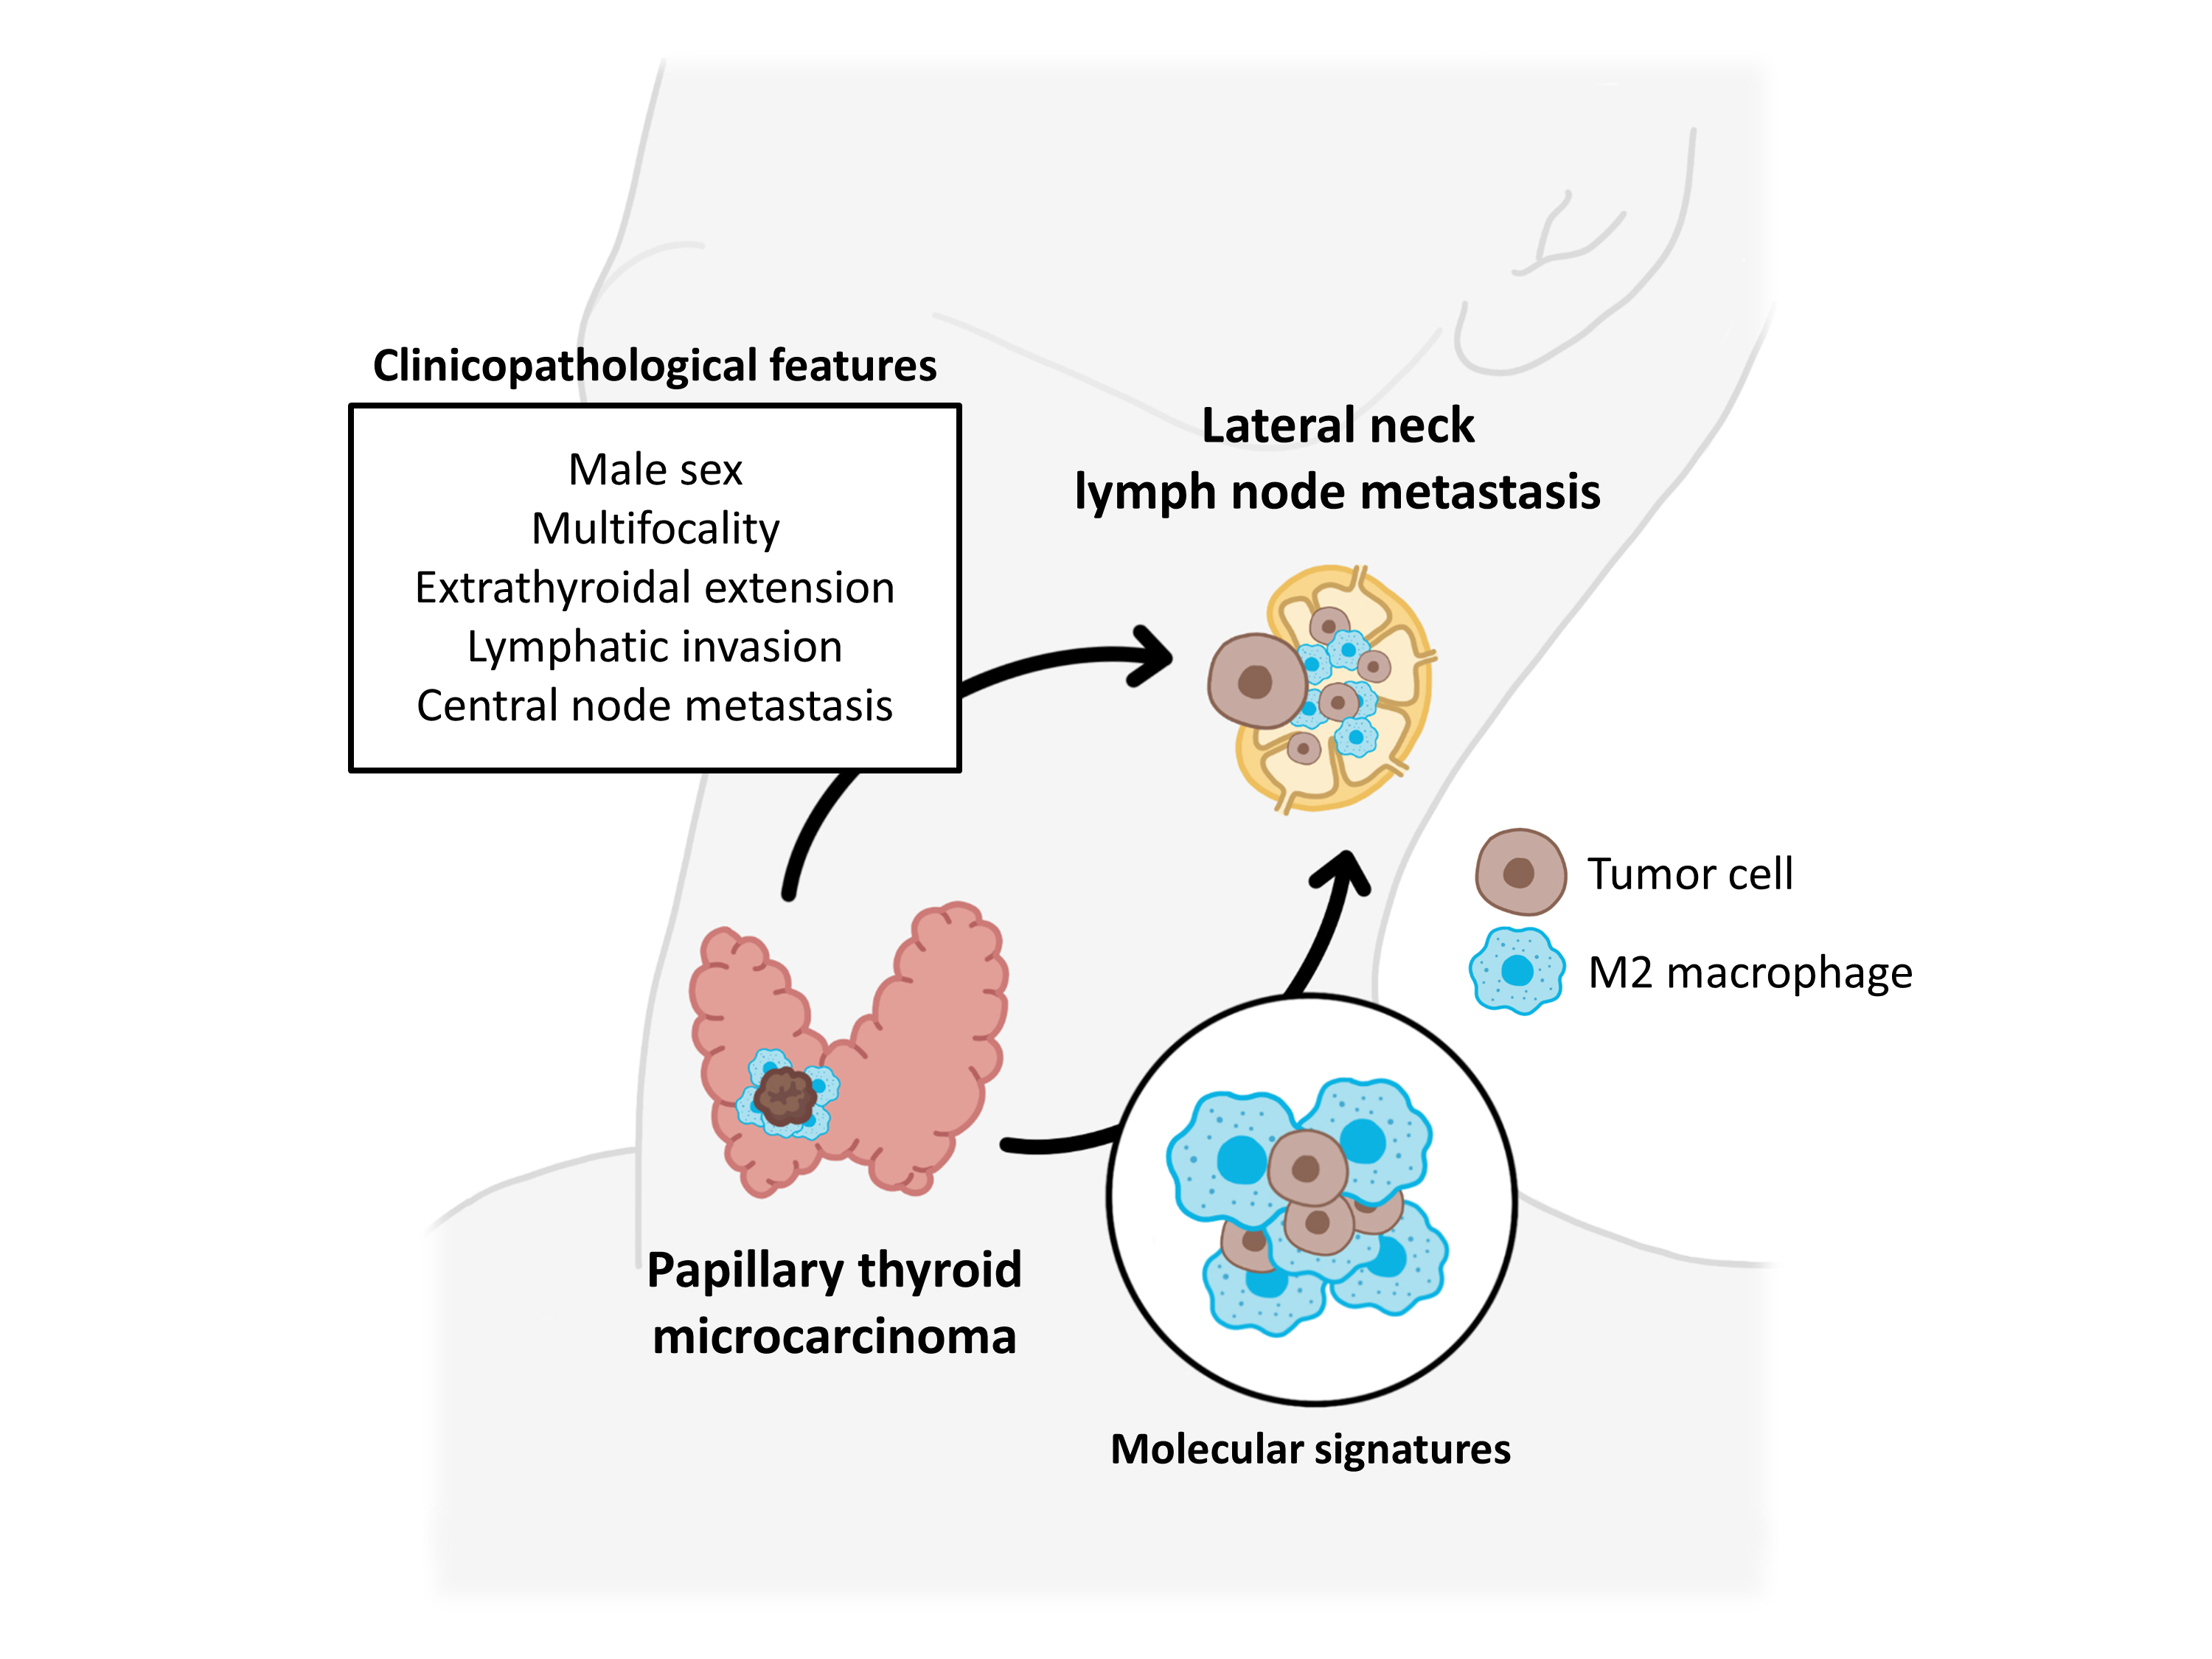
Clinicopathological characteristics, such as male sex, multifocality, extrathyroidal extension, lymphatic invasion, and central node metastasis showed associations with LLNM in PTMCs. Transcriptomic profiles between the N0 and N1b PTMC groups were similar. However, tumor microenvironment deconvolution from RNA sequencing and immunohistochemistry revealed an increased abundance of tumor-associated macrophages, particularly M2 macrophages, in the N1b group.
Conclusion
Patients with PTMC who have a male sex, multifocality, extrathyroidal extension, lymphatic invasion, and central node metastasis exhibited an elevated risk for LLNM. Furthermore, infiltration of M2 macrophages in the tumor microenvironment potentially supports tumor progression and LLNM in PTMCs.
INTRODUCTION
Papillary thyroid microcarcinoma (PTMC), defined as papillary thyroid carcinoma (PTC) with a maximal diameter of 10 mm or less, typically exhibits an indolent course and favorable prognosis. Recent thyroid cancer guidelines propose active surveillance as an alternative to immediate surgery for low-risk PTMC [1-5]. However, up to 10% of patients with PTMC experience lateral neck lymph node metastasis (LLNM) [6-8]. LLNM necessitates more extensive surgery and additional postoperative therapy, thereby increasing the risk of complications and reducing overall quality of life. Moreover, in a large retrospective study, while distant metastasis in PTMC was rare, the majority of patients with distant metastasis were found to have LLNM, indicating a heightened risk of disease-specific mortality [9].
Various clinicopathological characteristics, such as young age, male sex, larger tumor size, presence of extrathyroidal extension, and aggressive pathological subtypes have been proposed as risk factors for nodal metastasis in PTMC [10-12]. Nevertheless, the identification of biomarkers predictive of LLNM development in PTMC remains elusive. The Japanese Association of Endocrine Surgery has underscored the absence of reliable molecular markers associated with aggressive features or clinical outcomes of PTMC, highlighting the necessity for further research [4].
This study investigated the clinicopathological characteristics, gene signatures, and tumor microenvironment in PTMC according to LLNM status. We aimed to identify potential clinicopathological and molecular biomarkers of LLNM development in PTMC.
METHODS
Patients and tissue samples
We reviewed the medical records of 597 patients with PTMC who underwent thyroidectomy between January 2018 and December 2022 at CHA Bundang Medical Center (CHA), as well as 467 at Seoul Metropolitan Government Seoul National University Boramae Medical Center (BMC). Patients were categorized based on their lymph node metastasis (LNM) status. To discern clinicopathological predictive factors for LLNM in PTMC, we compared clinicopathological characteristics between patients with LLNM (N1b group) and those without LNM (N0 group).
For the identification of molecular biomarkers associated with LLNM in PTMC, RNA sequencing analysis was performed on primary cancers from the N0 and N1b groups, as well as paired metastatic lymph nodes from the same patients in the N1b group, using the CHA dataset (n=30; comprising 20 primary cancers and 10 corresponding metastatic cancers with LLNM). We included the cases that met following criteria: (1) To minimize the influence of factors other than LLNM, we rigorously matched potential confounders, such as primary tumor size, extrathyroidal extension, presence of thyroiditis, and BRAFV600E mutation between the N0 and N1b groups. Moreover, it is worth noting that the transcriptomic profile of PTC can be classified into BRAF-like (BL) and RAS-like (RL) molecular subtypes, which exhibit significant dissimilarities [13]. Thus, only samples demonstrating the BL molecular subtype were considered for inclusion in the RNA sequencing analysis. (2) To obtain the required amount of RNA for sequencing, N1b PTMCs with LLNM measuring 3 mm or larger in size were included. (3) Lastly, all three matched samples (N1b primary tumor, metastatic lymph nodes, and matched N0 primary tumor) met the quantity and quality standards for RNA sequencing analysis. Ultimately, a total of 20 patients, 10 each from the N0 and N1b groups, were selected.
Additionally, RNA sequencing data were obtained from The Cancer Genome Atlas (TCGA) database (http://portal.gdc.cancer.gov/), and corresponding clinicopathological information was retrieved from cBioportal (https://www.cbioportal.org/) [14]. Out of the total 505 PTC samples in the TCGA database, there were only 32 cases which were identified as having PTMC. Among them, 18 and 14 samples were BL and RL subtypes, respectively, and there were no N1b samples within the RL-PTMC group. Consequently, only BL-PTMC samples consistent with our dataset were included in the RNA sequencing analysis (n=12 for the N0 group and n=6 for the N1b group). The clinicopathological characteristics of the patients selected for RNA sequencing analysis are summarized in Supplemental Table S1.
Within the CHA dataset, subsequent immunohistochemical (IHC) staining was conducted. Among the 10 N1b and the matched 10 N0 samples used for RNA sequencing analysis, there were a total of 12 samples, six from each group, with sufficient tumor tissue remaining in formalin-fixed, paraffin-embedded (FFPE) blocks for subsequent IHC staining. However, one N1b sample was excluded due to extensive tumor fibrosis, and additional samples were included for statistical testing, resulting in a total of 25 patients for IHC analysis, comprising 13 individuals in the N0 group and 12 in the N1b group. Detailed clinicopathological characteristics of patients involved in the IHC analysis can be found in Supplemental Table S2. The clinicopathological characteristics of N1b patients included in RNA sequencing and IHC analyses were not significantly different from those of the total N1b patients in the CHA dataset (Supplemental Table S3).
This study received approval from the Institutional Review Boards of both CHA (No. 2020-12-012) and BMC (No. 10-2023-89). Informed consent was waived by the boards.
RNA extraction using laser capture microdissection and ultrasonication
RNA sequencing was conducted on FFPE tissues within the CHA dataset. Laser capture microdissection was employed to precisely isolate small cancer tissues from both the thyroid and paired metastatic lymph nodes. To ensure improved quantity and quality of RNA extraction from these small tissue sections obtained through laser capture microdissection, ultrasonication was incorporated into the RNA extraction process. Tissue blocks, prepared with 10 µm thick sections, were affixed on specific membrane slides designed for laser capture microdissection (MembraneSlide NF 1.0 PEN, Zeiss, Oberkochen, Germany) and subsequently underwent hematoxylin and eosin staining. The ZEISS PALM CombiSystem (Zeiss) was utilized for laser dissection, meticulously separating the cancerous tissue from the underlying normal tissue, as depicted in Supplemental Fig. S1. RNA extraction from tissues isolated through laser capture microdissection was accomplished using the truXTRAC FFPE RNA microTUBE Kit in conjunction with ultrasonication (Covaris, Boston, MA, USA).
RNA sequencing, differentially expressed genes, and functional enrichment analyses
The RNA library was prepared using the SureSelectXT RNA Direct Reagent Kit (Agilent Technologies Inc., Santa Clara, CA, USA) and subsequently sequenced on an Illumina NovaSeq platform (Illumina Inc., San Diego, CA, USA) at Macrogen (Seoul, Korea). The obtained data underwent preprocessing to eliminate residual adapter sequences, followed by read trimming using Trimmomatic. For alignment with the human reference genome (Ensembl/hg38), the STAR aligner was employed to align the preprocessed mRNA FASTQ files. Gene counts were quantified using RNA-seq by expectation maximization (RSEM) with default parameters.
Differential expression analysis was conducted utilizing the DESeq2 package [15]. The raw read counts were normalized by the regularized-logarithm (rlog) transformation method. P values were adjusted to q-values for multiple comparisons using the Benjamini-Hochberg method. Genes with |log2(fold change)| ≥1 and q-value <0.05 were considered differentially expressed and were visualized by volcano plots. To identify biological themes and molecular pathways that were significantly enriched in the differentially expressed genes (DEGs), Gene Ontology, and Kyoto Encyclopedia of Genes and Genomes pathway analyses were performed using the DAVID database (https://david.ncifcrf.gov/) [16]. Additionally, the thyroid differentiation score (TDS) was calculated based on the expression levels of 16 genes associated with thyroid metabolism and function. This was achieved by estimating the average of the median-centered and regularized log-normalized values across the 16 thyroid-specific genes [13].
Deconvolution of the tumor microenvironment
To explore the cell types present in tumors and their adjacent microenvironment, CIBERSORTx (https://cibersortx.stanford.edu/) was applied using transcripts per million normalized expression as the input data file [17]. CIBERSORTx was run in relative mode using two signature matrices: TR4 and LM22 [17,18]. TR4, a signature matrix consisting of epithelial cells, immune cells, fibroblasts, and endothelial cell populations, was used to calculate the major cellular components in the tumors. Meanwhile, LM22, composed of 22 immune cell types, was employed to deconvolve bulk immune cells. To adjust for the effects of immune cell population abundance, the fractions of each immune cell type estimated by LM22 were multiplied by the immune content estimated by TR4. Furthermore, for the M2 score, which reflects the abundance of M2 macrophages, single-sample gene set enrichment analysis was conducted based on the expression levels of M2 macrophage-associated signatures [19]. Enrichment scores were calculated using gene set variation analysis [20].
Immunohistochemical staining
For the identification of macrophages, CD68 was utilized as a pan-macrophage marker, while CD163 served as a specific marker for M2 macrophages. IHC staining for CD68 (1:100, PG-M1, Dako Cytomation, Carpinteria, CA, USA) and CD163 (ready-to-use, MRQ-26, Cell Marque, Rocklin, CA, USA) was performed on FFPE tissue sections using the BenchMark ULTRA Slide Staining System (Ventana Medical Systems, Tucson, AZ, USA) following the manufacturer’s instructions. After IHC staining, the proportion of CD68-positive or CD163-positive areas within each sample was evaluated using previously described methods [21]. Specifically, the core area of each tissue was divided into quarters, and five fields were randomly selected from the central area and each quarter at ×200 magnification (Supplemental Fig. S2). Areas with tumor necrosis and fibrosis were excluded from the analysis. The Color Deconvolution2 plug-in within ImageJ version 1.53t software (National Institutes of Health, Bethesda, MD, USA) was used to separate the diaminobenzidine-positive areas. Density of macrophages was determined by calculating the average positive area (%) of five selected areas in each tissue sample.
Statistical analysis
Statistical analyses were performed using R version 4.1.2 (R Foundation for Statistical Computing, Vienna, Austria). Continuous data underwent normality assessment using the Kolmogorov-Smirnov method. Normally distributed data are expressed as means with standard deviations, while non-normally distributed data are presented as medians with interquartile ranges (IQR). For statistical comparisons, the independent t test, the one-way analysis of variance, the Wilcoxon rank-sum test, or the Kruskall-Wallis test was employed as appropriate. Categorical data are presented as counts with percentages and were analyzed using Pearson’s chi-square test or Fisher’s exact test (if the number was <5). All reported P values were two-tailed, and statistical significance was set at P<0.05.
RESULTS
Clinicopathological characteristics of N1b compared to N0 PTMC
To determine clinicopathological biomarkers associated with LLNM, we compared the clinicopathological characteristics between the N0 and N1b groups of patients with PTMC at the CHA and BMC institutions (Table 1).
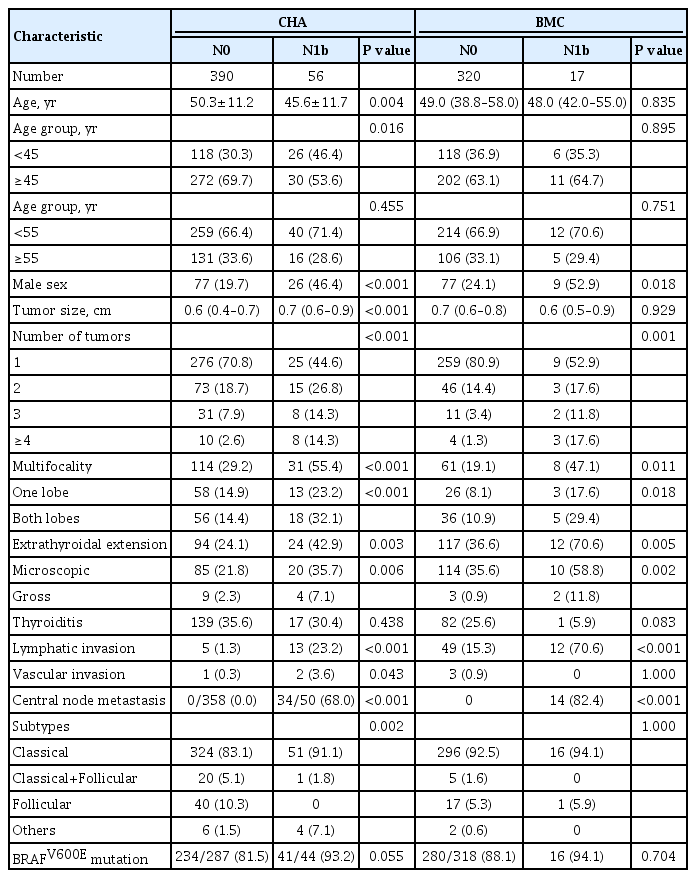
Clinicopathologic Characteristics of Patients with Papillary Thyroid Microcarcinoma according to Lateral Neck Lymph Node Metastasis Status
Among all patients in the CHA dataset, 390 (65.3%) had no LNM and 56 (9.4%) had LLNM. The mean age in the N1b group was significantly younger (45.6±11.7 vs. 50.3±11.2, P=0.004), and the proportion of patients younger than 45 years was higher in the N1b group than in the N0 group (46.4% vs. 30.3%, P=0.016). However, no significant difference was observed in the proportion of patients aged <55 years between the two groups (P=0.455). Median tumor size was larger in the N1b group (0.7 cm; IQR, 0.6 to 0.9) than in the N0 group (0.6 cm; IQR, 0.4 to 0.7) (P<0.001). The incidences of multifocality, extrathyroidal extension, lymphatic invasion, vascular invasion, and central lymph node metastasis (CLNM) were higher in the N1b group (P<0.001, P=0.003, P<0.001, P=0.043, and P<0.001, respectively), while no significant difference was found in the occurrence of lymphocytic thyroiditis (P=0.438). Additionally, the proportion of patients diagnosed with the classical subtype was higher in the N1b group than in the N0 group (P=0.002). The prevalence of the BRAFV600E mutation as determined by direct sequencing or IHC was higher in the N1b group than in the N0 group (93.2% vs. 81.5%, respectively), but the difference was not significant (P=0.055).
In the BMC dataset, 320 (68.5%) and 17 (3.6%) patients were classified into the N0 and N1b groups, respectively. The N1b group was significantly associated with a higher proportion of males, multifocality, extrathyroidal extension, lymphatic invasion, and CLNM (P=0.018, P=0.011, P=0.005, P<0.001, and P<0.001, respectively). In comparison with the CHA dataset, no significant differences were observed in age at diagnosis, tumor size, presence of vascular invasion, or histological variants.
Transcriptomic characteristics of N1b compared with N0 PTMC
To delineate transcriptomic biomarkers associated with LLNM, DEG analysis was conducted using RNA sequencing data from the CHA cohort (n=10 for the N0 group and n=10 for the N1b group) and the TCGA cohort (n=26 for the N0 group and n=6 for the N1b group). Analysis of the CHA database revealed nearly identical gene expression profiles in PTMCs between the N0 and N1b groups (Supplemental Fig. S3A). Similar findings were observed in BL-PTMCs from the TCGA database (n=12 for the N0 group and n=6 for the N1b group) (Supplemental Fig. S3B). Due to the scarcity of DEGs, there were no enriched pathways for these genes. When we expanded the DEG analysis to include BL-PTC and RL-PTC in the TCGA database, encompassing tumors larger than 1 cm, the extracellular matrix-related genes and pathways were significantly activated in the N1b group of BL-PTC (Supplemental Table S4, Supplemental Fig. S3C, E). In contrast, there were few DEGs and no significant pathways identified in RL-PTC (Supplemental Fig. S3D).
Furthermore, TDS calculations were performed to compare the differentiation of thyroid cells. No significant differences in the TDS of PTMCs were observed between the N0 and N1b groups in either the CHA or TCGA databases (P=0.834 and P=0.066, respectively) (Supplemental Fig. S4).
Based on the results of DEG analyses, there was no difference in the transcriptomic profile between the N0 and N1b groups in BL-PTMC, in contrast to that observed in BL-PTC. Consequently, we further conducted a deconvolution analysis to explore alterations in the tumor microenvironment.
Tumor microenvironment of N1b compared to N0 PTMC
Subsequently, we compared the characteristics of the tumor microenvironment between the N0 and N1b groups. The relative proportions of malignant epithelial cells, immune cells, fibroblasts, and endothelial cells did not differ between the two groups in either the CHA or TCGA databases (Supplemental Figs. S5, S6). In the CHA database, a higher abundance of M0 macrophages and resting mast cells was noted in the N1b group than in the N0 group (P=0.042 and P=0.029, respectively) (Supplemental Fig. S5). Conversely, the TCGA database did not show significant differences in specific immune cell types between the N0 and N1b groups (Supplemental Fig. S6). While there was no statistically significant variance in the abundance of M2 macrophages between the N0 and N1b groups, a consistent trend was observed across both databases (Fig. 1A, D and Supplemental Figs. S5, S6).

M2 macrophage infiltration compared between N1b and N0 primary cancers (PCs) of papillary thyroid microcarcinomas (PTMCs). (A) The abundance of M2 macrophages, (B) the M2 score, and (C) the expression of M2 macrophage markers in the CHA Bundang Medical Center (CHA) database. (D) The abundance of M2 macrophages, (E) the M2 score, and (F) the expression of M2 macrophage markers in The Cancer Genome Atlas (TCGA) database. BL, BRAF-like.
Consequently, our focus turned toward investigating M2 macrophages. Calculation of the M2 score to assess M2 macrophage infiltration revealed an increasing trend in the N1b group, although statistical significance was observed in neither the CHA nor TCGA databases (P=0.063 and P=0.553, respectively) (Fig. 1B, E). Additionally, most M2 macrophage markers exhibited higher expression levels in the N1b group (Fig. 1C, F).
Although differences in M2 macrophage abundance were observed through deconvolution and scoring analyses using RNA sequencing data, the differences were not significant. Therefore, we validated these findings by performing IHC staining on tumor sections for CD68 and CD163, well-recognized markers of tumor-associated macrophages (TAMs). The average CD68-positive area was 4.14%±1.66% in the N0 group and 5.70%±2.08% in the N1b group (P=0.048) (Fig. 2A, B). Similarly, the average CD163-positive area was 3.95%±1.74% in the N0 group and 6.70%±3.32% in the N1b group (P=0.016) (Fig. 2C, D). These findings demonstrate a significant increase in TAMs, particularly M2 macrophages, within the N1b group compared to the N0 group.
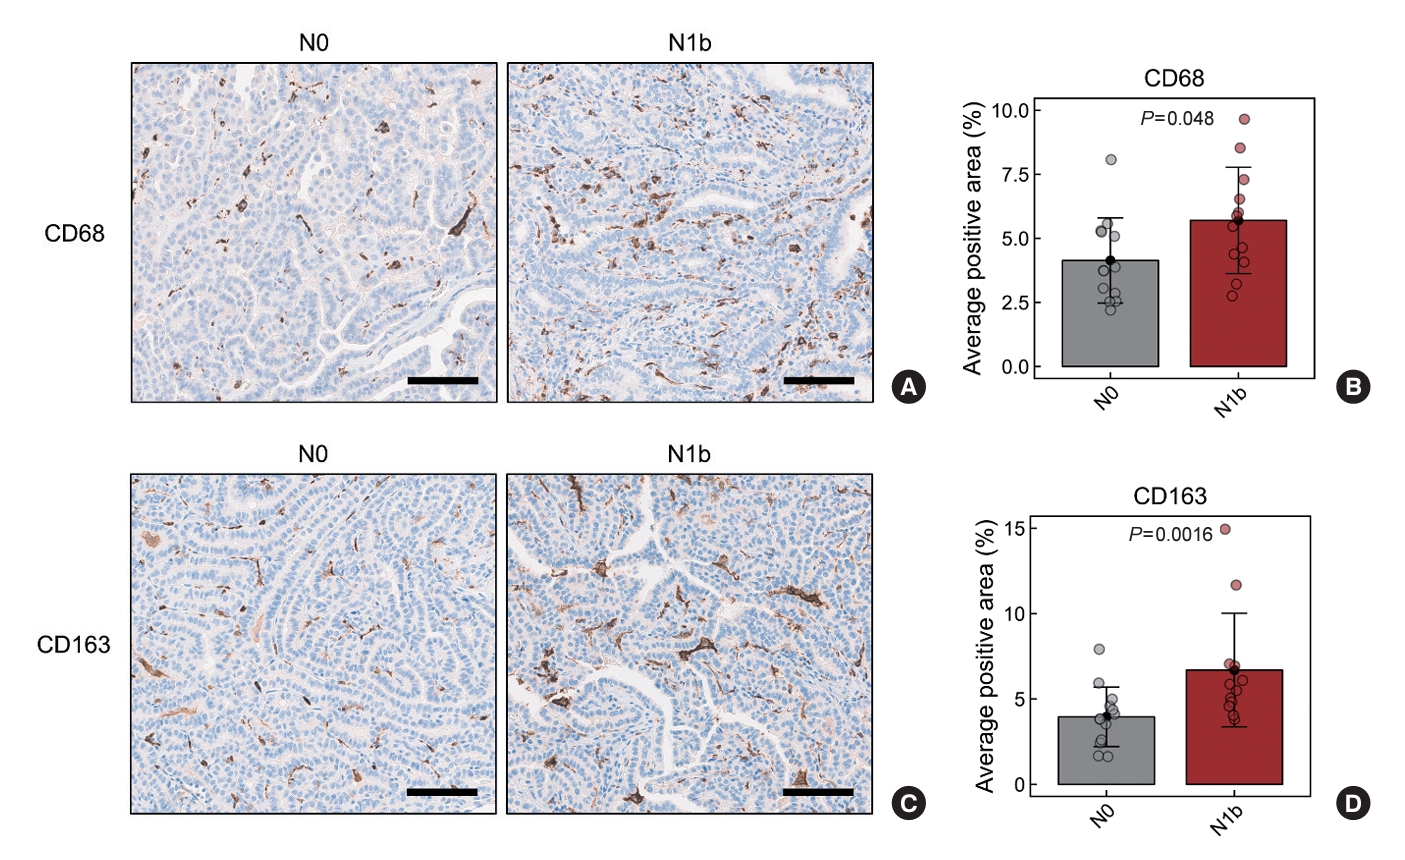
Immunohistochemistry analysis of CD68 (pan-macrophage marker) and CD163 (M2 macrophages marker) in papillary thyroid microcarcinomas (PTMCs). (A, B) CD68-positive and (C, D) CD163-positive macrophage densities in PTMCs. (A, C) Representative images of immunohistochemical staining (200× magnification). The scale bar is 100 µm. (B, D) Statistical analysis of the average positive area in the N0 and N1b PTMCs.
DISCUSSION
This study investigated clinicopathological characteristics, gene signatures, and tumor microenvironments of PTMCs based on their LLNM status. Male sex, multifocality, extrathyroidal extension, lymphatic invasion, and CLNM were found to be associated with LLNM in PTMCs. Transcriptomic profiles of PTMCs were nearly identical between the N0 and N1b groups. However, upon deconvolution of the tumor microenvironment, infiltration by M2 macrophages was increased in the N1b group. These findings were validated by IHC staining of TAMs.
Multiple studies have examined clinicopathological characteristics related to LLNM in PTMC, but the results have varied. A recent study reported that tumor size greater than 0.5 cm, multifocality, bilaterality, extrathyroidal extension, and CLNM were significantly associated with LLNM [22], while another study identified age younger than 50 years, male sex, tumor location, and the presence of microcalcification as notable risk factors [10]. Additionally, a cutoff age of 45 years, aggressive histological variants, number of CLNMs, and capsular invasion have been proposed as potential risk factors for LLNM [11,12, 23,24]. In the present study, patients with male sex, tumor multifocality, extrathyroidal extension, lymphatic invasion, and CLNM had a higher risk of LLNM, which corresponds well with the previous findings. The prevalence of the BRAFV600E mutation, the major driver of PTC, was substantially high in both the N0 and N1b groups, with no statistically significant difference; however, it tended to be higher in the N1b group. In a recent meta-analysis of 33 studies on PTMC, there was a tendency for an increased risk of LLNM in BRAFV600E-mutated PTMC, although it did not reach statistical significance [25], which is consistent with our study.
In our research, there were no major transcriptomic changes according to LLNM in PTMC. Recent studies of targeted next-generation sequencing have demonstrated that genetic alterations may play a minor role in LNM of PTMC [26,27]. Our previous study showed that there were no significant genomic or transcriptomic changes according to tumor size in PTMC [28]. These findings imply that epigenetic alterations or variations in the tumor microenvironment might be involved in the process of LNM and progression of PTMC. Epigenetic regulation has been associated with LNM in several cancers, including PTCs [29-31]. Further studies focusing on epigenetic alterations related to LNM in PTMC are needed.
Previous studies investigating the tumor microenvironment in PTCs have reported the correlation between M2-like TAM infiltration and both tumor aggressiveness and LNM. Jung et al. [21] examined the density of CD163-positive TAMs through IHC in 14 human cancer types and found that PTC exhibited the lowest TAM density (1.8%±1.3%), while anaplastic thyroid cancer exhibited the highest (22.9%±17.1%). Kim et al. [32] reported that the group with high CD68-positive TAM density (25% to 70%) showed a larger tumor size compared to the group with low density (<25%) in PTCs with LNM. They observed that PTCs with LNM had high TAM densities ranging from 5% to 75% of all cancer cells, although the study was limited by not including patients without LNM. In addition, two patients with six or more LNMs exhibited TAM densities of 50% or higher. Qing et al. [33] showed that the density of CD68-positive TAMs was significantly associated with LNM in PTC, while no association was observed with the other clinicopathologic characteristics. They also observed a similar pattern of positive CD68 and CD163 staining and confirmed that M2 was the major TAM phenotype. A recent single-cell RNA sequencing study of PTC revealed a progressive increase in the abundance of M2 macrophages, from paratumor tissues to primary tumors, metastatic lymph nodes, and subcutaneous distant metastases [34]. Additionally, in another single-cell RNA sequencing study, a notable elevation in M2 macrophages was observed in anaplastic thyroid cancer when compared to levels in both normal thyroid and PTC [35]. In alignment with prior research, our results indicated a higher density of TAMs, especially M2 macrophages, in N1b PTMC compared with that in N0 PTMC. This suggests that M2 macrophages might significantly contribute to the development of LLNM in PTMCs. A recent study observed significantly more M2 macrophage infiltration around tumor borders in PTCs with LNM than in those without LNM [36]. They proposed that M2-like TAMs positioned at PTC tumor borders might damage lymphatic vessels, thus promoting tumor cell lymphatic invasion. Since our study focused only on cancer tissues by performing laser capture microdissection, follow-up studies on the tumor microenvironment, specifically evaluating tumor-adjacent areas, are warranted.
Although the percentage of TAM density in PTC has varied in previous reports [21,32], our study showed higher density of CD163-positive TAMs (3.95%±1.74% and 6.70%±3.32% in the N0 and N1b group, respectively) than that reported by Jung et al. [21], who used a similar method of IHC analysis. There are two potential explanations for this discrepancy. First, our analysis excluded areas with fibrosis or tumor necrosis, and this exclusion may have introduced variations in the proportion. Second, M2-like TAMs are largely located in the tumor periphery rather than in the center [36]. Our study focused on small-sized PTMC, and as a result, the area at the periphery relative to the central part of the tumor is expected to be larger, which may account for the higher density of TAMs. Nevertheless, we applied the same interpretation criteria to all samples for IHC analysis, and were able to confirm a significant difference in TAMs between the N0 and N1b groups. However, due to the limited sample size, validation in a larger-scale study is necessary.
Recently, molecular tests for thyroid fine-needle aspiration samples have been employed not only to diagnose thyroid cancer, but also to predict its prognosis. For example, Thyroseq version 3 categorizes the genetic profile of thyroid cancers into three molecular risk groups correlating with cancer phenotype and recurrence risk [37-39]. However, the widespread use of molecular tests in Korea is limited, mainly due to their high cost and relatively low cost-effectiveness. Early identification of potentially progressing PTMC poses a significant challenge, given that active surveillance, rather than immediate surgery, is an option for PTMC management. In the N1b group of the CHA and BMC subsets in our study, while most patients were suspected to have LLNM before surgery, 5.4% (3/56) and 11.8% (2/17) of patients, respectively, were newly discovered with LLNM after surgery (Supplemental Table S5). Notably, one patient experienced the occurrence of LLNM 6 years after surgery. Because the majority of LLNM cases can be diagnosed or suspected through clinical assessment or preoperative imaging tests, it is crucial to prioritize a thorough evaluation of clinical factors and image findings. Additionally, incorporating IHC staining for M2 macrophage markers such as CD163, a cost-effective and easily accessible test, with preoperative core needle biopsy samples may be beneficial in predicting cancer progression, especially the potential development of LLNM. Furthermore, IHC staining of surgical specimens can also be helpful in predicting the recurrence or the occurrence of LLNM. Further studies are required to verify the usefulness of IHC staining for M2 macrophages in predicting the progression of PTMC.
Our study exhibits several strengths. Firstly, we showed the role of TAMs in PTMC, which had not previously been investigated. We confirmed that, similar to PTC and other cancers, TAMs in PTMC are associated with aggressive tumor characteristics, especially LLNM. In addition, we conducted RNA sequencing on our patient samples and additional transcriptome analysis on TCGA data for further validation. In the analysis of clinicopathological characteristics, we validated the features in two independent institutions with different frequencies of N1b. However, our study also has limitations. The sample size used in the transcriptional analysis was small, and the IHC analysis was solely performed on primary cancers, not their corresponding LLNMs. This was due to the challenge of selecting five evaluative areas, as the lymph nodes were small and contained mixed normal lymphoid tissues and metastatic infiltration.
In conclusion, male sex, multifocality, extrathyroidal extension, lymphatic invasion, and CLNM were identified as high-risk factors for LLNM. PTMCs displaying these characteristics require meticulous evaluation for potential LLNM. Additionally, our findings suggest that M2 macrophages within the tumor microenvironment might play a crucial role in LLNM of PTMCs. The M2 polarization of TAMs can be a promising biomarker for tumor progression and LLNM in PTMCs.
Supplementary Material
Supplemental Table S1.
Clinicopathological Characteristics of Patients with Papillary Thyroid Microcarcinoma Subjected to RNA Sequencing Analysis
Supplemental Table S2.
Clinicopathological Characteristics of Patients with Papillary Thyroid Microcarcinoma Subjected to Immunohistochemical Staining
Supplemental Table S3.
Clinicopathological Characteristics of Papillary Thyroid Microcarcinoma Patients with Lateral Neck Lymph Node Metastasis Subjected to RNA Sequencing and IHC Staining in the CHA Dataset
Supplemental Table S4.
DEGs and Enriched Functional Annotations of BRAF-Like Papillary Thyroid Carcinomas from the TCGA Database
Supplemental Table S5.
Lymph Node Characteristics in Papillary Thyroid Microcarcinoma Patients with LLNM
Supplemental Fig. S1.
Laser capture microdissection (LCM) and qualified RNA extraction (H&E staining, ×40 magnification).
Supplemental Fig. S2.
Immunohistochemical staining in papillary thyroid microcarcinoma. (A) Tumor-associated macrophage density was measured by averaging the CD68-positive or CD163-positive area (%) of five randomly selected areas in each sample. (B) Representative images of immunohistochemical staining (200× magnification). The scale bar is 100 µm. (C, D) The positive staining area (%) was calculated using the ImageJ Colour Deconvolution2 plug-in.
Supplemental Fig. S3.
Transcriptomic characteristics of papillary thyroid microcarcinoma (PTMC) and papillary thyroid carcinoma (PTC). Volcano plots showing the magnitude and the statistical significance of the differentially expressed genes (DEGs) between the N1b group and the N0 group of (A) PTMCs in the CHA Bundang Medical Center (CHA) database and (B) BRAF-like (BL) PTMCs, (C) BL-PTCs, and (D) RAS-like (RL) PTCs in The Cancer Genome Atlas (TCGA) database. (E) Enriched functional annotations of up- and down-regulated DEGs in the BL-PTCs from the TCGA database. FDR, false discovery rate.
Supplemental Fig. S4.
Thyroid differentiation score (TDS) according to the lymph node status in (A) the CHA Bundang Medical Center (CHA) database and (B) The Cancer Genome Atlas (TCGA) database. PTMC, papillary thyroid microcarcinoma; BL, BRAF-like; PC, primary cancer.
Supplemental Fig. S5.
Tumor microenvironment of papillary microcarcinoma (PTMC) in the CHA Bundang Medical Center (CHA) database. PC, primary cancer; LN, lymph node; NK, natural killer.
Supplemental Fig. S6.
Tumor microenvironment of BRAF-like (BL) papillary microcarcinoma (PTMC) in The Cancer Genome Atlas (TCGA) database. PC, primary cancer; NK, natural killer.
Notes
CONFLICTS OF INTEREST
No potential conflict of interest relevant to this article was reported.
AUTHOR CONTRIBUTIONS
Conception or design: Y.S.S. Acquisition, analysis, or interpretation of data: J.L., H.S.L., J.H.H., Y.S.S. Drafting the work or revising: J.L., H.S.L., Y.S.S. Final approval of the manuscript: J.L., H.S.L., J.H.H., Y.S.S.
Acknowledgements
This work was supported by a grant from the Seoul National University Hospital Research Fund (No. 04-2023-0300), a grant of the Research Driven Hospital R&D project, funded by the CHA Bundang Medical Center (No. BDCHA R&D 2021-003), National Research Foundation of Korea (NRF) grant funded by the Korea government (MSIT) (No. NRF-2020R1C1C1003924), and the Korean Thyroid Association Basic Medical Research Award 2021.