Associations between Dietary Acid-Base Load and Cardiometabolic Risk Factors in Adults: The Tehran Lipid and Glucose Study
Article information
Abstract
Background
In this study we investigated the associations of dietary acid-base load, identified by potential renal acid load (PRAL) and protein to potassium (Pro:K) ratio, with cardiometabolic risk factors in Tehranian adults.
Methods
A cross-sectional study was conducted within the framework of the fourth phase of the Tehran Lipid and Glucose Study (2009 to 2011) on 5,620 men and women aged 19 to 70 years. Dietary data were collected by a trained dietitian using a validated, 147-food item, semi-quantitative food frequency questionnaire, and dietary PRAL and Pro:K ratio were calculated. Multiple linear regression models with adjustment for potential confounding variables were used to evaluate the associations of dietary acid-base load with anthropometric measures, blood pressure, serum triglycerides, high density lipoprotein cholesterol (HDL-C), serum creatinine, and fasting blood glucose.
Results
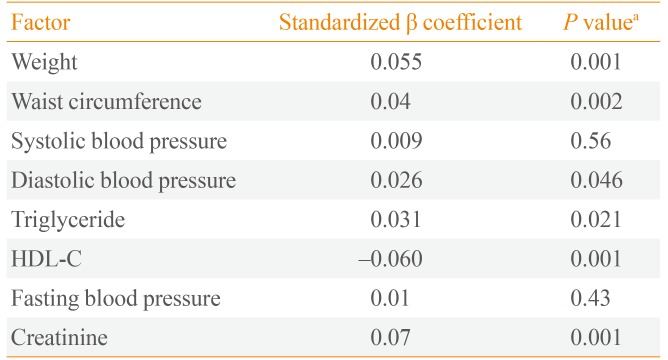
The mean±SD age of the participants was 39.8±12.8 years and 54% of participants were women. Mean±SD PRAL was -22.0±29.1; mean PRAL was -15.6 in men and -26.8 in women. Dietary PRAL was associated with weight (β=0.098, P<0.001), waist circumference (β=0.062, P<0.01), serum triglycerides (β=0.143, P<0.01), HDL-C (β=-0.11, P<0.01), diastolic blood pressure (β=0.062, P<0.01), and serum creatinine (β=0.142, P<0.001). Pro:K ratio was associated with weight (β=0.055, P<0.001), waist circumference (β=0.04, P<0.01), serum HDL-C (β=-0.06, P<0.01), serum triglycerides (β=0.03, P<0.05), diastolic blood pressure (β=0.026, P<0.05), and serum creatinine (β=0.07, P<0.01).
Conclusion
A more acidic dietary acid-base load may be a risk factor for the development of metabolic disorders.
INTRODUCTION
Metabolic syndrome (MetS) is a complex metabolic disorder involving abdominal fat accumulation, impaired glucose homeostasis, dyslipidemia, and hypertension that can lead to diabetes and cardiovascular disease. The global prevalence of MetS in adults is estimated to be about 20% to 25% and it is usually caused by obesity and decreased physical activity [1]. The Prevalence of MetS in United States adults according to the The National Health and Nutrition Examination Survey decreased from 25.5% to 22.9% between 1999/2000 and 2009/2010 [2]. The prevalence of MetS in Iranian men and women has been reported to be 30.1% and 55%, respectively [3]. Lifestyle factors, especially physical activity and dietary intakes, are considered major factors contributing to the incidence of MetS [45].
Dietary acid-base load is a dietary factor that was recently considered as a possible risk factor for metabolic disorders and cardiovascular disease [6]. Mild metabolic acidosis, caused by poor dietary intakes and impaired balance of calcium and citrate, and cortisol-induced acidosis have been identified as risk factors for the development of obesity, lipid disorders, and subsequent cardiovascular disease [7]. Associations of imbalanced dietary acid-base load with hypertension, chronic kidney dysfunction, and defects in bone metabolism have also been documented [8]. For the first time, Remer and Manz [9] developed an equation for estimating potential renal acid load (PRAL) using dietary intake. PRAL and protein to potassium (Pro:K) ratios have been introduced as indicators of dietary acid-base load. PRAL reflects the intestinal absorption rates contributing to nutrient ionic balance for protein, potassium, calcium, and magnesium, and dissociation of phosphate at pH 7.4 [1011121314]. Both indexes have been previously validated through comparison with 24-hours urinary acid-base load [10]. Both acidogenic foods (protein-containing foods including meat, fish, eggs, cereals, and dairy products) and alkalinogenic foods (fruits and vegetables) contribute to dietary acid-base load [9].
To our knowledge, few studies have examined the relationship between dietary acid-base load and cardiovascular risk factors, and there are some controversies. In this study we investigated the associations of PRAL and Pro:K ratio with cardiometabolic risk factors in Tehranian adults.
METHODS
Participants
This study was conducted within the framework of the Tehran Lipid and Glucose Study (TLGS). Briefly, the TLGS is an ongoing community-based prospective study being conducted to investigate and prevent noncommunicable diseases, in a representative sample of residents, aged ≥3 years, from district 13 of Tehran, the capital city of Iran. The first phase of the TLGS began in March 1999 and data collection, at 3-year intervals, is ongoing [11]. During the fourth phase of the TLGS (2009 to 2011) 7,956 of a total of 12,823 subjects completed dietary questionnaires. For the current analysis, participants aged 20 to 70 years were recruited. Participants were excluded from the analysis if they were on specific diets or were diagnosed as under-reporters (≤800 kcal/day) or over-reporters (≥4,200 kcal/day) of energy intake (n=420). Data on 5,620 individuals were considered for analysis. The study protocol was approved by the Ethics Committee of the Research Institute for Endocrine Sciences, Shahid Beheshti University of Medical Sciences, and informed written consent was obtained from all participants.
Dietary assessment and calculation of dietary acid-base load
Dietary data were collected by a trained dietitian using a validated semiquantitative food frequency questionnaire (FFQ) with 147 food items. The reliability and relative validity of the FFQ, developed for the TLGS for nutrient intakes in Tehranian adults, have been documented. The validity and reliability of the FFQ were assessed in a random sample (based on sex and age groups) by comparing the data from two FFQs completed 1 year apart and by comparing the data from the FFQs and repeated 24-hour dietary recall, respectively. The validity and reliability of the FFQ for dietary intakes were acceptable: for male and female participants, respectively; the correlation coefficients for FFQ and repeated 24-hour recall were 0.59 and 0.38 and those for the two FFQs were 0.43 and 0.42 [15].
The interviewer asked participants to give their consumption frequency for each food item during the past year on a daily, weekly, or monthly basis. Portion sizes of consumed foods reported in household measures were then converted to grams. The USDA food composition table (FCT) was used to calculated energy and nutrient intakes. The Iranian FCT was also used for some traditional foods that are not listed in the USDA FCT [16].
Dietary acid-base load was evaluated by two indexes: PRAL and Pro:K ratio. PRAL was calculated using the following formula: PRAL (mEq/day)=0.4888×dietary protein (g/day)+0.0366×dietary phosphorus (mg/day)-.0205×dietary potassium (mg/day)-.0125×calcium (mg/day)-.0263×magnesium (mg/day). Pro:K ratio was calculated as dietary protein (g/day) divided by dietary potassium (mg/day) [78]. PRAL and Pro:K ratio were both calculated using residual energy-adjusted nutrient intake data estimated from the FFQ. Higher values of PRAL and Pro:K ratio were considered to indicate a more acidic dietary acid-base load [9].
Anthropometrics, blood pressure, and biochemical assessment
Anthropometric measurements were taken by a trained interviewer. Weight was measured to the nearest 100 g using digital scale, with minimal clothing and without shoes. Height was measured to the nearest 0.1 cm, in a standing position without shoes, using a tape measure. Waist circumference (WC) was measured at the level of the umbilicus to the nearest 0.1 cm using an unstretched tape meter without pressure. Body mass index (BMI) was calculated as body weight (kg) divided by the square of body height (m).
Two measurements of blood pressure were taken on the right arm in a sitting position using a standardized mercury sphygmomanometer. The mean of the two measurements was considered as the participant's blood pressure.
Fasting blood samples were collected from all participants after 12 to 14 hours. Fasting plasma glucose was measured by an enzymatic colorimetric method using glucose oxidase. Triglyceride level was measured by enzymatic colorimetric analysis with glycerol phosphate oxidase. High density lipoprotein cholesterol (HDL-C) was measured after precipitation of apolipoprotein B-containing lipoprotein with phosphotungstic acid. The analysis was done using kits from Pars Azmoon Inc. (Tehran, Iran) and a Selectra 2 auto-analyzer (Vital Scientific, Spankeren, the Netherlands). Serum creatinine (mg/dL) was measured according to the standard colorimetric Jaffe kinetic reaction method (Pars Azmoon Inc.). Interassay and and intra-assay coefficients of variation of all assays were <5%.
Definition of cardiometabolic risk factors and MetS
Cardiometabolic risk factors were defined according to the diagnostic criteria proposed by NCEP ATP III [17]: (1) hyperglycemia was defined as fasting plasma glucose ≥100 mg/dL (5.6 mM) or drug treatment of impaired fasting glucose; (2) hyperglyceridemia was defined as serum triglycerides ≥150 mg/dLII (1.69 mmol/L) or drug treatment; (3) low HDL-C was defined as <40 mg/dL (1.04 mmol/L) for men and <50 mg/dL (1.29 mmol/L) for women or drug treatment; and (4) hypertension was defined as blood pressure ≥135/85 mm Hg or drug treatment for hypertension.
Since central obesity is commonly assessed by gender- and ethnicity-specific WC cutoff values, abdominal obesity was defined based on the Iranian adult cutoff for WC ≥95 cm for both sexes [18].
Statistical methods
Participants' general characteristics and the prevalence of MetS and its components were compared across quartiles of dietary PRAL index using analysis of variance for continuous variables and chi-square test for numerical variables. Mean dietary intakes were compared across quartiles of PRAL index using a general linear model adjusted for sex, age (years, continuous), and energy intake (kcal/day). To identify associations of PRAL index and Pro:K ratio with MetS components, multivariate regression models were created with adjustment for age, sex, BMI, smoking status, menopause status (in women), daily energy intake, dietary fat and saturated fat, carbohydrates, and dietary fiber. All statistical analyses were conducted using SPSS version 16.0 (SPSS Inc., Chicago, IL, USA). P values <0.05 were considered significant.
RESULTS
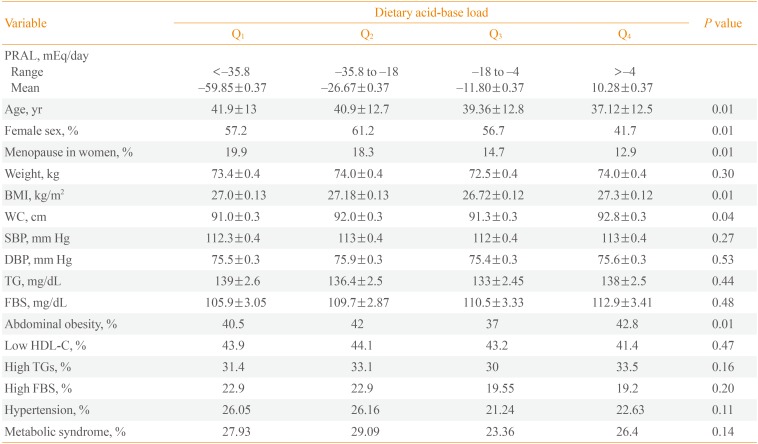
The mean±SD age of the participants was 39.8±12.8 years and 54% of participants were women. Mean±SD PRAL was -22.0±29.1; mean PRAL was -15.6 in men and -26.8 in women). PRAL index in the first, second, third, and fourth quartiles was <-35.8, -35.8 to -18, -18 to -4, and >-4, respectively. General characteristics of the participants are shown in Table 1. Participants in the highest quartile of PRAL index were significantly younger (37.1 years vs. 41.9 years, P<0.01). The percent of women was significantly lower in the highest, as compared to the lowest quartile of PRAL index (41.7% vs. 68.8%). Participants in the highest PRAL quartile had higher BMI (27.3 kg/m2 vs. 27.0 kg/m2) and WC (92.8 cm vs. 91.0 cm) and a higher rate of abdominal obesity (42.8% vs. 40.5%) compared to the lowest quartile. Mean dietary intakes of participants across quartiles of PRAL are shown in Table 2. There was no significant difference in energy intake across PRAL quartiles. Dietary intakes of fat, protein, phosphorus, animal protein sources, and grains were significantly higher in participants with highest values for PRAL index (P<0.01). There was a significant decrease in dietary intakes of carbohydrates, calcium, potassium, magnesium, cereals, fruit, and vegetables with increasing PRAL index (P<0.01). Associations of dietary PRAL with MetS components are shown in Table 3. PRAL was associated with weight (β=0.1, P<0.01), WC (β=0.7, P<0.01), serum triglyceride concentration (β=0.03, P<0.05), serum HDL-C (β=-0.08, P<0.01), systolic (β=0.05, P<0.01), and diastolic blood pressure (β=0.05, P<0.01), and serum creatinine (β=0.13, P<0.01). Associations of Pro:K ratio with MetS components are shown in Table 4. Pro:K ratio was associated with WC (β=0.03, P<0.01), serum HDL-C (β=-0.06, P<0.01), serum triglycerides (β=0.03, P<0.05), and systolic blood pressure (β=0.03, P<0.01).

Characteristics of Participants across Quartiles of Potential Renal Acid Load: The Tehran Lipid and Glucose Study (n=1,405)

Dietary Intakes of Participants across Quartiles of Potential Renal Acid Load: The Tehran Lipid and Glucose Study (n=1,405)

Multivariate Associations between Potential Renal Acid Load and Cardiometabolic Risk Factors: The Tehran Lipid and Glucose Study

Multivariate Associations between PRO:K Ratio and Cardiometabolic Risk Factors: The Tehran Lipid and Glucose Study
DISCUSSION
The results of this study provide further evidence regarding the possible associations of dietary acid-base load with cardiometabolic risk factors. In agreement with previous studies, higher intakes of meat, grains, egg, fish, and dairy products were associated with higher PRAL, while higher intakes of vegetables and fruit were related to lower PRAL [19202122]. Moreover, dietary PRAL was highly correlated with Pro:K ratio (r=0.47, P<0.01). Mean PRAL and Pro:K ratio values in this population (-22.0 mEq/day and 0.02 g/mEq, respectively) showed lower acidity, as compared to other populations, including British middle-aged women (27.6 mEq/day and 1.0 g/mEq, respectively) and young Japanese women (10.4 mEq/day and 1.2 g/mEq, respectively). Consistent with a previous study [6], PRAL was strongly associated with K (r=-0.88, P<0.001), Ca (r=-0.58, P<0.001), and Mg (r=-0.44, P<0.001), while it had a weak association with dietary protein (r=0.13, P<0.01); there was no significant correlation between PRAL and phosphorus (r=0.01, P=0.30).
The observed associations between dietary PRAL and cardiometabolic risk factors in this study were independent of potential confounding variables including demographic, anthropometric, and dietary factors. An investigation by Murakami et al. [6] found an independent positive association between BMI/WC and Pro:K ratio, but not PRAL. In that study, after adjustment for potential confounding factors, PRAL also had an independent positive association with total cholesterol and LDL-C [6]. The associations of dietary PRAL with anthropometric measures may be attributed to the effect of dietary acid-base load on muscle metabolism: previous studies showed that mild metabolic acidosis induced by an acidogenic diet led to loss of muscle tissue via decreased synthesis and increased proteolysis and amino acid oxidation [23]. In a cross-sectional study, Welch et al. [24] investigated the association of dietary acid-base load with free fat mass (FFM), percentage FFM (FFM%), and FFM index (FFMI, weight/height2), measured by dual-energy X-ray absorptiometry in women aged 18 to 79 years. Mean dietary PRAL was -9.24 mEq/day and ranged from -24.44 mEq/day in the first quartile (most alkaline) to 4.83 mEq/day in the fourth quartile. Participants with the most alkaline diets had higher FFM values, and FFMI was significantly lower in participants with more acidic diets. In that study, the optimal ratio of alkalinogenic to acidogenic foods (fruits and vegetables versus meat, fish, eggs, dairy products, and cereals) in relation to anthropometric measures was 1.4 [24].
Our findings suggest that higher PRAL may cause high systolic and diastolic blood pressure, one of the most important cardiometabolic risk factors. Some previous experimental studies found that mild metabolic acidosis induced by diet significantly increased blood pressure. However, findings in relation to dietary PRAL index and blood pressure are inconsistent: in a cross-sectional study, Murakami et al. [6] showed that higher dietary PRAL and Pro:K ratio (more acidic dietary acid-base loads) were associated with higher systolic and diastolic blood pressure. A prospective analysis of 2,241 adults in the Rotterdam Study showed that there was no significant association between dietary acid load and risk of hypertension; median dietary acid load ranged from -14.6 to 19.9 mEq/day across tertiles of PRAL and the multivariate hazard ratio (95% confidence interval) in the highest, as compared to the lowest tertile of dietary PRAL, was 1.02 (0.88 to 1.18). Some proposed mechanisms explain how higher dietary acid-base load may contribute to the development of hypertension. A more acidic diet could increase renal acid excretion, and ammonia synthesis as a compensatory mechanism, and could also increase cortisol production and reduce citrate excretion [141718].
The major limitation of the current study is its cross-sectional design, which precluded the determination of a causal relationship. Therefore, the possible associations need to be tested directly in future investigations.
In conclusion, findings from this study show that higher PRAL and Pro:K ratio (more acidic dietary acid-base loads) were associated with elevated blood pressure in a Tehranian population. We also found that PRAL and Pro:K ratio have independent positive associations with weight, WC, serum triglycerides, and serum creatinine, and a negative association with HDL-C.
ACKNOWLEDGMENTS
We thank the Tehran Lipid and Glucose Study (TLGS) participants and the field investigators of the TLGS for their cooperation and assistance with physical examinations, biochemical and nutritional evaluations, and database management. This study was supported by grant no. 121 from the National Research Council of the Islamic Republic of Iran and the Research Institute for Endocrine Sciences of Shahid Beheshti University of Medical Sciences. We would like to thank Ms. N. Shiva for language editing of the manuscript.
Notes
CONFLICTS OF INTEREST: No potential conflict of interest relevant to this article was reported.