Articles
- Page Path
- HOME > Endocrinol Metab > Volume 30(3); 2015 > Article
-
Original ArticleEndocrine Research Physiological Parameters in the Blood of a Murine Stress-Induced Depression Model before and after Repeated Passive Exercise
- Tae-Kyung Kim1, Jin-Young Park1, Pyung-Lim Han1,2,3
-
Endocrinology and Metabolism 2015;30(3):371-380.
DOI: https://doi.org/10.3803/EnM.2015.30.3.371
Published online: January 5, 2015
1Department of Brain and Cognitive Sciences, Ewha Womans University, Seoul, Korea.
2Department of Chemistry and Nano Science, Ewha Womans University, Seoul, Korea.
3Brain Disease Research Institute, Ewha Womans University, Seoul, Korea.
- Corresponding author: Pyung-Lim Han. Department of Brain and Cognitive Sciences, Ewha Womans University, 52 Ewhayeodae-gil, Seodaemun-gu, Seoul 03760, Korea. Tel: +82-2-3277-4130, Fax: +82-2-3277-3419, plhan@ewha.ac.kr
• Received: September 4, 2014 • Revised: October 13, 2014 • Accepted: October 17, 2014
Copyright © 2015 Korean Endocrine Society
This is an Open Access article distributed under the terms of the Creative Commons Attribution Non-Commercial License (http://creativecommons.org/licenses/by-nc/3.0/) which permits unrestricted non-commercial use, distribution, and reproduction in any medium, provided the original work is properly cited.
ABSTRACT
-
Background
- Animal models are necessary to study the mechanism underlying the effects of exercise on depression but an effective procedure for exercise treatment and exercise effects on physiological parameters in a specific depression model need to be characterized.
-
Methods
- Physiological parameters including lactate, partial pressue of O2 (pO2) and CO2 (pCO2) saturated O2 (sO2), pH, HCO3, total CO2 (TCO2), and base excess extracellular fluid (BEecf) levels in the blood were measured after treatment with passive exercise in normal mice and a stress-induced depression model.
-
Results
- Normal mice or mice that were subjected to daily 2-hour restraint for 14 days (2 hours×14 days of restraint) were placed on a running wheel that was rotating at a speed of 9 m/min for 1 hour per day for 1 to 21 days. After repeated exercise in mice that were previously subjected to 2 hours×14 days restraint, plasma lactate levels decreased, the levels of pO2, sO2, and pH tended to increase, and the levels of pCO2 decreased in the absence of significant changes in HCO3, TCO2, and BEecf. However, none of these changes were additive to the stress effects or were much more severe than those induced after repeated passive exercise in normal mice.
-
Conclusion
- These results suggest that passive exercise for 1 hour daily for 14 to 21 consecutive days on a running wheel rotating at a speed of 9 m/min may be used as an exercise protocol without inducing severe additive effects on physiological burdens.
- Depression is a modern pandemic that affects more than 350 million people of all ages worldwide [1]. It is a mood disorder characterized by emotional, cognitive and physiological symptoms including depressed mood, diminished interest in daily life, and psychomotor retardation [2], implying that multiple brain areas are affected. At present, antidepressants which are based on monoaminergic neurotransmitter actions are the primary choice for treatment of depression in clinical practice. However, the remission rate is not high and many patients do not respond to current antidepressants [3]. Considering that various etiologies, including genetic and environmental factors, are involved in depression and that current antidepressants have limited therapeutic efficacies, there are urgent need for the development of diverse strategies for the treatment of depressive symptoms.
- To study the mechanism underlying the exercise effects of exercise on depression and to develop exercise-based therapeutic strategies, proper animal models are necessary. For this, one must first find an effective strategy for exercise treatment in a specific depression model. Most of commonly used animal models of depression are induced by evoking chronic stress in the body, for example, treatment of mice or rats for 10 to 30 days with chronic unpredictable stress [456], social defeat stress [78], or restraint stress [91011] produces lasting depression-like behaviors. Next, one should choose a proper exercise regimen for the depression model of choice. Exercise regimens vary widely across laboratories and experiments. For example, physical exercise may be provided to laboratory animals through voluntary wheel running or forced running [1213], and through a treadmill or a running wheel [14] exercise. Moreover, the exercise itself may evoke physiological and emotional stress in a certain condition. In particular, long-term submaximal exercise may cause physiological stress and induce lactate accumulation in the blood [151617]. Therefore, it is necessary to understand the physiological parameters that are affected by exercise, particularly when forced exercise is applied to a stress-induced depression model.
- Towards the aim of understanding the physiological features of forced exercise in a mouse model of depression, we measured physiological parameters in the blood of animals that were treated with passive exercise with different treatment paradigms: (1) different speeds of exercise in normal mice (experiment 1); (2) different number of days of exercise in normal mice (experiment 2); and (3) different number of days of exercise applied in a stress-induced depression model (experiment 3).
INTRODUCTION
- Animals
- Male 7-week-old C57BL6 mice were obtained from Daehan BioLink (Eumsung, Korea). Mice were housed in pairs in standard clear plastic cage in a temperature- and humidity-controlled room. All animals were handled in accordance with the animal care guidelines of the Ewha Womans University (IACUC 2013-01-007).
- Repeated restraint
- Repeated restraint was conducted as described previously [910]. In brief, mice were individually placed in a well-ventilated, 50-mL polypropylene conical tube, and were restrained within this tube for 2 hours daily starting from 10:00 AM. This restraint procedure was repeated for 14 consecutive days.
- Exercise with the running wheel
- Mice were individually forced to run on a rotating wheel at a constant speed of 6, 9, or 12 m/min for 1, 7, 14, or 21 days. The wheel consisted of a rotating drum with two circular ventilated plastic walls (inner diameter, 20 cm) with a rim (width, 7 cm) that consisted of evenly-spaced aluminum bars (each with a width of 2 mm, spaced at 0.65 cm-intervals). In the test of repeated exercise effects, mice that ran on the running wheel at 9 m/min for less than 80% of the training time for more than any 2 consecutive days were excluded from the final data set.
- Physiological parameters
- Mice were anesthetized by intraperitoneal injection with avertin (2,2,2,-tribromoethanol; 300 mg/kg, 300 µL of 2.5% avertin/animal) in saline. We avoided using ketamine/xylazine (100 mg/kg) because these anesthetics produce hyperglycemia effects [18], and Nembutal (pentobarbital) or Pentothal (thiobutabarbitol) because theses anesthesia decrease blood flow by 50% [19].
- Measurement of physiological parameters using a i-STAT analysis kit
- The CG4+ cartridge contained a series of biosensors, thin-film electrodes microfabricated on silicon chips for the following parameters: pH (reportable range, pH 6.5 to 8.2), partial pressure of CO2 (CO2; reportable range, 5 to 130 mm Hg), partial pressure of O2 (pCO2; reportable range, 5 to 800 mm Hg), total CO2 (TCO2; reportable range, 5 to 50 mmol/L), HCO3 (reportable range, 1.0 to 85.0 mmol/L), base excess extracellular fluid (BEecf; reportable range, -30 to 30 mmol/L), saturated O2 (sO2; reportable range, 0% to 100%), and lactate (reportable range, 0.30 to 20.00 mmol/L). Samples were tested for pH, pCO2, pO2, TCO2, HCO3, BEecf, sO2, and lactate within 5 minutes of collection.
- The cartridges were stored at 4℃ until use. Before starting the experiments, the cartridges were removed from the refrigerator and allowed to reach room temperature for 2 hours. Blood (200 to 500 µL) was collected from the heart of sacrificed mice within 20 to 30 seconds using an 1-mL syringe and 95 µL of whole blood was loaded into the CG4+ cartridge (#03P85-25, Abbott Laboratory, North Chicago, IL, USA). After sealing, the cartridge was inserted into the i-STAT 1 analyzer (#AB-4P7501, Abbott Laboratory), which was automatically activated. The resulting data were transmitted by infrared signals to an adjacent printer (HP 82240B Infrared Printer, Hewlett Packard, Palo Alto, CA, USA). The i-STAT 1 analyzer had a mechanical system that controlled the flow of calibration solution and samples in the cartridges. The results were obtained by comparing the sensor response to the sample with that of the calibration solution. The complete test lasted approximately 90 seconds.
- Measurement of plasma lactate levels using a Roche lactate detection system
- An Accutrend plus lactate meter (Roche Diagnostics, Indianapolis, IN, USA) and BM-Lactate 25 strips (03012654016, Roche Diagnostics) were used according to the manufacturer's instructions as an alternative method for measuring lactate levels. In this system, lactate in the applied sample undergoes an enzymatic reaction with formation of a dye. The amount of dye produced increases with the concentration of lactate. Before starting the actual measurements, the test strip was prepared as instructed. Blood serum of each animal was applied to the application area and the measurement chamber flap was closed. After 60 seconds, the color intensity was determined by illuminating the application area from below using the light-emitting diode (LED) and measuring the intensity of the reflected light with a detector (reflectance photometry). The measured lactate values were determined from the read lot-specific information (code strip) by subtracting the measured blank value.
- Immunohistochemistry
- Immunohistochemical studies were carried out as described previously [20]. In brief, mouse brains were perfused with 4% paraformaldehyde via a transcardiac method and postfixed in the same solution overnight at 4℃. Brains were coronally cut into 40-µm sections using a vibratome (Leica VT 1000S, Leica Instruments, Nussloch, Germany). Free-floating sections were incubated with 4% bovine serum albumin in phosphate buffered saline (PBS) containing 0.1% Triton X-100 (PBST) for 1 hour, and then reacted with primary antibody at 4℃ overnight. The sections were washed with PBST, reacted with secondary antibody diluted 1:200 in PBST, and visualized using an ABC Elite kit (Vector Laboratories, Burlingame, CA, USA). Anti-Ki67 antibody was purchased from Vector (#VP-K451). Anti-doublecortin (anti-DCX) antibody was purchased from Santa Cruz Biotechnology (#SC-8066, Santa Cruz, CA, USA). 3,3'-Diaminobenzidine-stained images were analyzed using an Olympus BX 51 microscope equipped with a DP71 camera and MetaMorph Microscopy Automation & Image Analysis software (Molecular Devices, Sunnyvale, CA, USA).
- Statistical analysis
- GraphPad PRISM software (GraphPad Software Inc., San Diego, CA, USA) was used for analysis of statistical significance. Two-sample comparisons were carried out using the Student t test, whereas multiple comparisons were made using one-way analysis of variance followed by the Newman-Keuls multiple comparison test. All data are presented as mean±SEM and statistical difference was accepted at P<0.05.
METHODS
- Experiment 1-1: effects of passive exercise at varying intensities on physiological parameters
- Normal C57BL/6 male mice were subjected to passive exercise for 1 hour per day for 3 days on the running wheel rotating at speeds of 6, 9, and 12 m/min (Fig. 1A). Immediately after the exercise session on day 3, physiological parameters in the blood were measured using the i-STAT clinical portable analyzer. The reliability of the i-STAT analyzer has previously been described [17212223]. The level of plasma lactate was slightly reduced after exercise at 12 m/min, but not at the other speeds (Fig. 1B). Plasma pH was increased in an exercise speed-dependent manner, starting to show a significant increase from 9 m/min and increasing to pH 7.29 at 12 m/min (Fig. 1C). The levels of pO2 and sO2 tended to increase by approximately 10% after exercise, but these changes were not statistically significant (Fig. 1D, E). The level of pCO2 decreased in an exercise-speed dependent manner and showed a significant decrease at all exercise speeds examined (Fig. 1F). The levels of TCO2 and HCO3 tended to decrease, but none of these changes were statistically significant (Fig. 1G, H). Despite the significant decrease in pCO2, the plasma BEecf level after exercise was not significantly different from that of the control (Fig. 1I).
- Experiment 1-2: passive exercise for 1 hour per day for 7 days at a speed of 9 m/min induced typical neurogenesis
- Next, we examined whether passive exercise on a running wheel rotating at a speed of 9 m/min for 1 hour daily for repeated days produced neurogenesis in the hippocampus, an important biological marker for the effects of exercise. To this end, normal mice were treated with passive exercise on the running wheel rotating at a speed of 9 m/min for 1 hour daily for 7 days and then examined for exercise-induced neurogenesis (Fig. 2A). Immunohistological staining with antibody to Ki-67, a marker for cell proliferation of new neurons, showed that the number of Ki-67-positive progenitor cells in the dentate gyrus (DG) increased after 7 days of exercise (Fig. 2B). Immunohistological staining with antibody to DCX, a marker for cell differentiation of new neurons, showed that the number of DCX-positive neurons in the DG also increased after 7 days of exercise (Fig. 2C).
- Experiment 2: physiological parameters in normal mice exposed to repeated passive exercise
- To examine the effects of repeated exercise on physiological parameters, normal mice were subjected to passive exercise on the running wheel at a speed of 9 m/min for 1 hour per day for 1, 7, 14, and 21 days. Immediately after the last scheduled exercise, the mice were sacrificed and blood was obtained (Fig. 3A). Plasma lactate levels measured with the i-STAT analyzer tended to decrease from 7 to 21 days of exercise, but the changes were not significant (Fig. 3B). Plasma lactate levels were also measured using a Roche lactate detection system, and similar results were obtained (data not shown). Plasma pH increased from 7.21 to 7.26 after 21 days of exercise (Fig. 3C). Plasma pO2 levels were not significantly changed after 14 to 21 days of exercise (Fig. 3D). sO2 levels tented to increase after 21 days of exercise (Fig. 3E). Plasma pCO2 levels were significantly decreased after exercise in all cases (Fig. 3F). The levels of TCO2 and HCO3 decreased after 21 days of exercise (Fig. 3G, H). Plasma BEecf level decreased after 1 day of exercise, but stabilized at the control level after 7 to 21 days of exercise (Fig. 3I).
- Experiment 3: physiological parameters in mice subjected to repeated stress and to repeated passive exercise
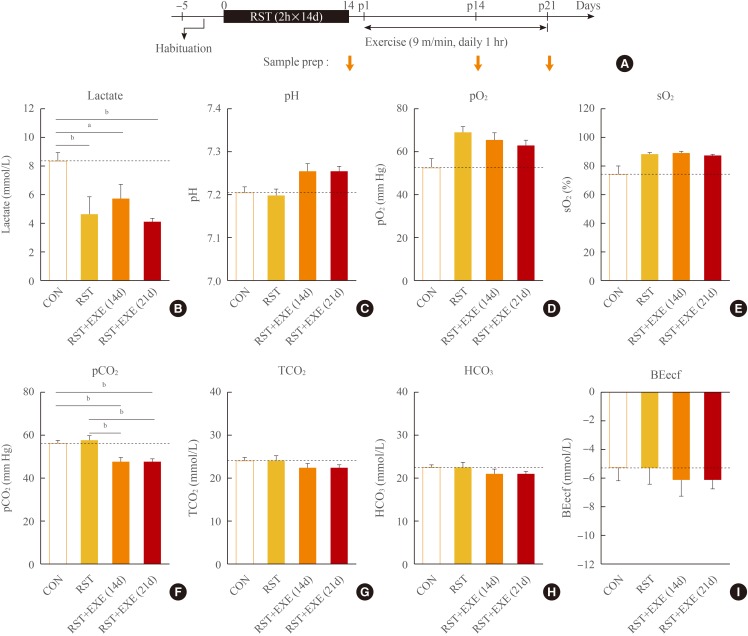
- In previous studies we reported that C57BL/6 mice treated with repeated restraint for 2 hours per day for 14 consecutive days (2 hours×14 days of restraint [RST]) showed robust depression-like behaviors in several behavioral assessments including the forced swim test, tail suspension test, and U-field sociability test [91024]. In the present study, we examined the effects of repeated exercise on blood physiological parameters in this stress-induced depression model. C57BL/6 male mice were subjected to 2 hours×14 days RST and were then placed on the running wheel at a speed of 9 m/min for 1 hour daily for 14 and 21 days (Fig. 4A).
- Immediately after 2 hours×14 days RST, the plasma lactate level was significantly reduced (Fig. 4B). After subsequent 14 and 21 days of exercise, the plasma lactate levels remained low and were comparable to those of the 2 hours×14 days RST group (Fig. 4B). The plasma pH was not changed after 2 hours×14 days RST, but increased from 7.21 to 7.25 after 14 and 21 days of subsequent exercise (Fig. 4C). Plasma pO2 and sO2 levels were tended to increase after 2 hours×14 days RST, and these levels were sustained after subsequent repeated exercise (Fig. 4D, E). Plasma pCO2 level was unchanged after 2 hours×14 days RST, but was significantly decreased after subsequent exercise (Fig. 4F). The levels of TCO2 and HCO3 were not changed after 2 hours×14 days RST or after subsequent exercise (Fig. 4G, H). Plasma BEecf levels were not significantly changed after 2 hours×14 days RST or after subsequent repeated exercise (Fig. 4I).
RESULTS
- Certain physiological parameters in the blood, such as stress hormones, oxygen and carbon dioxide levels, blood pH, and lactate level may be used as important blood markers that reflect bodily responses to exercise. Plasma pH, lactate levels, and partial O2 and CO2 pressures in the blood may be affected by repeated exercise, particularly when exercise is undertaken at moderate to high intensities [151617]. Therefore, these blood parameters may be used as important markers for the evaluation of maximal versus submaximal intensity of exercise [252627]. In normal mice, blood lactate levels decrease after intense exercise. For example, in one study, blood lactate level at a running speed of 10 m/min was 0.4 mmol/L, but decreased to 0.3 mmol/L or lower after exercising at speeds of 13.5 m/min and higher [28]. In the present study, we examined physiological parameters induced by three different speeds of running (6, 9, and 12 m/min). Exercise-induced changes in lactate levels at the speed of 9 m/min were comparable to those of the untreated control (Figs. 1, 3), whereas at the speed of 12 m/min lactate levels decreased slightly, but by an insignificant amount (Fig. 1). Although mice can run well on a treadmill at a speed of 12 m/min and even higher [293031], mice placed on the rotating wheel at a speed of 12 m/min did not perform proper running (unpublished observation). Mice on the running wheel had to run on a rim that consisted of evenly spaced aluminum bars. Therefore, it is possible that the exerxcise intensity achieved by running on the wheel at a speed of 9 m/min might be higher than that produced on a treadmill at the same speed. Considering the actual distance of running and lactate levels, we speculate that passive exercise at the speed of 9 m/min may be a good choice that ensures a relatively high exercise speed, but does not produce severe lactate accumulation in the blood.
- An important question concerning the effects of exercise in stress-induced depression models is whether the physiological changes induced by passive exercise in mice with stress-induced depression are comparable to those induced by passive exercise in normal animals. We demonstrated that 2 hours×14 days RST decreased lactate levels significantly, whereas passive exercise at a speed of 9 m/min for 1 hour daily for 14 or 21 days tended to decrease lactate levels, but the effects were subtle (Figs. 3B, 4B). For blood pH, the 2 hours×14 days RST did not change blood pH, whereas the 1 hour exercise for 21 days slightly increased the pH in normal animals (Fig. 3C) and tended to increase it in mice with stress-induced depression (Fig. 4C). The 2 hours×14 days RST also induced no change in pCO2, whereas the 1 hour exercise for 14 or 21 days significantly decreased pCO2 (Figs. 3F, 4F). 1 hour exercise for 21 days decreased TCO2 and HCO3 in normal mice, but tended to induce only a weak suppression in mice with 2 hours×14 days RST (Fig. 3D, E). The pO2 and sO2 levels increased after exercise, but these oxygen levels were comparable to those in mice with 2 hours×14 days RST alone (Fig. 4D, E). Therefore, passive exercise for 1 hour daily for 14 to 21 days in mice that had been subjected to 2 hours×14 days RST produced a specific change in lactate levels, whereas the changes in pH and pCO2 level were specific to exercise. Collectively, these results suggest that passive exercise for 1 hour daily for 14 to 21 days in the stress-induced depression model did not to induce severe additive effects on physiological burdens.
- Animals in such studies may be given either voluntary or forced exercise regimens. In general, voluntary exercise paradigms for laboratory animals may be free from severe stress, but the exercise time and exercise intensity for each animals can vary across experiments. For example, the average distance covered by C57BL/6 mice through voluntary exercise examined over 10- to 54-day periods in different studies was 5.8 [32], 7.0 [33], 7.3 [34], 9.0 [35], 12.0 [36], and 16.5 km/day [37]. Moreover, even if the distance run by any two individuals is the same in voluntary exercise paradigms, one animal may run at a higher speed and for less total time than the other animal. Therefore, it is difficult to control the amount of exercise and exercise intensity between individuals. In contrast, forced exercise (passive exercise) paradigms for laboratory animals are good for controlling exercise duration and exercise speed, but may provoke a certain level of stress. In particular, when a forced exercise paradigm is applied to stress-induced depression models, the forced exercise may impose an additional stress depending on the procedure of exercise; thus, potentially adding to the overall stress effects. In fact, we observed that passive exercise increased plasma corticosterone levels after the initiation of exercise (unpublished observation). As described, although mice can run well on a treadmill at a speed of 12 m/min and even higher [293031], passive exercise at the speed of 9 m/min may be a good choice that ensures a relatively high exercise speed. Consistent with this interpretation, exercise treatment at a speed of 9 m/min for 1 hour daily for 7 days effectively induced neurogenesis in the hippocampus, supporting that this passive exercise paradigm is as effective as previously reported various voluntary exercise paradigms [35363839]. Voluntary exercise and forced exercise are inherently different, and this difference is probably responsible for their differential effects on brain and behavior [12].
DISCUSSION
-
Acknowledgements
- This research was supported by a grant (2012R1A2A1A03010177) from the Ministry of Science, ICT and Future Planning, Republic of Korea and a grant (GT5) from Ewha Womans University.
ACKNOWLEDGMENTS
-
CONFLICTS OF INTEREST: No potential conflict of interest relevant to this article was reported.
Article information
- 1. World Health Organization. Search results 'depression' 2014 [Internet]; Geneva: WHO; c2013. cited 2014 Dec 29. Available from: http://search.who.int/search?q=depression&ie=utf8&site=who&client=_en_r&proxystylesheet=_en_r&output=xml_no_dtd&oe=utf8&getfields=doctype.
- 2. American Psychiatric Association. Diagnostic and statistical manual of mental disorders: DSM-5; 5th ed. Washington, DC: American Psychiatric Association; 2013.
- 3. Krishnan V, Nestler EJ. The molecular neurobiology of depression. Nature 2008;455:894–902. ArticlePubMedPMCPDF
- 4. Banasr M, Valentine GW, Li XY, Gourley SL, Taylor JR, Duman RS. Chronic unpredictable stress decreases cell proliferation in the cerebral cortex of the adult rat. Biol Psychiatry 2007;62:496–504. ArticlePubMed
- 5. Banasr M, Duman RS. Glial loss in the prefrontal cortex is sufficient to induce depressive-like behaviors. Biol Psychiatry 2008;64:863–870. ArticlePubMedPMC
- 6. Li N, Liu RJ, Dwyer JM, Banasr M, Lee B, Son H, et al. Glutamate N-methyl-D-aspartate receptor antagonists rapidly reverse behavioral and synaptic deficits caused by chronic stress exposure. Biol Psychiatry 2011;69:754–761. ArticlePubMedPMC
- 7. Berton O, McClung CA, Dileone RJ, Krishnan V, Renthal W, Russo SJ, et al. Essential role of BDNF in the mesolimbic dopamine pathway in social defeat stress. Science 2006;311:864–868. ArticlePubMed
- 8. Krishnan V, Han MH, Graham DL, Berton O, Renthal W, Russo SJ, et al. Molecular adaptations underlying susceptibility and resistance to social defeat in brain reward regions. Cell 2007;131:391–404. ArticlePubMed
- 9. Kim KS, Han PL. Optimization of chronic stress paradigms using anxiety- and depression-like behavioral parameters. J Neurosci Res 2006;83:497–507. ArticlePubMed
- 10. Seo JS, Park JY, Choi J, Kim TK, Shin JH, Lee JK, et al. NADPH oxidase mediates depressive behavior induced by chronic stress in mice. J Neurosci 2012;32:9690–9699. ArticlePubMedPMC
- 11. Chiba S, Numakawa T, Ninomiya M, Richards MC, Wakabayashi C, Kunugi H. Chronic restraint stress causes anxiety- and depression-like behaviors, downregulates glucocorticoid receptor expression, and attenuates glutamate release induced by brain-derived neurotrophic factor in the prefrontal cortex. Prog Neuropsychopharmacol Biol Psychiatry 2012;39:112–119. ArticlePubMed
- 12. Leasure JL, Jones M. Forced and voluntary exercise differentially affect brain and behavior. Neuroscience 2008;156:456–465. ArticlePubMed
- 13. Cook MD, Martin SA, Williams C, Whitlock K, Wallig MA, Pence BD, et al. Forced treadmill exercise training exacerbates inflammation and causes mortality while voluntary wheel training is protective in a mouse model of colitis. Brain Behav Immun 2013;33:46–56. ArticlePubMedPMC
- 14. Liu YF, Chen HI, Wu CL, Kuo YM, Yu L, Huang AM, et al. Differential effects of treadmill running and wheel running on spatial or aversive learning and memory: roles of amygdalar brain-derived neurotrophic factor and synaptotagmin I. J Physiol 2009;587(Pt 13):3221–3231. ArticlePubMedPMC
- 15. Milne KJ, Noble EG. Exercise-induced elevation of HSP70 is intensity dependent. J Appl Physiol (1985) 2002;93:561–568. ArticlePubMed
- 16. Pires FO, Noakes TD, Lima-Silva AE, Bertuzzi R, Ugrinowitsch C, Lira FS, et al. Cardiopulmonary, blood metabolite and rating of perceived exertion responses to constant exercises performed at different intensities until exhaustion. Br J Sports Med 2011;45:1119–1125. ArticlePubMed
- 17. Garcia TR, Carneiro de Rezende AS, Santiago JM, Queiroz de Almeida F, Fonseca MG, Munoz A. Venous hemogasometry and blood electrolytes in mangalarga marchador mares submitted to aerobic training. Ciênc Agrotec 2013;37:559–565.ArticlePDF
- 18. Brown ET, Umino Y, Loi T, Solessio E, Barlow R. Anesthesia can cause sustained hyperglycemia in C57/BL6J mice. Vis Neurosci 2005;22:615–618. ArticlePubMed
- 19. Gjedde A, Rasmussen M. Pentobarbital anesthesia reduces blood-brain glucose transfer in the rat. J Neurochem 1980;35:1382–1387. ArticlePubMed
- 20. Baek IS, Kim TK, Seo JS, Lee KW, Lee YA, Cho J, et al. AAD-2004 attenuates progressive neuronal loss in the brain of Tg-betaCTF99/B6 mouse model of Alzheimer disease. Exp Neurobiol 2013;22:31–37. ArticlePubMedPMC
- 21. Silverman SC, Birks EK. Evaluation of the i-STAT hand-held chemical analyser during treadmill and endurance exercise. Equine Vet J Suppl 2002;551–554. ArticlePubMed
- 22. Tinkey P, Lembo T, Craig S, West C, Van Pelt C. Use of the i-STAT portable clinical analyzer in mice. Lab Anim (NY) 2006;35:45–50. ArticlePDF
- 23. Dascombe BJ, Reaburn PR, Sirotic AC, Coutts AJ. The reliability of the i-STAT clinical portable analyser. J Sci Med Sport 2007;10:135–140. ArticlePubMed
- 24. Park JY, Kim TK, Choi J, Lee JE, Kim H, Lee EH, et al. Implementation of a two-dimensional behavior matrix to distinguish individuals with differential depression states in a rodent model of depression. Exp Neurobiol 2014;23:215–223. ArticlePubMedPMC
- 25. Wisloff U, Helgerud J, Kemi OJ, Ellingsen O. Intensity-controlled treadmill running in rats: VO(2 max) and cardiac hypertrophy. Am J Physiol Heart Circ Physiol 2001;280:H1301–H1310. ArticlePubMed
- 26. Kemi OJ, Loennechen JP, Wisloff U, Ellingsen O. Intensity-controlled treadmill running in mice: cardiac and skeletal muscle hypertrophy. J Appl Physiol (1985) 2002;93:1301–1309. ArticlePubMed
- 27. Hoydal MA, Wisloff U, Kemi OJ, Ellingsen O. Running speed and maximal oxygen uptake in rats and mice: practical implications for exercise training. Eur J Cardiovasc Prev Rehabil 2007;14:753–760. ArticlePubMed
- 28. Aguiar AS Jr, Boemer G, Rial D, Cordova FM, Mancini G, Walz R, et al. High-intensity physical exercise disrupts implicit memory in mice: involvement of the striatal glutathione antioxidant system and intracellular signaling. Neuroscience 2010;171:1216–1227. ArticlePubMed
- 29. Leem YH, Lim HJ, Shim SB, Cho JY, Kim BS, Han PL. Repression of tau hyperphosphorylation by chronic endurance exercise in aged transgenic mouse model of tauopathies. J Neurosci Res 2009;87:2561–2570. ArticlePubMed
- 30. Um HS, Kang EB, Koo JH, Kim HT, Jin L, Kim EJ, et al. Treadmill exercise represses neuronal cell death in an aged transgenic mouse model of Alzheimer's disease. Neurosci Res 2011;69:161–173. ArticlePubMed
- 31. Nam SM, Kim JW, Yoo DY, Choi JH, Kim W, Jung HY, et al. Effects of treadmill exercise on neural stem cells, cell proliferation, and neuroblast differentiation in the subgranular zone of the dentate gyrus in cyclooxygenase-2 knockout mice. Neurochem Res 2013;38:2559–2569. ArticlePubMedPDF
- 32. Clark PJ, Brzezinska WJ, Thomas MW, Ryzhenko NA, Toshkov SA, Rhodes JS. Intact neurogenesis is required for benefits of exercise on spatial memory but not motor performance or contextual fear conditioning in C57BL/6J mice. Neuroscience 2008;155:1048–1058. ArticlePubMed
- 33. Van der Borght K, Kobor-Nyakas DE, Klauke K, Eggen BJ, Nyakas C, Van der Zee EA, et al. Physical exercise leads to rapid adaptations in hippocampal vasculature: temporal dynamics and relationship to cell proliferation and neurogenesis. Hippocampus 2009;19:928–936. ArticlePubMed
- 34. Koehl M, Meerlo P, Gonzales D, Rontal A, Turek FW, Abrous DN. Exercise-induced promotion of hippocampal cell proliferation requires beta-endorphin. FASEB J 2008;22:2253–2262. ArticlePubMed
- 35. Fuss J, Ben Abdallah NM, Vogt MA, Touma C, Pacifici PG, Palme R, et al. Voluntary exercise induces anxiety-like behavior in adult C57BL/6J mice correlating with hippocampal neurogenesis. Hippocampus 2010;20:364–376. ArticlePubMed
- 36. Duman CH, Schlesinger L, Russell DS, Duman RS. Voluntary exercise produces antidepressant and anxiolytic behavioral effects in mice. Brain Res 2008;1199:148–158. ArticlePubMedPMC
- 37. Salam JN, Fox JH, Detroy EM, Guignon MH, Wohl DF, Falls WA. Voluntary exercise in C57 mice is anxiolytic across several measures of anxiety. Behav Brain Res 2009;197:31–40. ArticlePubMed
- 38. Snyder JS, Glover LR, Sanzone KM, Kamhi JF, Cameron HA. The effects of exercise and stress on the survival and maturation of adult-generated granule cells. Hippocampus 2009;19:898–906. ArticlePubMedPMC
- 39. Kannangara TS, Lucero MJ, Gil-Mohapel J, Drapala RJ, Simpson JM, Christie BR, et al. Running reduces stress and enhances cell genesis in aged mice. Neurobiol Aging 2011;32:2279–2286. ArticlePubMed
References
Fig. 1
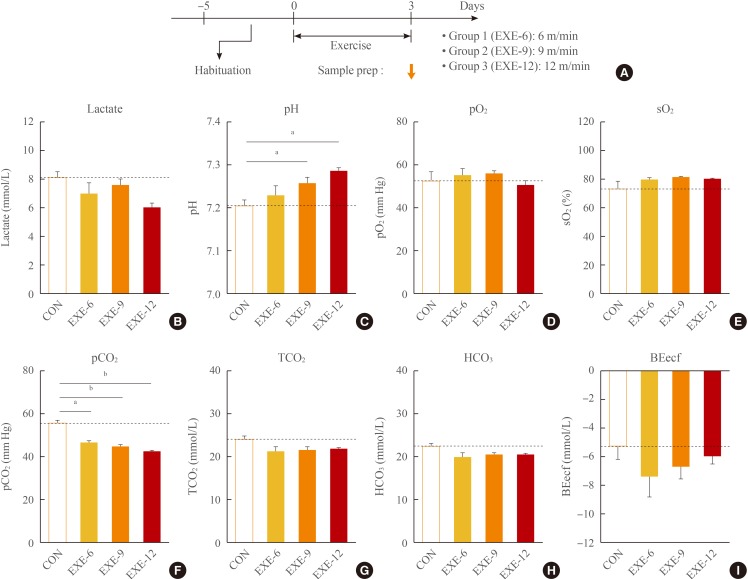
Wheel-running exercise induced speed-dependent changes in physiological parameters in the blood. (A) Experimental design for treatment with passive exercise by placing mice on a running wheel rotating at 6, 9, or 12 m/min for 1 hour per day for 3 days. Physiological parameters in the blood were analyzed with the i-STAT CG4+ cartridge and the i-STAT 1 clinical portable analyzer from Abbott. (B) Lactate levels in the blood of untreated control (CON), and mice with exercise at the speed of 6 m/min (EXE-6), 9 m/min (EXE-9), and 12 m/min (EXE-12). (C) Blood pH levels of untreated CON, and mice with exercise at the speed of EXE-6, EXE-9, and EXE-12. (D, E) Partial pressures of O2 (pO2, D) and saturated O2 (sO2, E) levels in the blood of untreated CON, and mice with exercise at the speed of EXE-6, EXE-9, and EXE-12. (F-I) Partial pressures of CO2 (pCO2, F), total CO2 (TCO2, G), HCO3 (H), and base excess extracellular fluid (BEecf, I) levels in the blood of untreated CON, and mice with exercise at the speed of EXE-6, EXE-9, and EXE-12. Values are expressed as mean±SEM (n=6 to 15). Difference between the indicated groups at aP<0.05; bP<0.01, respectively (one-way analysis of variance followed by the Newman-Keuls test).
Fig. 2

Passive exercise for 7 days increased neurogenesis in the hippocampus. (A) Experimental design for treatment with passive exercise for 1 hour per day for 7 days, and the time point of tissue preparation. (B, C) Representative photomicrographs showing the expression of Ki67 (a marker for progenitor cells, B) and doublecortin (DCX, a marker for differentiating neurons, C) in the dentate gyrus (DG) of the hippocampus of control (CON) mice and mice treated with 7 days of exercise at the speed of 9 m/min (7d EXE). The right box shows high magnification of the area marked in the DG (n=6). Scale bars, 50 µm in B and C.
Fig. 3
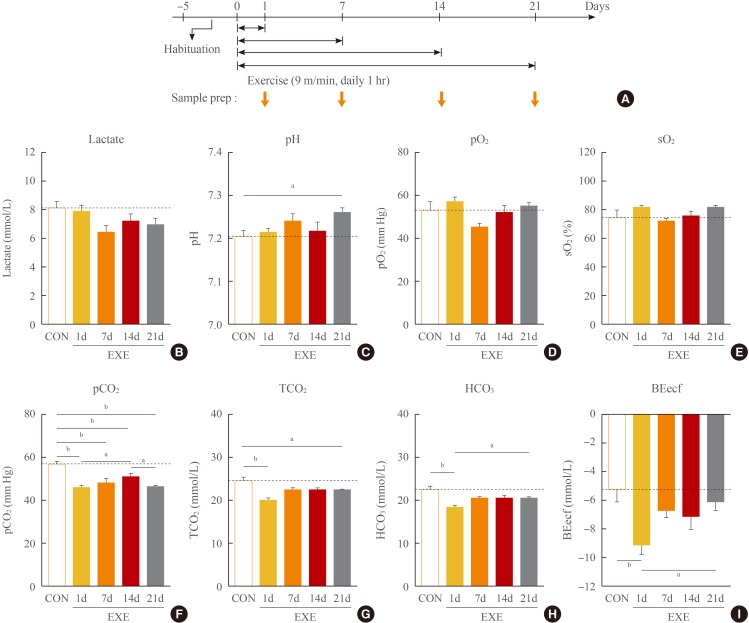
Repeated passive exercise produced changes in physiological parameters in the blood for normal mice. (A) Experimental design for treatment with passive exercise at the speed of 9 m/min for 1 hour per day for 1, 7, 14, and 21 days. Physiological parameters in the blood were analyzed with i-STAT CG4+ cartridge and the i-STAT 1 analyzer from Abbott. (B) Lactate levels measured using i-STAT CG4+ in the blood of untreated control (CON), and mice with daily 1-hour exercise for 1 day (EXE 1d), 7 days (EXE 7d), 14 days (EXE 14d), and 21 days (EXE 21d). (C) Blood pH levels of untreated CON, and mice with 1 hour exercise for 1 day (EXE 1d), 7 days (EXE 7d), 14 days (EXE 14d) and 21 days (EXE 21d). (D, E) Partial pressures of O2 (pO2, D) and saturated O2 (sO2, E) levels in the blood of untreated CON, and mice with daily 1-hour EXE 1d, EXE 7d, EXE 14d, and EXE 21d. (F-I) Partial pressures of CO2 (pCO2, F), total CO2 (TCO2, G), HCO3 (H) and base excess extra cellular fluid (BEecf, I) levels in the blood of untreated CON, and mice with daily 1-hour EXE 1d, EXE 7d, EXE 14d, and EXE 21d. Values are expressed as mean±SEM (n=6 to 15). Difference between the indicated groups at aP<0.05; bP<0.01, respectively (one-way analysis of variance followed by the Newman-Keuls test).
Fig. 4

Repeated passive exercise in mice that had been subjected to chronic repeated stress produced changes in physiological parameters in the blood. (A) Experimental design for treatment with 2 hours×14 days of restraint (RST), and post-stress treatment with exercise (EXE). Mice were treated with 2 hours×14 days RST only, and with 2 hours×14 days RST followed by post-stress treatment with 1 hour of exercise for 14 days (RST+EXE 14d), and 21 days (RST+EXE 21d). Physiological blood parameters were analyzed with i-STAT CG4+ cartridge and the i-STAT 1 analyzer from Abbott. (B) Lactate levels in the blood of control (CON) mice, mice treated with 2 hours×14 days RST only, 2 hours×14 days RST+EXE 14d, and 2 hours×14 days RST+EXE 21d. (C) Blood pH of CON mice, mice treated with 2 hours×14 days RST only, 2 hours×14 days RST+EXE 14d, and 2 hours×14 days RST+EXE 21d. (D, E) Partial pressures of O2 (pO2, D) and saturated O2 (sO2, E) levels in the blood of CON mice, mice treated with 2 hours×14 days RST only, 2 hours×14 days RST+EXE 14d, and 2 hours×14 days RST+EXE 21d. (F-I) Partial pressures of CO2 (pCO2, F), total CO2 (TCO2, G), HCO3 (H), and base excess extra cellular fluid (BEecf, I) levels in the blood of CON mice, mice treated with 2 hours×14 days RST only, 2 hours×14 days RST+EXE 14d, and 2 hours×14 days RST+EXE 21d. Values are expressed as mean±SEM (n=5 to 15). Difference between the indicated group at aP<0.05; bP<0.01, respectively (one-way analysis of variance followed by the Newman-Keuls test).
Figure & Data
References
Citations
Citations to this article as recorded by 
- VTA-projecting cerebellar neurons mediate stress-dependent depression-like behaviors
Soo Ji Baek, Jin Sung Park, Jinhyun Kim, Yukio Yamamoto, Keiko Tanaka-Yamamoto
eLife.2022;[Epub] CrossRef - Blood and affective markers of stress in Elite Airmen during a preparatory training course: A pilot study
S.T. Jenz, C.D. Goodyear, P.R. TSgt Graves, S. Goldstein, M.R. Shia, E.E. Redei
Neurobiology of Stress.2021; 14: 100323. CrossRef - Aggravated mucosal and immune damage in a mouse model of ulcerative colitis with stress
Yanxia Gong, Wei Niu, Yanping Tang, Qingyu Zhang, Simiao Liu, Xi Liu, Xiao Wang, Yang Xu
Experimental and Therapeutic Medicine.2019;[Epub] CrossRef - G9a-Mediated Regulation of OXT and AVP Expression in the Basolateral Amygdala Mediates Stress-Induced Lasting Behavioral Depression and Its Reversal by Exercise
Tae-Kyung Kim, Jung-Eun Lee, Ji-Eun Kim, Jin-Young Park, Juli Choi, Hannah Kim, Eun-Hwa Lee, Pyung-Lim Han
Molecular Neurobiology.2016; 53(5): 2843. CrossRef - Can Exercise Make You Smarter, Happier, and Have More Neurons? A Hormetic Perspective
Simona Gradari, Anna Pallé, Kerry R. McGreevy, Ángela Fontán-Lozano, José L. Trejo
Frontiers in Neuroscience.2016;[Epub] CrossRef - Chronic stress and moderate physical exercise prompt widespread common activation and limited differential activation in specific brain regions
Tae-Kyung Kim, Pyung-Lim Han
Neurochemistry International.2016; 99: 252. CrossRef - Exercise and Depression
Jang Won Son
Endocrinology and Metabolism.2015; 30(3): 270. CrossRef - Antidepressant effects of exercise are produced via suppression of hypocretin/orexin and melanin-concentrating hormone in the basolateral amygdala
Tae-Kyung Kim, Ji-Eun Kim, Jin-Young Park, Jung-Eun Lee, Juli Choi, Hannah Kim, Eun-Hwa Lee, Seung-Woo Kim, Ja-Kyeong Lee, Hyun-Sik Kang, Pyung-Lim Han
Neurobiology of Disease.2015; 79: 59. CrossRef
 PubReader
 Cite
Cite