Articles
- Page Path
- HOME > Endocrinol Metab > Volume 30(4); 2015 > Article
-
Original ArticleClinical Study Characterization of Patients with Type 2 Diabetes according to Body Mass Index: Korea National Health and Nutrition Examination Survey from 2007 to 2011
- Dong-Hwa Lee1, Kyong Yeun Jung1, Kyeong Seon Park1, Kyoung Min Kim1, Jae Hoon Moon1, Soo Lim1,2, Hak Chul Jang1,2, Sung Hee Choi1,2
-
Endocrinology and Metabolism 2015;30(4):514-521.
DOI: https://doi.org/10.3803/EnM.2015.30.4.514
Published online: December 31, 2015
1Division of Endocrinology and Metabolism, Department of Internal Medicine, Seoul National University Bundang Hospital, Seoul National University College of Medicine, Seongnam, Korea.
2Department of Internal Medicine, Seoul National University College of Medicine, Seoul, Korea.
- Corresponding author: Sung Hee Choi. Division of Endocrinology and Metabolism, Department of Internal Medicine, Seoul National University Bundang Hospital, Seoul National University College of Medicine, 82 Gumi-ro 173beon-gil, Bundang-gu, Seongnam 13620, Korea. Tel: +82-31-787-4052, Fax: +82-31-787-7033, drshchoi@snu.ac.kr
• Received: March 24, 2015 • Revised: April 28, 2015 • Accepted: July 2, 2015
Copyright © 2015 Korean Endocrine Society
This is an Open Access article distributed under the terms of the Creative Commons Attribution Non-Commercial License (http://creativecommons.org/licenses/by-nc/3.0/) which permits unrestricted non-commercial use, distribution, and reproduction in any medium, provided the original work is properly cited.
ABSTRACT
-
Background
- The present study aimed to investigate the clinical characteristics of type 2 diabetes mellitus (T2DM) in Korean adults according to body mass index (BMI) and to analyze the association with cardiovascular disease (CVD).
-
Methods
- We conducted a cross-sectional study of data from the Korea National Health and Nutrition Examination Survey from 2007 to 2011. A total of 3,370 patients with T2DM were divided into categories according to BMI. We conducted a comparison of the T2DM patient population composition by BMI category between different countries. We investigated the prevalence of awareness, treatment, and target control of T2DM according to BMI.
-
Results
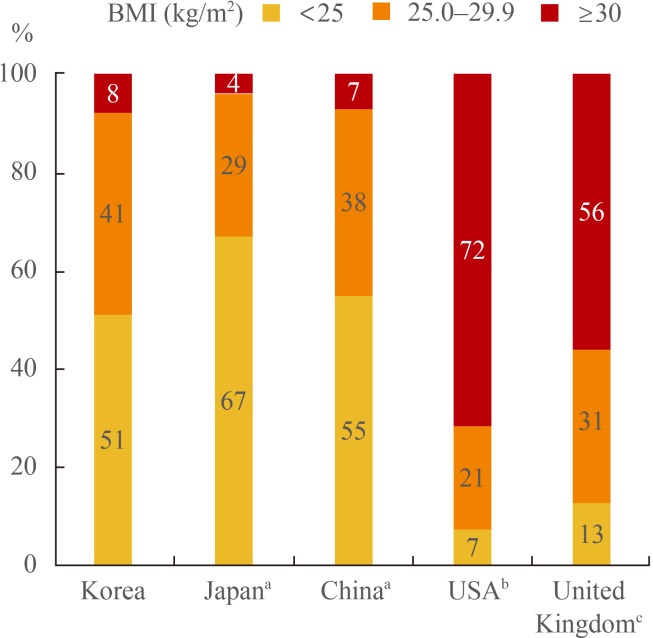
- Patients with T2DM had a higher BMI, and were more likely to have a history of CVD than healthy controls. For Korean adults with T2DM, 8% had BMI ≥30 kg/m2. By contrast, the population of patients with T2DM and BMI ≥30 kg/m2 was 72% in patients in the USA and 56% in the UK. The rate of recognition, treatment, and control has worsened in parallel with increasing BMI. Even in patients with BMI 25 to 29.9 kg/m2, the prevalence of CVD or high risk factors for CVD was significantly higher than in patients with BMI 18.5 to 22.9 kg/m2 (odds ratio, 2.07).
-
Conclusion
- Korean patients with T2DM had lower BMI than those in Western countries. Higher BMI was associated with lower awareness, treatment, and control of diabetes, and a positive association was observed between CVD or high risk factors for CVD and BMI, even for patients who were overweight but not obese.
- Diabetes is the most common chronic metabolic disorder, and the prevalence of type 2 diabetes mellitus (T2DM) is increasing exponentially [1]. According to a report in 2012, 22.3 million people or about 7% of the whole population were diagnosed with diabetes in the USA [2], and according to the Korean Diabetes Association, 4 million people or about 12% of the population over 30 years old have diabetes in 2013. There is increasing prevalence of diabetes in Koreans, so that in 2050, about 6 million people will be diagnosed as having diabetes [3]. More than 50% of Korean T2DM patients are expected to have concomitant abdominal obesity. Concomitant obesity is closely related to insulin resistance and is likely to be associated with metabolic disorders and chronic inflammatory diseases [4]. T2DM and obesity are well-known risk factors for cardiovascular disease (CVD), and it is common for a patient to have both conditions [5]. Obesity in T2DM patients makes the glucose control worse and increases the prevalence of chronic comorbidities including CVD [67]. Appropriate glucose control and reduction of obesity prevalence are important for reduction of mortality because the primary cause of mortality in T2DM is CVD.
- The concomitant prevalence of obesity and T2DM in Korea is increasing, and the prevalence of T2DM in Asian countries including Korea is rapidly increasing because of lifestyle changes, such as a shift toward a Westernized diet and reduced physical activities, migration to urban areas, and genetic-environmental factors [89]. However, a few characteristics differentiate Asian patients with T2DM from Western patients. First, T2DM is prevalent in relatively young patients. Second, the prevalence of CVD is relatively high. Third, Korean patients are prone to insulin resistance despite having relatively low body mass index (BMI), so the prevalence of obese T2DM patients is low relative to that in Western countries [1011]. Therefore, the standard criteria for being overweight or obese in Asia should be lower than those existing at present, because the prevalence of T2DM and complications is increased at BMI that are lower than the Western criteria for being overweight or obese [12]. In Korea, many T2DM treatments are currently only approved for reimbursement according to Western criteria for obesity. For example, glucagon like peptide-1 (GLP-1) agonists were developed as treatment for diabetes mellitus (DM) to reduce blood glucose levels and show an excellent improvement in obesity, but they are only approved for reimbursement for people with BMI ≥30 kg/m2, which is the standard criterion for obesity in Western countries. This treatment is not even approved for people with BMI ≥25 kg/m2, which is the standard criterion for obesity in Asia Pacific countries [13]. Patients in Korea who require proper treatment are being excluded, even though T2DM patients have increased prevalence of complications at lower BMI than patients in Western countries.
- In this study, the characteristics of Korean patients with T2DM were compared with data from Western countries using data from the Korea National Health and Nutrition Examination Survey (KNHANES), a large-scale countrywide database. The distribution of Korean patients according to BMI and the range of BMI that accounts for any change of the prevalence of CVD or high risk factors for CVD were analyzed.
INTRODUCTION
- The fourth (2007 to 2009) and fifth (2010 to 2011) datasets from the KNHANES were used. KNHANES is a cross-sectional population-based investigation conducted by the Ministry of Health and Welfare. The fourth (2007 to 2009) KHANES dataset included 2,300 households in the first year (2007) and 4,600 households in the second and third years (2008 to 2009). The fifth dataset (2010 to 2011) included 3,800 households (2010 to 2011). KNHANES consists of a health questionnaire, nutrition investigation, and health examination investigation [14]. The present study used the health questionnaire and health examination investigation data. KNHANES has been reviewed and approved by the Ethics Committee of the Korea Centers for Disease Control and Prevention (Grants 2007-02CON-04-P, 2008-04EXP-01-C, 2009-01CON-03-2C, 2010-02CON-21-C, and 2011-02CON-06-C).
- In the present study, we used several methods to differentiate patients with DM. First, a check by a physician was conducted of the previous diagnoses of DM made using the questionnaire. Second, patients were classified as having DM when their fasting glucose level was ≥126 mg/dL or hemoglobin A1c (HbA1c) was ≥6.5% as determined from the health examination [15]. Lastly, those people who reported taking oral hypoglycemic agents or administering insulin were classified as having DM. However, the type of diabetes cannot be accurately identified from the KNHANES data. Therefore, we considered that people <30 years old had T1DM based on an epidemiological study of the trend of occurrence of diabetes [16]. In the present study, subjects aged ≥30 years with DM were considered as having T2DM, and were included in the analysis. The rate of diabetes awareness, treatment, and target control was calculated. The rate of awareness was the percentage of patients who were diagnosed as having DM by a physician. Whether diagnosis was performed by a physician was determined from the self-report questionnaire. The rate of treatment was the percentage of the DM patients taking oral hypoglycemic agents or insulin injection, and the rate of target control was the percentage of the DM patients with HbA1c ≤6.5%.
- In this study, obesity was defined according to BMI. In KNHANES, trained examiners measured the height and weight of the subjects in the health examination, and the BMI of the subjects was calculated from these data. The World Health Organization (WHO) defines individuals as overweight with BMI ≥25 kg/m2 and obese with BMI ≥30 kg/m2. The same classification was used in the present study to facilitate comparisons with data from other countries. Data regarding BMI distribution in other countries were obtained from published articles [41117]. Population data from the USA were obtained from the MedMining database, and UK population data were obtained from the hospital electronic diabetes register in Liverpool. Data from Asian countries were obtained from a cross-sectional pooled analysis in the Asia cohort consortium. The prevalence of CVD events was determined from the health interview survey. In this study, we defined CVD events as stroke, myocardial infarction (MI), or angina. We also defined hyper-tension and dyslipidemia as high risk factors for CVD and their prevalence was obtained from the health questionnaire.
- Statistical analysis
- The results of continuous data are presented as the mean±SD and categorical data are presented as the percentages of the total data. BMI was categorized into five groups: <18.5, 18.5 to 22.9, 23 to 24.9, 25 to 29.9, and ≥30 kg/m2, and the rate of diabetes awareness, treatment, and target control was calculated for each category. To compare the demographics and clinical manifestations between the T2DM patients ≥30 years old and non-diabetic subjects, Student t test was applied to continuous data, chi-square test to categorical data, and percentage comparisons to the rate of awareness, treatment, and target control. The composite end point (one or more of the following: hypertension, dyslipidemia, stroke, MI, or angina) was used to calculate the prevalence of CVD or high risk factors for CVD according to BMI, and the odds ratio (OR) adjusted for age and smoking and the 95% confidence interval (CI) were estimated with multiple logistic regressions.
- All the statistical analyses were performed using IBM SPSS version 22.0 (IBM Co., Armonk, NY, USA). P<0.05 was considered significant.
METHODS
- Subject disposition and baseline characteristics
- We selected 30,958 subjects ≥30 years old at the time of screening from the 50,405 patients included in the fourth and fifth KNHANES. In our analysis, 19,088 (19,088/30,958, 62%) were excluded for the following reasons: 18,917 (18,917/19,088, 99%) because of the absence of HbA1c data, and 171 because of the absence of data for their BMI, blood pressure, cholesterol, or record of disease history. Ultimately, 3,370 T2DM patients and 8,500 non-diabetic subjects were included in the analyses (Fig. 1). The demographic and clinical characteristics for these diabetic patients and non-diabetic subjects are presented in Table 1. The proportion of men was higher in the diabetic group (50.3% vs. 41.5%, P<0.001), and the patients in the diabetic group were older than non-diabetic subjects (62.2±11.4 years vs. 52.8±14.1 years, P<0.001). Patients in the diabetic group had higher mean BMI (25.1±3.5 kg/m2 vs. 23.7±3.2 kg/m2, P<0.001). The prevalence of obese patients was also higher in the diabetic group (BMI 25.0 to 29.9 kg/m2, 41.1% vs. 28.1%, P<0.001; BMI ≥30 kg/m2, 7.6% vs. 3.1%, P<0.001). A history of stroke, MI, or angina was higher in the diabetic group (stroke, 5.8% vs. 1.8%, P<0.001; and MI or angina, 7.5% vs. 2.7%, P<0.001).
- Distribution of the BMI in type 2 diabetes
- The distribution of BMI (<25, 25 to 29.9, ≥30 kg/m2) was evaluated within the diabetic group. The results were as follows: 51% were <25 kg/m2, 41% were 25 to 29.9 kg/m2, and 8% were ≥30 kg/m2. Therefore, 92% of Korean patients with T2DM had a BMI <30 kg/m2, and only about 8% of the patients had a BMI ≥30 kg/m2, meeting the Western criterion standard for obesity. Japanese and Chinese patients with T2DM showed a similar distribution [11]; however, the BMI distribution of T2DM patients from the USA and UK was different. In the patients in the USA [17], BMI distribution was 7% in the <25 kg/m2 category, 21% were 25 to 29.9 kg/m2, and 72% were ≥30 kg/m2, and in patients in the UK [4], BMI distribution was 13% in the <25 kg/m2 category, 31% were 25 to 29.9 kg/m2, and 56% were ≥30 kg/m2 (Fig. 2).
- Distribution of recognition, treatment and control rate according to BMI categories
- This study determined the rate of diabetes awareness, treatment, and target control based on the BMI of T2DM patients. In Korea, more than 50% of patients were <25 kg/m2; so the patients were categorized as follows: <18.5, 18.5 to 22.9, 23 to 24.9, 25 to 29.9, ≥30 kg/m2. The rate of diabetes awareness was: 84.4% for T2DM patients in the <18.5 kg/m2 category, 80.1% for 18.5 to 22.9 kg/m2, 75.2% for 23 to 24.9 kg/m2, 71.9%, for 25 to 29.9 kg/m2, and 65.1% for ≥30 kg/m2. The rate of treatment was: 59.2% for T2DM patients in the <18.5 kg/m2 category, 65.1% for 18.5 to 22.9 kg/m2, 61.5% for 23 to 24.9 kg/m2, 58.6% for 25 to 29.9 kg/m2, and 52.3% for ≥30 kg/m2. The rate of diabetes in T2DM patients achieving a HbA1c below 6.5% was 35.6% for the patients in the <18.5 kg/m2 category, 30.0% for 18.5 to 22.9 kg/m2, 25.0% for 23 to 24.9 kg/m2, 24.4% for 25 to 29.9 kg/m2, and 28.9% in ≥30 kg/m2. Therefore, as BMI increases, the rate of awareness, treatment, and target control trended downward. The results are presented in Table 2.
- Association between BMI and CVD or high risk factors of CVD in type 2 diabetes
- Differences in the prevalence of CVD or high risk factors for CVD in T2DM patients according to their BMI are presented in Fig. 3. Subjects in the normal BMI range of 18.5 to 22.9 kg/m2 were categorized as a reference group for comparison with other groups. After adjusting for other risk factors for CVD such as age and smoking, in the low weight group with BMI <18.5 kg/m2, OR for prevalence was 1.00 (95% CI, 0.54 to 1.85), and in the overweight group with BMI 23 to 24.9 kg/m2, the OR was 1.39 (95% CI, 1.13 to 1.71). In the obese group with BMI 25 to 29.9 kg/m2, the OR was 2.07 (95% CI, 1.72 to 2.50), and in the extremely obese group with BMI ≥30 kg/m2, the OR was 2.56 (95% CI, 1.85 to 3.53). These results indicated that the prevalence of CVD or high risk factors for CVD increases significantly in obese subjects when compared with those with normal BMI.
RESULTS
- This study analyzed data from KNHANES, and of the 11,870 subjects ≥30 years old, 3,370 subjects or about 28% were classified as having T2DM. Patients in the T2DM group were on average older and had higher BMI than subjects in the non-diabetic group. Patients in the T2DM group also had a significantly higher prevalence of stroke and MI or angina. In the present study, we found that 92% of Korean T2DM patients had BMI <30 kg/m2. The prevalence of T2DM patients with BMI ≥30 kg/m2 was 72% in the USA and 56% in the UK, which indicated that the Korean patients have significantly lower BMI [41718]. From the results of this study, the rate of diabetes awareness, treatment, and target control tended to decrease with an increase in BMI. Because the prevalence of T2DM increased according to increase of BMI, patients who were not aware of their DM tended to be obese. In addition, obese people tend to have higher calorie intake, habit of binge eating, and also low physical activity than non-obese subjects. Obesity is also associated with higher insulin resistance [1920]. We have to consider many aspects of obesity and bad glycemic control in patients with T2DM who are obese. The findings of the present study indicated that more frequent screening for T2DM and strict glycemic control are required for obese T2DM patients. The prevalence of CVD or high risk factors for CVD in T2DM patients increased with increasing BMI. Compared with the normal BMI group, the ORs in the 23 to 24.9 kg/m2 category and the 25 to 29.9 kg/m2 category were 1.39 and 2.07, respectively, which confirms the increase in CVD or high risk factors for CVD prevalence with relatively low BMI values.
- The relatively low BMI in T2DM patients is the trend in most Asian countries, including Korea [17]. Although relatively lower than in Western countries, the prevalence of overweight and obese patients is generally increasing in Asian countries, and the prevalence and distribution differ by country. According to results reported in 2006 [21], the Asian country with the highest prevalence of overweight people was Thailand, where about 6.8% of adults are obese. The lowest prevalence was found in India and the Philippines, where 2.2% and 3.3% of adults are obese, respectively. This prevalence is low compared with the findings for the USA, where 30% of adults are obese. In 2011, a study analyzed 900,000 Asian patients and reported that the mean BMI in Asian patients with DM was 23.1 kg/m2. The BMI differed by country, with Bangladesh having the lowest mean BMI for patients with DM at 19.8 kg/m2. The means were 23.6 kg/m2 in Korea, 23.2 kg/m2 in Japan, and 23.1 kg/m2 in China [11]. The recent study suggested that BMI ≥23 kg/m2 may be practical for the screening of T2DM in Asian Americans [22]. The International Association for the Study of Obesity, the International Obesity Task Force, and the WHO suggest that an Asian adult should be classified as overweight when their BMI is 23 to 24.9 kg/m2, and obese when their BMI is ≥25 kg/m2 [23].
- It is well known that the mortality and morbidity because of CVD and overall mortality increase with increasing obesity [242526]. However, there have been insufficient studies on CVD prevalence and mortality based on BMI in diabetic patients, and there are discrepancies among the results from published studies. A study conducted in the UK that analyzed the mortality of 44,230 T2DM patients found the hazard ratios (HRs) for BMI 25 to 29, 30 to 34, and 35 to 54 kg/m2 were 0.97, 1.13, and 1.43, respectively [27]. An observational study in Sweden that followed up 13,087 T2DM patients for 5.6 years found the HRs for the prevalence of CVD and mortality in overweight patients with BMI 25 to 29.9 kg/m2 to be 1.27 and 1.16, respectively, and in obese patients with BMI ≥30 kg/m2 the HRs were 1.44 and 1.71, respectively [28]. There were small differences between studies, but the HR for the prevalence of CVD and mortality in the patients increased with higher BMI values. The results could not be compared directly with other studies; but in the present study, the OR of prevalence of CVD or high risk factors for CVD was 1.39 in BMI 23 to 24.9 kg/m2 and 2.07 in BMI 25 to 29.9 kg/m2. This shows that the prevalence of CVD or high risk factors for CVD can increase significantly even at a lower BMI compared with studies conducted in Western countries.
- It is well known that weight reduction in addition to glucose control decreases the risk of CVD in DM patients [22]. As DM is a progressive disease, the optimal treatment could not be achieved in general with just one medication, and therefore combination therapy is often required. However, because many antidiabetic agents including sulfonylurea and thiazolidinedione are relating to weight gain; thus, certain combination therapy result in increasing body weight of patients. Among antidiabetic agents, GLP-1 agonists such as exenatide, liraglutide, and lixisenatide are known to have benefits for weight loss, and their use is expected to have a direct and indirect effect on reducing CVD risks [29]. Several studies were conducted using GLP-1 agonists, and the effects of glycemic control and weight reduction were proven in most studies [3031323334353637]. However, in Korea, reimbursements by national medical insurance system are only available for T2DM patients with BMI ≥30 kg/m2. As presented in the results of this study, patients with T2DM in that category of BMI ≥30 kg/m2 accounted for only 8% of the total adult population diagnosed as T2DM. The present study found that the prevalence of CVD and high risk factors for CVD was significantly increased even in overweight (BMI ≥23 kg/m2) T2DM patients. Therefore, the cut-value of obesity for the use of medications such as GLP-1 agonists, especially for considering reimbursement, should be reconsidered in accordance with the criterion for obesity in Asian population.
- One of the strengths of this study is the inclusion of a large population in the analysis because of the use of KNHANES data, which permitted the results to be compared with those from other countries. There have been few studies on Asian populations that investigated BMI and its association with glucose control and the prevalence of CVD or high risk factors for CVD. The results of the present study add evidence to support the opinion that the criterion for obesity in T2DM patients should be different in Asian populations compared with Western populations. However, there are a number of limitations to this study. The KNHANES data did not indicate type of diabetes, and we classified patients as having T2DM according to their age. Therefore, other types of diabetes may have been included. This study was not longitudinal, but a cross-sectional study that only compared the data at the time of the survey. The prevalence of diseases such as stroke, MI, angina, hypertension, or dyslipidemia was determined at the time of the survey, which limits the interpretation of findings. In addition, information regarding the presence of disease was obtained by a health questionnaire so there might have been recall bias.
- In conclusion, 92% of Korean T2DM patients had BMI <30 kg/m2, indicating that the proportion of non-obese patients was higher than for T2DM patients in Western countries. However, higher BMI resulted in a lower rate of diabetes awareness, treatment, and target control. In particular, the prevalence of CVD or high risk factors for CVD was significantly increased even in the non-obese population with BMI ≥23 kg/m2. Therefore, in the management of adult DM patients in Korea, weight control is important in achieving an appropriate glucose control and a reduction in CVD or risk factors for CVD prevalence. An appropriate longitudinal study is warranted to determine the relationship between BMI and CVD prevalence.
DISCUSSION
-
Acknowledgements
- This study was conducted using raw data from the KNHANES IV and V datasets performed by the Korean Centers for Disease Control and Prevention and Sungju Kim contributed to data analysis.
ACKNOWLEDGMENTS
-
CONFLICTS OF INTEREST: No potential conflict of interest relevant to this article was reported.
Article information
- 1. Wild S, Roglic G, Green A, Sicree R, King H. Global prevalence of diabetes: estimates for the year 2000 and projections for 2030. Diabetes Care 2004;27:1047–1053. ArticlePubMed
- 2. American Diabetes Association. Economic costs of diabetes in the US in 2012. Diabetes Care 2013;36:1033–1046. ArticlePubMedPMC
- 3. The Taskforce Team of Diabetes Fact Sheet of the Korean Diabetes Association. Diabetes fact sheet in Korea 2013; Seoul: Korean Diabetes Association; 2013.
- 4. Daousi C, Casson IF, Gill GV, MacFarlane IA, Wilding JP, Pinkney JH. Prevalence of obesity in type 2 diabetes in secondary care: association with cardiovascular risk factors. Postgrad Med J 2006;82:280–284. ArticlePubMedPMC
- 5. Yatsuya H, Li Y, Hilawe EH, Ota A, Wang C, Chiang C, et al. Global trend in overweight and obesity and its association with cardiovascular disease incidence. Circ J 2014;78:2807–2818. ArticlePubMed
- 6. Shera AS, Jawad F, Maqsood A, Jamal S, Azfar M, Ahmed U. Prevalence of chronic complications and associated factors in type 2 diabetes. J Pak Med Assoc 2004;54:54–59. PubMed
- 7. Ridderstrale M, Gudbjornsdottir S, Eliasson B, Nilsson PM, Cederholm J. Steering Committee of the Swedish National Diabetes Register (NDR). Obesity and cardiovascular risk factors in type 2 diabetes: results from the Swedish National Diabetes Register. J Intern Med 2006;259:314–322. ArticlePubMed
- 8. Chan JC, Malik V, Jia W, Kadowaki T, Yajnik CS, Yoon KH, et al. Diabetes in Asia: epidemiology, risk factors, and pathophysiology. JAMA 2009;301:2129–2140. ArticlePubMed
- 9. Hu FB. Globalization of diabetes: the role of diet, lifestyle, and genes. Diabetes Care 2011;34:1249–1257. ArticlePubMedPMC
- 10. Ramachandran A, Ma RC, Snehalatha C. Diabetes in Asia. Lancet 2010;375:408–418. ArticlePubMed
- 11. Boffetta P, McLerran D, Chen Y, Inoue M, Sinha R, He J, et al. Body mass index and diabetes in Asia: a cross-sectional pooled analysis of 900,000 individuals in the Asia cohort consortium. PLoS One 2011;6:e19930ArticlePubMedPMC
- 12. Hsu WC, Araneta MR, Kanaya AM, Chiang JL, Fujimoto W. BMI cut points to identify at-risk Asian Americans for type 2 diabetes screening. Diabetes Care 2015;38:150–158. ArticlePubMed
- 13. Pan WH, Yeh WT. How to define obesity? Evidence-based multiple action points for public awareness, screening, and treatment: an extension of Asian-Pacific recommendations. Asia Pac J Clin Nutr 2008;17:370–374. PubMed
- 14. Choi HS, Oh HJ, Choi H, Choi WH, Kim JG, Kim KM, et al. Vitamin D insufficiency in Korea: a greater threat to younger generation: the Korea National Health and Nutrition Examination Survey (KNHANES) 2008. J Clin Endocrinol Metab 2011;96:643–651. ArticlePubMedPDF
- 15. American Diabetes Association. Standards of medical care in diabetes: 2014. Diabetes Care 2014;37(Suppl 1):S14–S80. ArticlePubMed
- 16. Rhee BD. Epidemiological characteristics of diabetes mellitus among Korean population. J Korean Diabetes Assoc 2003;27:173–178.
- 17. Ganz ML, Wintfeld N, Li Q, Alas V, Langer J, Hammer M. The association of body mass index with the risk of type 2 diabetes: a case-control study nested in an electronic health records system in the United States. Diabetol Metab Syndr 2014;6:50ArticlePubMedPMC
- 18. Nguyen NT, Nguyen XM, Lane J, Wang P. Relationship between obesity and diabetes in a US adult population: findings from the National Health and Nutrition Examination Survey, 1999-2006. Obes Surg 2011;21:351–355. ArticlePubMed
- 19. Kahn SE, Hull RL, Utzschneider KM. Mechanisms linking obesity to insulin resistance and type 2 diabetes. Nature 2006;444:840–846. ArticlePubMedPDF
- 20. Kavouras SA, Panagiotakos DB, Pitsavos C, Chrysohoou C, Anastasiou CA, Lentzas Y, et al. Physical activity, obesity status, and glycemic control: The ATTICA study. Med Sci Sports Exerc 2007;39:606–611. ArticlePubMed
- 21. Yoon KH, Lee JH, Kim JW, Cho JH, Choi YH, Ko SH, et al. Epidemic obesity and type 2 diabetes in Asia. Lancet 2006;368:1681–1688. ArticlePubMed
- 22. Araneta MR, Kanaya AM, Hsu WC, Chang HK, Grandinetti A, Boyko EJ, et al. Optimum BMI cut points to screen asian americans for type 2 diabetes. Diabetes Care 2015;38:814–820. ArticlePubMedPMC
- 23. Low S, Chin MC, Ma S, Heng D, Deurenberg-Yap M. Rationale for redefining obesity in Asians. Ann Acad Med Singapore 2009;38:66–69. ArticlePubMed
- 24. Adams KF, Schatzkin A, Harris TB, Kipnis V, Mouw T, Ballard-Barbash R, et al. Overweight, obesity, and mortality in a large prospective cohort of persons 50 to 71 years old. N Engl J Med 2006;355:763–778. ArticlePubMed
- 25. Bogers RP, Bemelmans WJ, Hoogenveen RT, Boshuizen HC, Woodward M, Knekt P, et al. Association of overweight with increased risk of coronary heart disease partly independent of blood pressure and cholesterol levels: a meta-analysis of 21 cohort studies including more than 300,000 persons. Arch Intern Med 2007;167:1720–1728. ArticlePubMed
- 26. Jee SH, Sull JW, Park J, Lee SY, Ohrr H, Guallar E, et al. Body-mass index and mortality in Korean men and women. N Engl J Med 2006;355:779–787. ArticlePubMed
- 27. Mulnier HE, Seaman HE, Raleigh VS, Soedamah-Muthu SS, Colhoun HM, Lawrenson RA. Mortality in people with type 2 diabetes in the UK. Diabet Med 2006;23:516–521. ArticlePubMed
- 28. Eeg-Olofsson K, Cederholm J, Nilsson PM, Zethelius B, Nunez L, Gudbjornsdóttir S, et al. Risk of cardiovascular disease and mortality in overweight and obese patients with type 2 diabetes: an observational study in 13,087 patients. Diabetologia 2009;52:65–73. ArticlePubMedPDF
- 29. Chen Y, Copeland WK, Vedanthan R, Grant E, Lee JE, Gu D, et al. Association between body mass index and cardiovascular disease mortality in east Asians and south Asians: pooled analysis of prospective data from the Asia Cohort Consortium. BMJ 2013;347:f5446ArticlePubMedPMC
- 30. Look AHEAD Research Group. Pi-Sunyer X, Blackburn G, Brancati FL, Bray GA, Bright R, et al. Reduction in weight and cardiovascular disease risk factors in individuals with type 2 diabetes: one-year results of the look AHEAD trial. Diabetes Care 2007;30:1374–1383. ArticlePubMedPMC
- 31. Meier JJ. GLP-1 receptor agonists for individualized treatment of type 2 diabetes mellitus. Nat Rev Endocrinol 2012;8:728–742. ArticlePubMedPDF
- 32. Buse JB, Henry RR, Han J, Kim DD, Fineman MS, Baron AD, et al. Effects of exenatide (exendin-4) on glycemic control over 30 weeks in sulfonylurea-treated patients with type 2 diabetes. Diabetes Care 2004;27:2628–2635. ArticlePubMed
- 33. Kendall DM, Riddle MC, Rosenstock J, Zhuang D, Kim DD, Fineman MS, et al. Effects of exenatide (exendin-4) on glycemic control over 30 weeks in patients with type 2 diabetes treated with metformin and a sulfonylurea. Diabetes Care 2005;28:1083–1091. ArticlePubMed
- 34. DeFronzo RA, Ratner RE, Han J, Kim DD, Fineman MS, Baron AD. Effects of exenatide (exendin-4) on glycemic control and weight over 30 weeks in metformin-treated patients with type 2 diabetes. Diabetes Care 2005;28:1092–1100. ArticlePubMed
- 35. Heine RJ, Van Gaal LF, Johns D, Mihm MJ, Widel MH, Brodows RG, et al. Exenatide versus insulin glargine in patients with suboptimally controlled type 2 diabetes: a randomized trial. Ann Intern Med 2005;143:559–569. ArticlePubMed
- 36. Garber A, Henry R, Ratner R, Garcia-Hernandez PA, Rodriguez-Pattzi H, Olvera-Alvarez I, et al. Liraglutide versus glimepiride monotherapy for type 2 diabetes (LEAD-3 Mono): a randomised, 52-week, phase III, double-blind, parallel-treatment trial. Lancet 2009;373:473–481. ArticlePubMed
- 37. Marre M, Shaw J, Brandle M, Bebakar WM, Kamaruddin NA, Strand J, et al. Liraglutide, a once-daily human GLP-1 analogue, added to a sulphonylurea over 26 weeks produces greater improvements in glycaemic and weight control compared with adding rosiglitazone or placebo in subjects with type 2 diabetes (LEAD-1 SU). Diabet Med 2009;26:268–278. ArticlePubMedPMC
References
Fig. 1

Study population flow diagram. KNHANES, Korea National Health and Nutrition Examination Survey; HbA1c, hemoglobin A1c; BMI, body mass index; SBP, systolic blood pressure.
Fig. 2

Distribution of the body mass index (BMI) in type 2 diabetes according to country. aData were adopted from reference [11]; bData were adopted from reference [17]; cData were adopted from reference [4].
Fig. 3
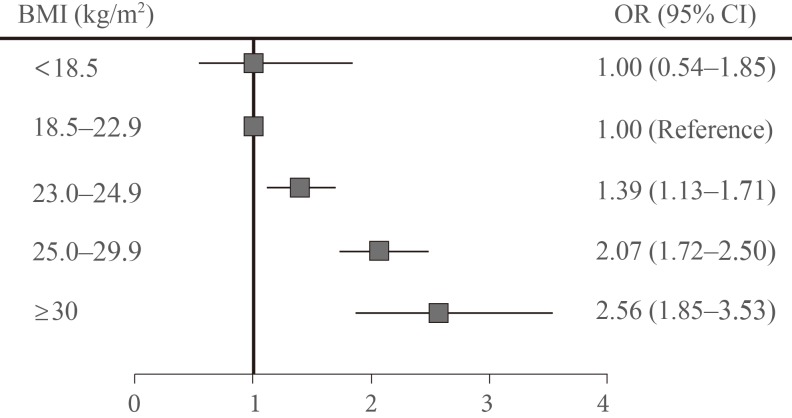
Odds ratio (OR) of prevalence of cardiovascular disease (stroke, myocardial infarction [MI], or angina) or high risk factors for cardiovascular disease (hypertension, dyslipidemia) according to body mass index (BMI) categories. BMI of 18.5 to 22.9 kg/m2 as reference group. Using composite endpoint: stroke, MI or angina, hypertension, and dyslipidemia. Adjusted by age and smoking. CI, confidence interval.
Table 1
![enm-30-514-i001.jpg]()
Demographic and Clinical Characteristics of the Study Population
Figure & Data
References
Citations
Citations to this article as recorded by 
- Influenza vaccination trend and related factors among patients with diabetes in Korea: Analysis using a nationwide database
Dong-Hwa Lee, Bumhee Yang, Seonhye Gu, Eung-Gook Kim, Youlim Kim, Hyung Koo Kang, Yeong Hun Choe, Hyun Jeong Jeon, Seungyong Park, Hyun Lee
Frontiers in Endocrinology.2023;[Epub] CrossRef - Diet Quality Scores and Asthenoteratozoospermia Risk: Finding From a Hospital-Based Case–Control Study in China
Qi Cui, Hui-Han Wang, Qi-Jun Wu, Xiao-Bin Wang, Ren-Hao Guo, Xu Leng, Xiao-Ling Tan, Qiang Du, Bo-Chen Pan
Frontiers in Nutrition.2022;[Epub] CrossRef - Obesity definition for personalised treatment of type 2 diabetes Authors’ reply
Ildiko Lingvay, Priya Sumithran, Ricardo V Cohen, Carel W le Roux
The Lancet.2022; 399(10342): 2189. CrossRef - Secular trends and determinants of influenza vaccination uptake among patients with cardiovascular disease in Korea: Analysis using a nationwide database
Min Kim, Bumhee Yang, Seonhye Gu, Eung-Gook Kim, So Rae Kim, Kyeong Seok Oh, Woong-Su Yoon, Dae-Hwan Bae, Ju Hee Lee, Sang Min Kim, Woong Gil Choi, Jang-Whan Bae, Kyung-Kuk Hwang, Dong-Woon Kim, Myeong-Chan Cho, Hyun Lee, Dae-In Lee
Frontiers in Cardiovascular Medicine.2022;[Epub] CrossRef - Triglyceride glucose (TyG) index as a predictor of incident type 2 diabetes among nonobese adults: a 12-year longitudinal study of the Korean Genome and Epidemiology Study cohort
Byoungjin Park, Hye Sun Lee, Yong-Jae Lee
Translational Research.2021; 228: 42. CrossRef - Gamitaeeumjowee-Tang for weight loss in diabetic patients: A retrospective chart review
A-Reum Lee, Da-Yeon Lee, Min-Ji Kim, Hyang-Sook Lee, Ka-Hye Choi, Seo-Young Kim, Young-Woo Lim, Young-Bae Park
Journal of Korean Medicine.2021; 42(1): 46. CrossRef - Effect of cilostazol, a phosphodiesterase‐3 inhibitor, on coronary artery stenosis and plaque characteristics in patients with type 2 diabetes: ESCAPE study
Dong‐Hwa Lee, Eun Ju Chun, Tae Jung Oh, Kyoung Min Kim, Jae Hoon Moon, Sung Hee Choi, Kyong Soo Park, Hak Chul Jang, Soo Lim
Diabetes, Obesity and Metabolism.2019; 21(6): 1409. CrossRef - The Differential Role of Vitamin D in Type 2 Diabetes Management and Control in Minority Populations
Miyong To Kim, Kim Byeng Kim, Jisook Ko, Nicole Murry, David Levine, Ju-Young Lee
Journal of Immigrant and Minority Health.2019; 21(6): 1266. CrossRef - House dust mite and Cockroach specific Immunoglobulin E sensitization is associated with diabetes mellitus in the adult Korean population
Mee Kyoung Kim, Jee Sun Jeong, Kyungdo Han, Ki Hyun Baek, Ki-Ho Song, Hyuk-Sang Kwon
Scientific Reports.2018;[Epub] CrossRef - Long‐term effects on glycaemic control and β‐cell preservation of early intensive treatment in patients with newly diagnosed type 2 diabetes: A multicentre randomized trial
Suk Chon, Sang Youl Rhee, Kyu Jeung Ahn, Sei Hyun Baik, Yongsoo Park, Moon Suk Nam, Kwan Woo Lee, Soon Jib Yoo, Gwanpyo Koh, Dae Ho Lee, Young Seol Kim, Jeong‐Taek Woo
Diabetes, Obesity and Metabolism.2018; 20(5): 1121. CrossRef - Association between Body Weight Changes and Menstrual Irregularity: The Korea National Health and Nutrition Examination Survey 2010 to 2012
Kyung Min Ko, Kyungdo Han, Youn Jee Chung, Kun-Ho Yoon, Yong Gyu Park, Seung-Hwan Lee
Endocrinology and Metabolism.2017; 32(2): 248. CrossRef - Abnormal subchondral bone remodeling and its association with articular cartilage degradation in knees of type 2 diabetes patients
Yan Chen, Yong-Can Huang, Chun Hoi Yan, Kwong Yuen Chiu, Qingjun Wei, Jingmin Zhao, X Edward Guo, Frankie Leung, William W Lu
Bone Research.2017;[Epub] CrossRef - Social Networking Services-Based Communicative Care for Patients with Diabetes Mellitus in Korea
Hun-Sung Kim, Yoo Jeong, Sun Baik, So Yang, Tong Kim, Hyunah Kim, Hyunyong Lee, Seung-Hwan Lee, Jae Cho, In-Young Choi, Kun-Ho Yoon
Applied Clinical Informatics.2016; 07(03): 899. CrossRef - Pharmacological Management of Obesity in Patients with Type 2 Diabetes: An Update
Eun Ju Lee, Tae Nyun Kim
The Korean Journal of Obesity.2016; 25(3): 121. CrossRef - Response: Characterization of Patients with Type 2 Diabetes according to Body Mass Index: Korea National Health and Nutrition Examination Survey from 2007 to 2011 (Endocrinol Metab 2015;30:514-21, Dong-Hwa Lee et al.)
Sung Hee Choi
Endocrinology and Metabolism.2016; 31(2): 347. CrossRef - Letter: Characterization of Patients with Type 2 Diabetes according to Body Mass Index: Korea National Health and Nutrition Examination Survey from 2007 to 2011 (Endocrinol Metab 2015;30:514-21, Dong-Hwa Lee et al.)
Eun-Hee Cho
Endocrinology and Metabolism.2016; 31(2): 345. CrossRef
 PubReader
 Cite
Cite