Articles
- Page Path
- HOME > Endocrinol Metab > Volume 31(3); 2016 > Article
-
Original ArticleClinical Study Comparison of Age of Onset and Frequency of Diabetic Complications in the Very Elderly Patients with Type 2 Diabetes
-
Bong-Ki Lee
 , Sang-Wook Kim, Daehee Choi, Eun-Hee Cho
 -
Endocrinology and Metabolism 2016;31(3):416-423.
DOI: https://doi.org/10.3803/EnM.2016.31.3.416
Published online: August 26, 2016
Department of Internal Medicine, Kangwon National University School of Medicine, Chuncheon, Korea.
- Corresponding author: Eun-Hee Cho. Department of Internal Medicine, Kangwon National University Hospital, Kangwon National University School of Medicine, 1 Gangwondaehak-gil, Chuncheon 24341, Korea. Tel: +82-33-258-9167, Fax: +82-33-258-2455, ehcho@kangwon.ac.kr
Copyright © 2016 Korean Endocrine Society
This is an Open Access article distributed under the terms of the Creative Commons Attribution Non-Commercial License (http://creativecommons.org/licenses/by-nc/3.0/) which permits unrestricted non-commercial use, distribution, and reproduction in any medium, provided the original work is properly cited.
ABSTRACT
-
Background
- The prevalence of type 2 diabetes in elderly people has increased dramatically in the last few decades. This study was designed to clarify the clinical characteristics of type 2 diabetes in patients aged ≥80 years according to age of onset.
-
Methods
- We reviewed the medical records of 289 patients aged ≥80 years with type 2 diabetes at the outpatient diabetes clinics of Kangwon National University Hospital from September 2010 to June 2014. We divided the patients into middle-age-onset diabetes (onset before 65 years of age) and elderly-onset diabetes (onset at 65+ years of age).
-
Results
- There were 141 male and 148 female patients. The patients had a mean age of 83.2±2.9 years and the mean duration of diabetes was 14.3±10.4 years. One hundred and ninety-nine patients had elderly-onset diabetes. The patients with elderly-onset diabetes had a significantly lower frequency of diabetic retinopathy and nephropathy, lower serum creatinine levels, lower glycated hemoglobin (HbA1c) levels, and similar coronary revascularization and cerebral infarction rates compared to those with middle-age-onset diabetes. There was no frequency difference in coronary revascularization and cerebral infarction and HbA1c levels between three subgroups (<5, 5 to 15, and ≥15 years) of diabetes duration in elderly onset diabetes. However, both in the elderly onset diabetes and middle-age-onset diabetes, the cumulative incidence of retinopathy was increasing rapidly according to the duration of diabetes.
-
Conclusion
- We report that individuals with elderly-onset diabetes have a lower frequency of diabetic retinopathy and nephropathy and similar cardiovascular complications compared to those with middle-age-onset diabetes.
- The prevalence of type 2 diabetes in elderly people has increased dramatically in the last few decades because of the improved survival rates of diabetic patients [1]. This in turn is related to better general life conditions, including effective therapeutic interventions, and increased life expectancy with consequent late onset of diabetes [2]. Among adults aged ≥70 years, the prevalence of diabetes defined by fasting plasma glucose and glycated hemoglobin (HbA1c) in Korea in 2011 was estimated to be 25.9% [3]. In developed countries, with increased lifespans, the highest prevalence of diabetes is at age ≥65 years; in developing countries, the majority of people with diabetes are 45 to 64 years old [4]. Elderly-onset diabetes is getting more percentage of diabetes in older elderly people of age 100+ year-old [5] compared to middle-age-onset diabetes.
- The development of type 2 diabetes in the elderly (elderly-onset diabetes) may be somewhat different from that in adulthood (middle-age-onset diabetes). However, there are few studies of the clinical characteristics of elderly type 2 diabetic patients [67].
- We compared the clinical characteristics of type 2 diabetes in patients aged ≥80 years according to age at onset of diabetes (middle-age-onset diabetes vs. elderly-onset diabetes) and age group (80 to 85, 86 to 90, and 91+ years). To evaluate the effect of diabetes duration on the cardiovascular and microvascular complication in elderly-onset diabetes, we made subgroup analysis according to the duration of diabetes (<5, 5 to 15, ≥15 years) in elderly-onset diabetes.
INTRODUCTION
- Patients
- This study was a retrospective observational study. We reviewed the medical records of 357 patients with type 2 diabetes aged ≥80 years among the 3,824 adults with type 2 diabetes attending the outpatient diabetes clinics of Kangwon National University Hospital in the city of Chuncheon from September 2010 to June 2014.
- We defined individuals aged ≥65 years as elderly. Elderly individuals with diabetes diagnosed in middle age (40 to 64 years) were classified as having middle-age-onset diabetes and those with diabetes diagnosed at age ≥65 years were classified as having elderly-onset diabetes [68].
- We included 289 elderly patients aged ≥80 years (81.0%) who had full anthropometric measurements and clinical information available by chart review of 357 patients aged ≥80 years and divided them into middle-age-onset diabetes (onset before 65 years of age) and elderly-onset diabetes (onset at 65+ years of age) according to the age of onset of diabetes and age group (80 to 85, 86 to 90, and 91+ years). The Institutional Review Board of Kangwon National University Hospital (IRB No. 2012-06-006) approved the protocol of this study.
- Diabetic retinopathy was evaluated on the basis of fundus photography taken on patient at ophthalmology department. When necessary, fluorescein angiography was performed to assess vascular abnormalities and the extent of the capillary non-perfusion area. The diagnosis of diabetic retinopathy was determined by the two ophthalmologists in our hospital. Diabetic nephropathy was defined as the presence of albuminuria. Coronary revascularization was defined as the presence of percutaneous coronary intervention history or coronary artery bypass surgery. We defined cerebral infarction as a history of cerebral infarction or a history of a radiological infarct.
- Laboratory analyses
- Fasting plasma glucose, HbA1c, postprandial glucose, creatinine, total cholesterol, triglyceride, high density lipoprotein cholesterol, low density lipoprotein cholesterol, blood urea nitrogen (BUN), and creatinine concentrations were measured by standard procedures. Individuals were considered normoalbuminuric if their urinary albumin creatinine ratio (uACR) was consistently less than 30 mg/g Cr. Microalbuminuria was defined as ACR 30 to 300 mg/g Cr, and macroalbuminuria as uACR ≥300 mg/g Cr in at least two of three measurements.
- Statistical analysis
- The results are reported as mean±standard deviation or percentages. Statistical analysis was performed using the SPSS version 19.0 (IBM Co., Armonk, NY, USA). Student t test was used for continuous variables and the chi-square test for discrete variables, with all P values reported for two-sided tests. Values of P<0.05 were considered to indicate significance.
METHODS
- The baseline clinical characteristics of the patients are presented in Table 1. There were 141 males (48.8%) and 148 females (51.2%) patients. The patients had a mean age of 83.2±2.9 years (range, 80 to 94) and a mean body mass index (BMI) of 23.6±3.1 kg/m2. The mean HbA1c level was 7.4%±1.6% and the mean duration of diabetes was 14.3±10.4 years.
- Concurrent hypertension was common in the diabetes patients (prevalence, 75.1%) and 22.5% of the study population had a history of coronary revascularization; 17% of the patients had a history of cerebral infarction. Over half of the patients (56.4%) had diabetic retinopathy and 57.4% had diabetic nephropathy.
- The clinical differences between middle-age-onset diabetes and elderly-onset diabetes are presented in Table 2. One hundred and ninety-nine patients ≥80 years old (68.9%) had elderly-onset diabetes. The patients with elderly-onset diabetes had a significantly shorter duration of diabetes (8.8±5.8 years vs. 26.9±6.9 years) and lower frequencies of diabetic retinopathy compared to the patients with middle-age-onset diabetes in a simple comparison. However, interestingly, there were no differences in concurrent hypertension and dyslipidemia, or history of coronary revascularization, cerebral infarction, and cancer between the two groups in a simple analysis.
- The patients with elderly-onset diabetes had significantly lower serum BUN, creatinine levels, lower postprandial glucose, and HbA1c levels, higher hemoglobin levels, lesser microalbuminuria, and lesser insulin usage compared to those with middle-age-onset diabetes (Table 3). Elderly-onset diabetes is more likely to follow with lifestyle change only and sulfonylurea/glinide usage than middle-age-onset diabetes. Elderly-onset diabetes is characterized by a lower likelihood of insulin usage and lower frequencies of microalbuminuria and retinopathy than middle-age-onset diabetes.
- We made a multiple logistic regression analysis with stepwise selection method using five biologically important independent variables such as sex, BMI, systolic blood pressure (SBP), glomerular filtration rate (GFR), and duration of diabetes and the development of diabetic retinopathy as the dependent variable and we found that duration of diabetes (odds ratio [OR], 1.149; P<0.001) is an independent variable for the development of diabetic retinopathy in Table 4. In a multiple logistic regression, GFR (OR, 0.976; P<0.001) and duration of diabetes (OR, 1.053; P<0.001) are independent risk factors for the development of diabetic nephropathy in Table 5. In a multiple logistic regression analysis with stepwise selection method using six biologically important independent variables such as age, sex, BMI, SBP, GFR, and duration of diabetes, and the development of coronary revascularization as the dependent variable, GFR is an independent risk factor for coronary revascularization (OR, 0.985; P=0.017) in the Table 6. However, when we made a multiple regression analysis, there was no independent variables for the development of cerebral infarction (data was not shown).
- To evaluate the effect of diabetes duration and glucose control on the cardiovascular and microvascular complication in elderly-onset diabetes, we made subgroup according to the duration of diabetes (<5, 5 to 15, ≥15 years). As in the Table 7, there was no frequency difference in coronary revascularization and cerebral infarction and HbA1c levels between three subgroup of diabetes duration in elderly-onset diabetes. However, there was significant difference in the age, duration of diabetes, cancer, creatinine, GFR, the frequency of diabetic retinopathy, and overt proteinuria between subgroup of diabetes duration. These results imply that the elderly-onset diabetes has similar risk of cardiovascular risk compared to the middle onset diabetes irrespective of duration of diabetes.
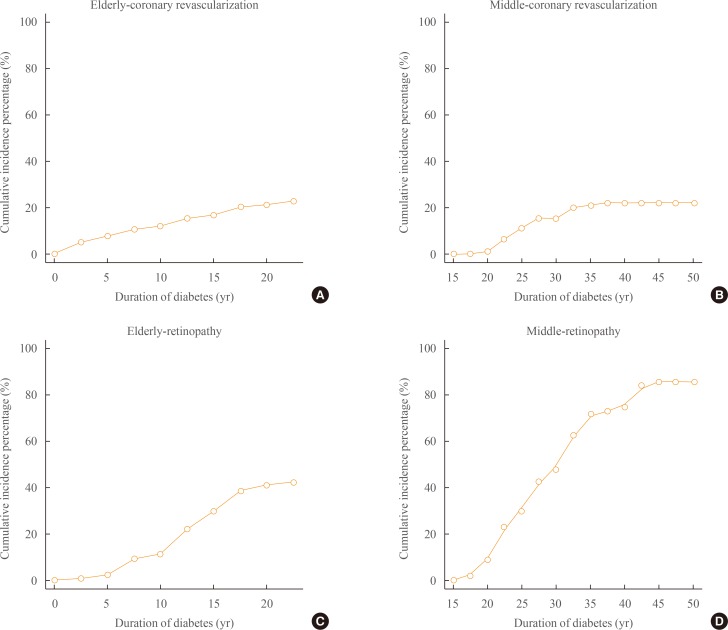
- In the Fig. 1, we demonstrated that the cumulative incidence of coronary revascularization in the elderly-onset diabetes was increasing equationally from the 1 to 20 years of duration of diabetes but the cumulative incidence of coronary revascularization in middle-age-onset diabetes was increasing rapidly over from 20 to 35 years of duration (Fig. 1A, B). Both in the elderly-onset diabetes and middle-age-onset diabetes, the cumulative incidence of retinopathy was increasing rapidly according to the duration of diabetes (Fig. 1C, D).
- We divided the patients into three groups according to age (80 to 85, 86 to 90, and 90+ years). There were no clinical differences among the age groups (analysis not shown).
RESULTS
- Improvements in therapeutic intervention and increases in lifespan have prolonged the survival of patients with middle-age-onset diabetes and have increased the prevalence of elderly-onset diabetes. Diabetes onset can occur at 70 to 80 years of age for multiple reasons, such as over-nutrition, decreased physical activity, and obesity [5]. The proportion of patients with elderly-onset diabetes increases progressively to 99.67% of all diabetes cases in people aged 100+ years [9].
- Diabetes in elderly adults is related to higher mortality, reduced functional status, and increased risk of institutionalization [10]. The heterogeneity of the health conditions of elderly patients and the lack of evidence from clinical trials are challenges in terms of identifying standard intervention strategies suitable for all elderly adults [11]. There are few studies on the clinical characteristics of elderly-onset diabetes, especially in very old people.
- The pathogenesis of elderly-onset diabetes is complex and multifactorial. Structural genetic factors interact with environmental factors such as physical inactivity, sarcopenia, frailty, and the aging process [121314]. In elderly subjects, fasting glucose shows a mean increase of 1% to 2% per decade, and an increase of 6 to 9 mg% per decade after a 2-hour oral glucose tolerance test [1516], suggesting that age is an independent determinant of glucose tolerance [17].
- The current American Diabetes Association classification divides diabetes mellitus into various types based on pathogenesis. However, the treatment of diabetes in elderly patients follows the same guidelines as for younger patients, irrespective of the age of diagnosis.
- Our study demonstrates that the clinical characteristics of diabetic patients ≥80 years differ according to the age of onset of diabetes. As expected, elderly-onset diabetes patients have fewer microvascular complications (retinopathy and nephropathy) and lower HbA1c levels compared to middle-age-onset diabetes patients in a simple comparison analysis. In a multiple regression model, duration of diabetes in elderly is risk factor for the development of diabetic retinopathy and diabetic nephropathy. However, duration of diabetes is not a risk factor for the development of coronary revascularization and cerebral infarction. Also, there was no difference in coronary revascularization and cerebral infarction between middle-age-onset and elderly-onset diabetes and between three groups of different duration in the elderly-onset diabetes, suggesting that the development of diabetes at age 65+ years is a similar risk factor for cardiovascular events as long-lasting middle-age-onset type 2 diabetes. The patients with elderly-onset diabetes had better metabolic conditions (lower HbA1c levels) and less pharmacological treatment (less frequent insulin use, more frequent lifestyle changes). The duration of diabetes, HbA1c, and systolic blood pressure are known to be independent risk factors for diabetic micro-complication; however, in this study, we failed to show that glycemic control or systolic blood pressure was associated with diabetic complications in multiple logistic regression. We didn't know the reason but we may need larger numbers of patients to make a concrete conclusion between glycemic control and diabetic microvascular complication.
- Our study showed the even in the elderly-onset diabetes, the cumulative incidence of retinopathy is dependent of the duration of diabetes same as the middle-age-onset diabetes. The elderly-onset diabetes especially without any complications still needs strict glucose control because of their long life expectancy and their high risk of retinopathy according to the duration of diabetes same as in middle-age-onset diabetes. The elderly-onset diabetes requires the full assessment of cardiovascular risk irrespective of duration of diabetes because of the similar risk of coronary revascularization in short duration of diabetes in elderly-onset diabetes compared with middle-age-onset diabetes.
- Our study confirms that elderly people with elderly-onset diabetes have a high burden of diabetic retinopathy according to the duration of diabetes as in the middle onset diabetes. Therefore, we suggested that a proportion of elderly patients with elderly-onset diabetes without any diabetic complications or comorbidities may need reasonably tightened glycemic control because they have much longer lifespan thereby more chances to have develop diabetic complication during their late lifetime. Because elderly-onset diabetes has similar risk of macrovascular disease as in middle-onset diabetes or irrespective of their duration of diabetes, the clinician may pay more attention to assess the risk of cardiovascular disease in the elderly-onset diabetic patient.
- Elderly adults with diabetes may have depression, cognitive dysfunction, sarcopenia, fractures, and more frequent hypoglycemic events [18]. Therefore, the goals of diabetes management in older adults should be tailored to the individual patient and the age of diabetes onset can be used to determine appropriate management in elderly diabetes patients.
- One of limitation of this study was its retrospective cross-sectional design at a single university hospital. Another limitation was the missing clinical data for retinopathy and uACR and some self-reported data. Future prospective epidemiologic studies should examine the natural history of elderly-onset diabetes and consider stratification of management based on age of diabetes onset, current age, and comorbidities.
DISCUSSION
-
Acknowledgements
- This study was supported by a research grant from Kangwon National University School of Medicine (2012).
ACKNOWLEDGMENTS
-
CONFLICTS OF INTEREST: No potential conflict of interest relevant to this article was reported.
Article information
- 1. Sloan FA, Bethel MA, Ruiz D Jr, Shea AM, Feinglos MN. The growing burden of diabetes mellitus in the US elderly population. Arch Intern Med 2008;168:192–199. ArticlePubMed
- 2. Wilson PW, Anderson KM, Kannel WB. Epidemiology of diabetes mellitus in the elderly. The Framingham Study. Am J Med 1986;80:3–9. Article
- 3. Jeon JY, Ko SH, Kwon HS, Kim NH, Kim JH, Kim CS, et al. Prevalence of diabetes and prediabetes according to fasting plasma glucose and HbA1c. Diabetes Metab J 2013;37:349–357. ArticlePubMedPMC
- 4. Wild S, Roglic G, Green A, Sicree R, King H. Global prevalence of diabetes: estimates for the year 2000 and projections for 2030. Diabetes Care 2004;27:1047–1053. ArticlePubMed
- 5. Vacante M, Malaguarnera M, Motta M. Revision of the ADA-classification of diabetes mellitus type 2 (DMT2): the importance of maturity onset diabetes (MOD), and senile diabetes (DS). Arch Gerontol Geriatr 2011;53:113–119. ArticlePubMed
- 6. Selvin E, Coresh J, Brancati FL. The burden and treatment of diabetes in elderly individuals in the U.S. Diabetes Care 2006;29:2415–2419. ArticlePubMed
- 7. Wang Y, Qin MZ, Liu Q, Liu Q, Chang ZW. Clinical analysis of elderly patients with elderly-onset type 2 diabetes mellitus in China: assessment of appropriate therapy. J Int Med Res 2010;38:1134–1141. ArticlePubMed
- 8. Malaguarnera M, Vacante M, Frazzetto PM, Motta M. The role of diabetes and aging in the determinism of hypertension and the related cerebrovascular complications. Arch Gerontol Geriatr 2012;55:221–225. ArticlePubMed
- 9. Motta M, Bennati E, Capri M, Ferlito L, Malaguarnera M. Diabetes mellitus in the extreme longevity. Exp Gerontol 2008;43:102–105. ArticlePubMed
- 10. Brown AF, Mangione CM, Saliba D, Sarkisian CA. California Healthcare Foundation/American Geriatrics Society Panel on Improving Care for Elders with Diabetes. Guidelines for improving the care of the older person with diabetes mellitus. J Am Geriatr Soc 2003;51(5 Suppl Guidelines):S265–S280. PubMed
- 11. Kirkman MS, Briscoe VJ, Clark N, Florez H, Haas LB, Halter JB, et al. Diabetes in older adults: a consensus report. J Am Geriatr Soc 2012;60:2342–2356. ArticlePubMedPMC
- 12. Meneilly GS, Tessier D. Diabetes in elderly adults. J Gerontol A Biol Sci Med Sci 2001;56:M5–M13. ArticlePubMedPDF
- 13. Motta M, Bennati E, Cardillo E, Ferlito L, Malaguarnera M. Pathogenesis of senile diabetes. Indian J Med Res 2008;128:225–227. PubMed
- 14. Morley JE, Mooradian AD, Rosenthal MJ, Kaiser FE. Diabetes mellitus in elderly patients. Is it different? Am J Med 1987;83:533–544. ArticlePubMed
- 15. Andres R, Tobin JD. Aging and the disposition of glucose. Adv Exp Med Biol 1975;61:239–249. ArticlePubMed
- 16. Andres R. Aging, diabetes, and obesity: standards of normality. Mt Sinai J Med 1981;48:489–495. PubMed
- 17. Shimokata H, Muller DC, Fleg JL, Sorkin J, Ziemba AW, Andres R. Age as independent determinant of glucose tolerance. Diabetes 1991;40:44–51. Article
- 18. Kim KS, Kim SK, Sung KM, Cho YW, Park SW. Management of type 2 diabetes mellitus in older adults. Diabetes Metab J 2012;36:336–344. ArticlePubMedPMC
References
The cumulative incidence of diabetic complication in middle-age-onset and elderly-onset diabetes. (A) Cumulative incidence (%) of coronary revascularization in elderly-onset diabetes. (B) Cumulative incidence (%) of coronary revascularization in middle-age-onset diabetes. (C) Cumulative incidence (%) of retinopathy in elderly-onset diabetes. (D) Cumulative incidence (%) of retinopathy in middle-age-onset diabetes.

Clinical Characteristics of the Study Subjects
Demographic and General Clinical Characteristics of Elderly-Onset and Middle-Age-Onset Type 2 Diabetes Patients
Clinical Characteristics and Medication Histories of Elderly-Onset and Middle-Age-Onset Type 2 Diabetes Patients
Values are expressed as mean±SD or number (%).
GFR, glomerular filtration rate; HDL-C, high density lipoprotein cholesterol; LDL-C, low density lipoprotein cholesterol; uACR, urinary albumin creatinine ratio; DPP4, dipeptidyl peptidase-4; OHA, hypoglycemic agent; ARB, angiotensin receptor blocker; ACE, angiotensin converting enzyme.
Multiple Logistic Regression Analysis with Stepwise Selection Method Using Five Biologically Important Variables as Independent Variables, and the Development of Diabetic Retinopathy as the Dependent Variable
| Independent variable | Partial regression coefficient | Standard error | Odds ratio (β) | 95% CI | P value |
|---|---|---|---|---|---|
| Duration of diabetes, yr | 0.139 | 0.024 | 1.149 | 1.096–1.204 | <0.001 |
Multiple Logistic Regression Analysis with Stepwise Selection Method Using Six Biologically Important Variables as Independent Variables, and the Development of Diabetic Nephropathy as the Dependent Variable
Multiple Logistic Regression Analysis with Stepwise Selection Method Using Six Biologically Important Variables as Independent Variables, and the Development of Coronary Revascularization as the Dependent Variable
| Independent variable | Partial regression coefficient | Standard error | Odds ratio (β) | 95% CI | P value |
|---|---|---|---|---|---|
| GFR | –0.015 | 0.006 | 0.985 | 0.973–0.997 | 0.017 |
Clinical Characteristics of Elderly-Onset Diabetes according to the Duration of Diabetes
Figure & Data
References
Citations
- Rescue of High Glucose Impairment of Cultured Human Osteoblasts Using Cinacalcet and Parathyroid Hormone
V. A. Shahen, A. Schindeler, M. S. Rybchyn, C. M. Girgis, B. Mulholland, R. S. Mason, I. Levinger, T. C. Brennan-Speranza
Calcified Tissue International.2023; 112(4): 452. CrossRef - Factors Related to the Occurrence and Number of Chronic Diabetic Complications in Patients with Type 2 Diabetes Mellitus: Utilizing The National Health Insurance Service-National Health Screening Cohort in Korea, 2002~2015
Haejung Lee, Misoon Lee, Gaeun Park, Ah Reum Khang
Journal of Korean Gerontological Nursing.2022; 24(1): 22. CrossRef - Prevalence of and Risk Factors for Diabetic Retinopathy and Diabetic Macular Edema in Patients with Early- and Late-Onset Diabetes Mellitus
Yu Wang, Zhong Lin, Gang Zhai, Xiao Xia Ding, Liang Wen, Dong Li, Bo Zou, Ke Mi Feng, Yuan Bo Liang, Cong Xie
Ophthalmic Research.2022; 65(3): 293. CrossRef - Associations of Age at Diagnosis and Duration of Diabetes With Morbidity and Mortality Among Older Adults
Christine T. Cigolle, Caroline S. Blaum, Chen Lyu, Jinkyung Ha, Mohammed Kabeto, Judy Zhong
JAMA Network Open.2022; 5(9): e2232766. CrossRef - Chart review of diagnostic methods, baseline characteristics and symptoms for European patients with pancreatic cancer
Alfredo Carrato, Davide Melisi, Gerald Prager, Christoph B Westphalen, Anabel Ferreras, Nathalie D’Esquermes, Julien Taieb, Teresa M Mercadé
Future Oncology.2021; 17(15): 1843. CrossRef - Distinction of cardiometabolic profiles among people ≥75 years with type 2 diabetes: a latent profile analysis
Antoine CHRISTIAENS, Michel P. HERMANS, Benoit BOLAND, Séverine HENRARD
BMC Endocrine Disorders.2019;[Epub] CrossRef - Validity of diagnostic codes and estimation of prevalence of diabetic foot ulcers using a large electronic medical record database
Avivit Cahn, Talya Altaras, Tal Agami, Ori Liran, Colette E. Touaty, Michel Drahy, Rena Pollack, Itamar Raz, Gabriel Chodick, Inbar Zucker
Diabetes/Metabolism Research and Reviews.2019;[Epub] CrossRef - Response: Comparison of Age of Onset and Frequency of Diabetic Complications in the Very Elderly Patients with Type 2 Diabetes (Endocrinol Metab2016;31:416-23, Bong-Ki Lee et al.)
Eun-Hee Cho
Endocrinology and Metabolism.2017; 32(1): 142. CrossRef - Letter: Comparison of Age of Onset and Frequency of Diabetic Complications in the Very Elderly Patients with Type 2 Diabetes (Endocrinol Metab2016;31:416-23, Bong-Ki Lee et al.)
Mee Kyoung Kim
Endocrinology and Metabolism.2017; 32(1): 140. CrossRef
 PubReader
 Cite
Cite