
Articles
- Page Path
- HOME > Endocrinol Metab > Volume 32(1); 2017 > Article
-
Original ArticleThe Effects of Altered Membrane Cholesterol Levels on Sodium Pump Activity in Subclinical Hypothyroidism
-
Suparna Roy
 , Anindya Dasgupta
 -
Endocrinology and Metabolism 2017;32(1):129-139.
DOI: https://doi.org/10.3803/EnM.2017.32.1.129
Published online: February 28, 2017
Department of Biochemistry, Calcutta National Medical College, Kolkata, India.
- Corresponding author: Anindya Dasgupta. Department of Biochemistry, Calcutta National Medical College, 32 Gorachand Road, Kolkata 700014, India. Tel: +91-9475506658, Fax: +91-3322843582, anindya653@gmail.com
Copyright © 2017 Korean Endocrine Society
This is an Open Access article distributed under the terms of the Creative Commons Attribution Non-Commercial License (http://creativecommons.org/licenses/by-nc/4.0/) which permits unrestricted non-commercial use, distribution, and reproduction in any medium, provided the original work is properly cited.
ABSTRACT
-
Background
- Metabolic dysfunctions characteristic of overt hypothyroidism (OH) start at the early stage of subclinical hypothyroidism (SCH). Na+/K+-ATPase (the sodium pump) is a transmembrane enzyme that plays a vital role in cellular activities in combination with membrane lipids. We evaluated the effects of early changes in thyroid hormone and membrane cholesterol on sodium pump activity in SCH and OH patients.
-
Methods
- In 32 SCH patients, 35 OH patients, and 34 euthyroid patients, sodium pump activity and cholesterol levels in red blood cell membranes were measured. Serum thyroxine (T4) and thyroid stimulating hormone (TSH) levels were measured using enzyme-linked immunosorbent assays. Differences in their mean values were analysed using post hoc analysis of variance. We assessed the dependence of the sodium pump on other metabolites by multiple regression analysis.
-
Results
- Sodium pump activity and membrane cholesterol were lower in both hypothyroid groups than in control group, OH group exhibiting lower values than SCH group. In SCH group, sodium pump activity showed a significant direct dependence on membrane cholesterol with an inverse relationship with serum TSH levels. In OH group, sodium pump activity depended directly on membrane cholesterol and serum T4 levels. No dependence on serum cholesterol was observed in either case.
-
Conclusion
- Despite the presence of elevated serum cholesterol in hypothyroidism, membrane cholesterol contributed significantly to maintain sodium pump activity in the cells. A critical reduction in membrane cholesterol levels heralds compromised enzyme activity, even in the early stage of hypothyroidism, and this can be predicted by elevated TSH levels alone, without any evident clinical manifestations.
- Subclinical hypothyroidism (SCH) is defined as a condition where no overt decrease in thyroxine (T4) or triiodothyronine (T3) levels is evident, despite an increase in thyroid stimulating hormone (TSH) levels in the blood [1]. This disorder is becoming more prominent due to the development of more sensitive assays capable of detecting lower levels of thyroid hormones, as well as increased awareness of the potential harmful effects of SCH. Using recently developed techniques, the prevalence of SCH was found to be as high as 9.4%, with greater prevalence (11.4%) in females [2]. This finding is important because it has been observed that despite having normal blood levels of T4, patients suffering from SCH exhibit a greater prevalence of cardiovascular diseases, myocardial ischaemia, and dyslipidaemia [345]. Moreover, recent studies have suggested that proinflammatory conditions play a major role in mediating generalized tissue ischaemia in SCH patients [6]. SCH is also associated with impairments in bioenergetic functions that can be reversed by T4 therapy [7].
- The major effects of the thyroid hormones on adenosine triphosphate (ATP) synthesis have been known for a long time; namely, they promote mitochondrial respiration, ATP synthesis, and the utilization of ATP in the cytosol [8]. However, recent evidence of reduced exercise tolerance in SCH patients indicates the presence of compromised energy production on demand at much earlier stages of the hypothyroid disease spectrum [9]. Na+/K+-ATPase (the sodium pump) is an ATP-dependent transmembrane enzyme protein composed of two major classes of subunits (α and β), which help in the overall regulation of its activity under different metabolic conditions. Not only does this enzyme play a key role in maintaining the normal membrane potential by moving three equivalents of Na+ outside the cell and two equivalents of K+ inside the cell, but the interaction of this pump with surrounding membrane proteins and lipids allow this membrane protein to function as an important modulator of signal transduction cascades [101112]. This dual role of the sodium pump is supported by evidence that its blockade by its natural inhibitor ouabain tends to restrict the lipid kinase-mediated signal transduction pathway [13].
- Several factors play important roles in the regulation of the sodium pump in the human body. The postnatal increase in sodium pump activity occurs due to coordinated increases in the pool size of the α1 and β1 subunits, which is dependent on normal thyroid status in most tissues, such as the brain [14]. The thyroid hormones have been found to play a crucial role in preserving normal sodium pump activity in most tissues. In fact, T4-induced increases in the expression of this membrane transporter in several thyroid-receptive tissues have been proposed to be a major cause of the calorigenic function of T4 [15]. The abundance of both the α and β subunits of the sodium pump has been found to be increased approximately 4- to 5-fold in myocardial tissue in experimental animals after treatment with T3 [16]. In experimental animals, hypothyroidism has been found to reduce sodium pump activity in the frontal and hippocampal areas, with significant modulation of acetylcholinesterase activity in specific brain regions [17]. These observations suggest that an optimum thyroid hormone status is required to maintain normal sodium pump activity in certain brain cells that in turn regulate acetylcholinesterase activity and the monoamine neurotransmitter systems of specific brain areas.
- The importance of sodium pump activity in neuronal development is underscored by the fact that maternal exposure to the anti-thyroid drug propylthiouracil through drinking water in the vital stages of neurological development was found to result in restricted activity of hypothalamic, pontine, and cerebellar sodium pump activity in experimental rats [18]. As optimum sodium pump activity is an important contributor to adequate neuronal excitability and energy production through well-integrated metabolic pathways, it plays a crucial role in the regulation of the overall process of neurotransmission. Hence, sodium pump impairment may be a plausible explanation for the neurotoxicity due to improper intrauterine development that has been observed in hypothyroid patients. However, some earlier reports have suggested contrasting results, reporting that increased levels of sodium pump activity were associated with decreased thyroid function, both in overt as well as in subclinical cases [1920]. These inconsistent results suggest that no uniform alterations occur in the function of the sodium pump in thyroid disorders. Hence, our goal was to explore the effect of both thyroid hormone and its trophic regulator in the initial subclinical phase of this common endocrine disorder on sodium pump activity and on membrane cholesterol, a closely associated membrane component.
- Hypercholesterolaemia and dyslipidaemia have been reported to become associated much earlier in hypothyroid patients than in the general population. Almost 90% of hypothyroid patients have been reported to have hypercholesterolaemia, with a significant rise in the low density lipoprotein (LDL) fraction [21]. However, in SCH, changes in patients' lipid profiles have been documented to vary, with some studies describing a rise in both the levels of total cholesterol and the LDL fraction, while others have reported only an increase in total cholesterol without any rise in the LDL fraction [22]. Changes in cholesterol metabolism in hypothyroidism are clearly reflected in the intracellular milieu and in the cell membrane, with a 60% increase in the plasma cholesterol level co-occurring with a 22% reduction in erythrocyte membrane cholesterol content [23]. Furthermore, the effect of the thyroid hormones on the membrane cholesterol is underscored by the finding that the proportion of cholesterol was lower in comparison to phospholipids in the cell membranes of hypothyroid patients than in normal control subjects [24]. Membrane cholesterol has been found to play a crucial role in the regulation of sodium pump activity in its own right. High concentrations of sodium pumps have been reported in the membrane caveolae, which are rich in cholesterol (containing up to 25% to 30% of total cell cholesterol), reflecting the importance of a cholesterol-rich environment for their optimum function. These observations prompted us to explore whether changes in membrane cholesterol levels in both SCH patients and patients with overt hypothyroidism (OH) contribute to changes in sodium pump activity. We hypothesized that alterations in sodium pump activity may start in the initial stages of hypothyroidism, before the appearance of clinical symptoms, depending on changes in membrane cholesterol levels. The present study was conducted to evaluate this hypothesis.
INTRODUCTION
- Study design and setting
- The present study was undertaken in the Department of Biochemistry of a tertiary care medical college and hospital in West Bengal, India. It was a hospital-based, non-interventional, and cross-sectional observational study that spanned a period of 1 year, from February 2015 to January 2016.
- Selection of cases and controls
- Sixty-seven cases between 20 to 40 years of age were selected by convenience sampling from the thyroid clinic of the Biochemistry Department during the stipulated study period. No gender criteria were applied during the selection process. The inclusion and exclusion criteria were as follows.
- Inclusion criteria
- After clinical examination, all hypothyroid cases were selected based on their serum levels of TSH and total T4. Thereafter, we subdivided the case group into OH and SCH patients based on serum T4 levels, as follows: (1) SCH group: elevated TSH (>6.16 µIU/mL), but total T4 within the reference range (5 to 13 µg/dL); (2) OH group: elevated TSH (>6.16 µIU/mL) and total T4 below the lower limit of the reference range (<5 µg/dL); and (3) control group: 34 healthy age-matched and sex-matched subjects were selected as the control group from the same population, belonging to similar socioeconomic strata and having similar nutritional status.
- Exclusion criteria
- Patients with a history of chronic alcohol consumption, smoking, drug addiction, any malignant disorder, chronic inflammatory disease, and any other metabolic or endocrine disorders were excluded. Cases and control subjects on any steroid drug or with disorders that may alter serum protein levels and cause false changes in total T4 values were also excluded from the study.
- Ethical guidelines
- Informed consent was obtained from the case groups and the control group according to the study protocol. Institutional ethical clearance (reference number CNMC/05, dated February 12, 2015) was obtained before the start of the study. The overall study process adhered to the ethical guidelines formulated for biomedical research on human subjects by the Indian Council of Medical Research (2006) and the Helsinki Declaration (1975, revised in 2000).
- Measurement of study parameters
- Sodium pump activity was estimated in red blood cell (RBC) membranes, because RBC membrane sodium pump activity is closely correlated with neuronal sodium pump activity. Sodium pump activity was measured using the following steps, as described by Noori et al. [25].
- (1) Preparation of RBC hemolysate: the packed RBCs were sequestered by centrifuging at 4℃ at 1,500 rpm for 15 minutes and mixed in mL of 0.011 mol/L Tris-HCl buffer, 25 times volume of the packed RBC, at a pH of 7.4. The haemolysed cells were centrifuged for 30 minutes at 12,000 rpm at 4℃. The membrane pellet obtained was dissolved in 30 mL of 0.011 mol/L Tris-HCl buffer. Centrifugation under the same conditions was repeated three times to purify the membrane pellet. To ensure the optimum measurement of enzyme activity, the final concentration of total protein in the membrane suspension was adjusted to approximately 4 mg/mL of Tris buffer. The final suspension was preserved at −20℃ until the assay of enzyme activity was performed.
- (2) Measurement of sodium pump activity: sodium pump activity was estimated by a multienzyme assay technique, utilizing a sequence of reactions carried out in an ATP-consuming system. In this system, the hydrolysis of ATP correlated linearly with the oxidation of nicotinamide adenine dinucleotide (NADH) to NAD+ and a change in its absorbance at 340 nm. One unit of ATPase represented 1 µmol of NADH oxidation per minute. The reaction mixture was placed in an ultraviolet spectrophotometer, and the reaction baseline was established for 1 to 2 minutes at 340 nm. At the end of this time, 50 µL of the suitably diluted sample was added and the reaction was initiated by adding 100 µL of ATP solution. Once a good linear rate was established, 100 µL of ouabain was added, and the rate was measured after addition of the inhibitor. The sodium pump activity was taken to be the difference between the initial rate and the rate after ouabain addition, and expressed as ΔA/min.
- The value of ΔA/min corresponding to sodium pump activity was calculated using the following formula: ΔA/min for sodium pump activity=ΔA/min before the addition of ouabain−ΔA/min after the addition of ouabain.
- The final value was expressed in terms of units (1 µmol/min =1 unit).
- RBC membrane proteins were measured using the Lowry method with the Folin-Ciocalteu reagent, and the membrane sodium pump activity was ultimately expressed as IU/mg of tissue protein.
- Serum cholesterol was measured using the standard cholesterol oxidase-peroxidase antiperoxidase (CHOD-PAP) method using standard spectrophotometric techniques.
- Cholesterol in the dry lipid extracts of the RBC membranes was measured using a commercially obtained CHOD-PAP reagent (ERBA diagnostic, Mannheim, Germany). The procedure was performed as follows, according to the procedure described by Macchia et al. [26].
- Dry residues of the RBC membrane were obtained after washing erythrocytes three times with physiological saline, and the packed cells were haemolysed by mixing with distilled water in a 1:2 ratio. Then, 0.5 mL of the hemolysate was transferred to a stoppered glass tube and 5 mL of isopropanol was added dropwise with vigorous mixing on a vortex. After 1 hour of incubation at room temperature, 3.2 mL of chloroform was added dropwise in similar way. The reaction mixture was stored in stoppered glass tubes in a dark environment at room temperature overnight. Thereafter, the contents were centrifuged at 3,000 rpm for 10 minutes in 15-mL centrifuge tubes, and 600 µL of the supernatant was slowly evaporated at 60℃. Each sample was evaporated in triplicate to remove bias due to variations across samples. The dry residues were obtained were completely dissolved in 2 mL of CHOD-PAP reagent and 0.5% non-ionic detergent (Triton-X). After incubating for 30 minutes at room temperature, the reaction mixture in the tubes was vortexed vigorously until all the dry residues were converted into homogenous solutions. Absorbance of the reaction mixture was measured at 500 nm in a spectrophotometer. Values of individual samples were calculated by comparing their absorbance with that of a cholesterol calibrator (5.17 mmol/L) treated in the same way. The final concentration was expressed as mmol/mg of total protein.
- Serum TSH and total T4 were estimated by non-competitive and competitive enzyme-linked immunosorbence assay methods, respectively, with avidin-coated microwells and biotinylated enzyme conjugate reagents (Accubind, Monobind, Lake Forest, CA, USA).
- The coefficient of variation (CV) was measured throughout the study period for all tests, and was found to be 6% for TSH and 8% for total T4. For the assay procedures of sodium pump activity and membrane cholesterol, the CV was 8% and 7.5%, respectively.
- The data obtained were primarily analysed for the pattern of distribution using the Kolmogorov-Smirnov test as a statistical measure, and graphically by histograms and box plot graphs. Individual mean values were compared through post hoc analysis of variance (ANOVA). The dependence of sodium pump activity on other parameters was assessed using multiple linear regression analysis. P values <0.05 for 95% confidence intervals were considered to indicate statistical significance. All data were analysed in SPSS version 17.0 (SPSS Inc., Chicago, IL, USA).
METHODS
Measurement of sodium pump activity
Serum cholesterol
Measurement of membrane cholesterol
Measurement of serum TSH and total T4
Quality control for test procedures
Data analysis
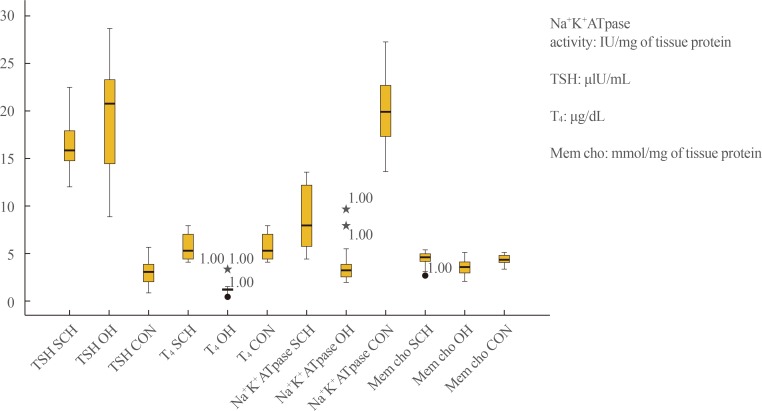
- In the results of the Kolmogorov-Smirnov test (P>0.05) (Table 1), a box plot (Fig. 1), and histograms (not shown), the data obtained for all groups appeared to follow an almost normal distribution that justified the use of post hoc ANOVA and multiple linear regression analysis.
- Post hoc ANOVA, presented in Table 2, showed that serum TSH, T4, sodium pump activity, and membrane cholesterol levels differed significantly among the control, SCH, and OH groups. Serum TSH values in the OH group were significantly higher than in the SCH patients, who in turn showed higher values than the control subjects. Total T4 levels in the OH patients were significantly lower than in both the SCH and control subjects, with a mean value (1.03 µg/dL) below the lower limit of the reference range (4 to 12 µg/dL). Although the mean T4 levels in the SCH (5.68 µg/dL) and control groups (8.29 µg/dL) were within the reference range, they exhibited a statistically significant difference (P<0.001). However, the serum and membrane cholesterol levels showed opposite trends in the SCH and OH groups, as they were significantly lower and higher, respectively, in the SCH group than in the OH group. In contrast, sodium pump activity was distinctly lower in the OH group than in the SCH group.
- Table 3 shows the results of Pearson bivariate correlation analysis for the strength of the associations between sodium pump activity and the study parameters in the SCH and OH groups. Sodium pump activity was only found to be significantly associated with the membrane cholesterol level (P=0.001). The associations with other lipid parameters, such as total serum cholesterol, LDL cholesterol, and high density lipoprotein cholesterol were statistically insignificant (P>0.05).
- However, since bivariate correlations depict the relationship between two variables independently, we performed multivariate linear regression analysis to ascertain the predictive values of serum and membrane cholesterol levels and thyroid parameters on sodium pump activity in SCH and OH patients considering all important variables jointly. The results, shown in Table 4, indicate that sodium pump activity in SCH patients was only significantly dependent on the membrane cholesterol and serum TSH levels (β=0.443 and β=−0.41; P=0.005 and P=0.009, respectively) without any significant dependence on serum cholesterol or T4 levels (Table 4).
- When similar statistical analyses were carried out for the OH patients; however, the results were different regarding the predictive values of serum TSH and T4 levels in the multiple linear regression analysis (Table 5). Sodium pump activity was found to be dependent on membrane cholesterol values and serum T4 levels (β=0.170 and β=0.869; P=0.035 and P<0.001, respectively), with no significant dependence on serum cholesterol or TSH levels.
RESULTS
- RBC membrane sodium pump activity has been found to be correlated with sodium pump activity in the cell membranes of different types of tissues, including neuronal, myocardial, and renal tissue, as well as several other tissue types [272829]. Hence, we selected RBC membrane sodium pump activity as a way of assessing the alteration of sodium pump activity in different tissues in hypothyroidism. Thyroid hormone has long been known to be a strong augmenter of sodium pump enzyme activity in thyroid-receptive tissues [30]. In our present study, the presence of significantly reduced sodium pump activity in both groups of hypothyroid patients (post hoc ANOVA) (Table 2) substantiates this finding. However, importantly, we additionally found significantly decreased sodium pump activity in the SCH group in comparison to the control subjects. This finding indicates that early malfunctioning of this multimeric membrane protein occurs in the earliest part of the spectrum of hypothyroid disorder (SCH). The crucial stimulatory role of the thyroid hormones on the function and integrity of sodium pump activity has already been discussed [141516]. In many cases, SCH has been found to progress to OH over time [31], indicating that SCH is an early stage of transient thyroid deficiency in thyroid-responsive tissues characterized by an early compensatory rise in TSH, which gradually progresses to a long-term decompensated overt hypothyroid stage with reduced T4 levels despite an increase in TSH. This explains the observation of compromised sodium pump activity in both the SCH and OH groups, with a significantly greater reduction in the OH group. It has been reported that T4 treatment at a specific dosage stimulates sodium pump activity in biomembranes [32]. In agreement with this observation, the reduced sodium pump activity in our SCH patients can be explained by the presence of transient intracellular T4 deficiencies at this initial phase of hypothyroid disorder; these deficiencies culminate into a gross reduction of this enzyme activity as the spectrum progresses into OH, with a much more generalized reduction in T4 levels. This idea is further substantiated by our finding in multiple linear regression analysis that sodium pump activity in the OH group showed a significant positive dependence on serum levels of T4 (β=0.869, P<0.001) (Table 4) but did not show any such dependence in the SCH group (P=0.235) (Table 3). Instead, in the SCH group, sodium pump activity was found to be significantly negatively dependent on serum TSH values (β=−0.410, P=0.009) (Table 3), which rise proportionally with the transient intracellular T4 deficiency to maintain a serum T4 value within the reference range.
- The evolutionary correlation between the sodium pump and 3β-hydroxysterol Δ(24)-reductase, the major rate-limiting enzyme of the cholesterol biosynthetic pathway, has strengthened to the point that membrane cholesterol content significantly contributes to maintain sodium pump activity [33]. Furthermore, in the present study, sodium pump activity was found to be closely linked to membrane cholesterol content rather than with serum cholesterol levels in both SCH and OH patients. The inability of serum cholesterol levels to provide consistent predictive information regarding sodium pump activity is further underscored by the results of the multiple linear regression analysis, in which serum cholesterol levels did not show any significant predictive power for sodium pump activity in either the SCH group (β=−0.08, P=0.575) or the OH group (β=0.095, P=0.242). This indicates that despite some degree of free exchange of cholesterol with the plasma, the total cholesterol content of the RBC membrane is mostly determined by an equilibrium between cholesterol efflux and influx across the membrane and intracellular cholesterol transport, all of which occur via several enzymatic and biochemical pathways within the cells, independently of the circulating plasma cholesterol [343536]. Similarly, some recent studies have also corroborated this view of membrane cholesterol content and plasma cholesterol being independently regulated [37].
- Cholesterol is a membrane lipid that exerts a significant influence on the structural integrity of the sodium pump. The binding of lipids such as phosphatidylserine and cholesterol stabilizes particular sites of the sodium pump. Purified detergent-soluble recombinant αβ or αβ/FXYD sodium pump complexes have been found show specific functional effects in response to the binding of phospholipids and cholesterol at different sites of the enzyme, with distinctive structural selectivity. These findings have underscored the crucial role of phospholipids and cholesterol, and the interactions thereof, in maintaining the stability and molecular activity of the sodium pump [37]. These considerations explain the possible implications of changes in membrane lipid composition for the physiological regulation of this integral membrane transporter.
- This finding was observed in both the SCH and OH groups, albeit more significantly in the OH group. Decreased expression of LDL receptors on hepatic cells, along with reduced activity of the 7 α-hydroxylase enzyme, are some notable explanations of high levels of serum cholesterol in both SCH and OH patients [3839]. Furthermore, hypercholesterolaemia in SCH patients has been explained by the fact that elevated TSH levels have been found to stimulate the β-hydroxy-β-methylglutaryl-CoA (HMG-CoA) reductase enzyme in liver tissue [40]. Recent studies have suggested that elevated TSH levels increase the efflux of cellular cholesterol into the plasma by increasing the expression of ATP-binding cassette subfamily A members [41]. These findings, in part, explain the coexistence of increased plasma cholesterol levels with reduced levels of intracellular and intramembrane cholesterol in SCH patients.
- However, the major limitation of the present study is that we only obtained data from RBC membranes in vivo. We plan to undertake further investigations in different cell culture lines in vitro to obtain more detailed and conclusive evidence of altered sodium pump activity in hypothyroidism.
- In conclusion, given the effects of both the thyroid hormones and membrane cholesterol on sodium pump activity, it is evident that the pathophysiological changes of hypothyroidism manifest through alterations in intracellular communication and neural transmission beginning in the very early stages of SCH, which may herald several cardinal metabolic and neurological complications involved in the entire spectrum of hypothyroidism. We suggest that membrane cholesterol is a more crucial indicator than serum cholesterol of vital cellular metabolic reactions such as sodium pump activity. In light of our observations and the findings that have been presented in the literature, we propose that HMG-CoA reductase inhibitors may significantly reduce the cholesterol concentration in biomembranes at the same time as they significantly reduce cellular cholesterol. As an optimum concentration of membrane cholesterol is needed to maintain sodium pump activity, we propose that it is necessary to monitor membrane cholesterol levels during HMG-CoA reductase inhibitor therapy to ensure that it is maintained at an optimum level for regulating vital cellular functions such as membrane transport via the sodium pump.
DISCUSSION
-
CONFLICTS OF INTEREST: No potential conflict of interest relevant to this article was reported.
Article information
- 1. Efstathiadou Z, Bitsis S, Milionis HJ, Kukuvitis A, Bairaktari ET, Elisaf MS, et al. Lipid profile in subclinical hypothyroidism: is L-thyroxine substitution beneficial? Eur J Endocrinol 2001;145:705–710. ArticlePubMed
- 2. Sharma R, Sharma TK, Kaushik GG, Sharma S, Vardey SK, Sinha M. Subclinical hypothyroidism and its association with cardiovascular risk factors. Clin Lab 2011;57:719–724. PubMed
- 3. Biondi B. Mechanisms in endocrinology: heart failure and thyroid dysfunction. Eur J Endocrinol 2012;167:609–618. ArticlePubMed
- 4. Wollenweber FA, Zietemann V, Gschwendtner A, Opherk C, Dichgans M. Subclinical hyperthyroidism is a risk factor for poor functional outcome after ischemic stroke. Stroke 2013;44:1446–1448. ArticlePubMed
- 5. Roy S, Banerjee U, Dasgupta A. A comparative study to evaluate the interplay of lipoprotein (a) with traditional lipid parameters in overt and subclinical hypothyroidism. Br J Med Med Res 2015;10:1–11.ArticlePDF
- 6. Roy S, Banerjee U, Dasgupta A. Effect of sub clinical hypothyroidism on C-reactive protein and ischemia modified albumin. Mymensingh Med J 2015;24:379–384. PubMed
- 7. Madathil A, Hollingsworth KG, Blamire AM, Razvi S, Newton JL, Taylor R, et al. Levothyroxine improves abnormal cardiac bioenergetics in subclinical hypothyroidism: a cardiac magnetic resonance spectroscopic study. J Clin Endocrinol Metab 2015;100:E607–E610. ArticlePubMed
- 8. Muller MJ, Seitz HJ. Thyroid hormone action on intermediary metabolism. Part I: respiration, thermogenesis and carbohydrate metabolism. Klin Wochenschr 1984;62:11–18.ArticlePDF
- 9. Werneck FZ, Coelho EF, de Lima JR, Laterza MC, Barral MM, Teixeira Pde F, et al. Pulmonary oxygen uptake kinetics during exercise in subclinical hypothyroidism. Thyroid 2014;24:931–938. ArticlePubMedPMC
- 10. Liang M, Tian J, Liu L, Pierre S, Liu J, Shapiro J, et al. Identification of a pool of non-pumping Na/K-ATPase. J Biol Chem 2007;282:10585–10593. ArticlePubMed
- 11. Liu L, Mohammadi K, Aynafshar B, Wang H, Li D, Liu J, et al. Role of caveolae in signal-transducing function of cardiac Na+/K+-ATPase. Am J Physiol Cell Physiol 2003;284:C1550–C1560. ArticlePubMed
- 12. Liu L, Askari A. Beta-subunit of cardiac Na+-K+-ATPase dictates the concentration of the functional enzyme in caveolae. Am J Physiol Cell Physiol 2006;291:C569–C578. ArticlePubMed
- 13. Tian J, Cai T, Yuan Z, Wang H, Liu L, Haas M, et al. Binding of Src to Na+/K+-ATPase forms a functional signaling complex. Mol Biol Cell 2006;17:317–326. ArticlePubMedPMC
- 14. Nakhoul F, Thompson CB, McDonough AA. Developmental change in Na,K-ATPase alpha1 and beta1 expression in normal and hypothyroid rat renal cortex. Am J Nephrol 2000;20:225–231. ArticlePubMed
- 15. Kahaly GJ, Dillmann WH. Thyroid hormone action in the heart. Endocr Rev 2005;26:704–728. ArticlePubMedPDF
- 16. Kasturi S, Ismail-Beigi F. Effect of thyroid hormone on the distribution and activity of Na, K-ATPase in ventricular myocardium. Arch Biochem Biophys 2008;475:121–127. ArticlePubMedPMC
- 17. Carageorgiou H, Pantos C, Zarros A, Stolakis V, Mourouzis I, Cokkinos D, et al. Changes in acetylcholinesterase, Na+,K+-ATPase, and Mg2+-ATPase activities in the frontal cortex and the hippocampus of hyper- and hypothyroid adult rats. Metabolism 2007;56:1104–1110. ArticlePubMed
- 18. Koromilas C, Liapi C, Zarros A, Tsela S, Zissis KM, Kalafatakis K, et al. Inhibition of Na(+),K(+)-ATPase in the hypothalamus, pons and cerebellum of the offspring rat due to experimentally-induced maternal hypothyroidism. J Matern Fetal Neonatal Med 2015;28:1438–1444. ArticlePubMed
- 19. DeLuise M, Flier JS. Status of the red cell Na,K-pump in hyper- and hypothyroidism. Metabolism 1983;32:25–30. ArticlePubMed
- 20. Nicolini G, Balzan S, Colzani R, Scarlattini M, Taddei MC, Iervasi G. Erythrocyte Na/K-ATPase is increased in subjects with subclinical hypothyroidism. Clin Endocrinol (Oxf) 2004;60:705–710. ArticlePubMed
- 21. Duntas LH. Thyroid disease and lipids. Thyroid 2002;12:287–293. ArticlePubMed
- 22. Razvi S, Ingoe L, Keeka G, Oates C, McMillan C, Weaver JU. The beneficial effect of L-thyroxine on cardiovascular risk factors, endothelial function, and quality of life in subclinical hypothyroidism: randomized, crossover trial. J Clin Endocrinol Metab 2007;92:1715–1723. ArticlePubMedPDF
- 23. Ruggiero FM, Gnoni GV, Quagliariello E. Effect of hypothyroidism on the lipid composition of rat plasma and erythrocyte membranes. Lipids 1987;22:148–151. ArticlePubMed
- 24. Brasitus TA, Dudeja PK. Effect of hypothyroidism on the lipid composition and fluidity of rat colonic apical plasma membranes. Biochim Biophys Acta 1988;939:189–196. ArticlePubMed
- 25. Noori S, Zafar H, Mahboob T. Biochemical effectiveness of cocoa powder on electrolytes homeostasis, liver and cardiac specific enzymes and renal function. Pak J Nutr 2009;8:882–886.Article
- 26. Macchia T, Mancinelli R, Barbini DA, Taggi F, Avico U, Cantafora A. Determination of membrane cholesterol in normal and pathological red blood cells. Clin Chim Acta 1991;199:59–67. ArticlePubMed
- 27. Kumar AR, Kurup PA. Membrane Na+ K+ ATPase inhibition related dyslipidemia and insulin resistance in neuropsychiatric disorders. Indian J Physiol Pharmacol 2001;45:296–304. PubMed
- 28. Ravi Kumar A, Kurup PA. Digoxin and membrane sodium potassium ATPase inhibition in cardiovascular disease. Indian Heart J 2000;52:315–318. PubMed
- 29. Prasad R, Mond R, Jain S, Kaur G, Chugh KS. Modulation of ouabain sensitive sodium potassium pump of erythrocytes from patients with chronic renal failure: role of acute hemodialysis. Biochem Mol Biol Int 1996;40:1087–1094. ArticlePubMed
- 30. Ismail-Beigi F, Edelman IS. The mechanism of the calorigenic action of thyroid hormone. Stimulation of Na plus + K plus-activated adenosinetriphosphatase activity. J Gen Physiol 1971;57:710–722. ArticlePubMedPMCPDF
- 31. Bell RJ, Rivera-Woll L, Davison SL, Topliss DJ, Donath S, Davis SR. Well-being, health-related quality of life and cardiovascular disease risk profile in women with subclinical thyroid disease: a community-based study. Clin Endocrinol (Oxf) 2007;66:548–556. ArticlePubMed
- 32. Shao Y, Ojamaa K, Klein I, Ismail-Beigi F. Thyroid hormone stimulates Na, K-ATPase gene expression in the hemodynamically unloaded heterotopically transplanted rat heart. Thyroid 2000;10:753–759. ArticlePubMed
- 33. Lambropoulos N, Garcia A, Clarke RJ. Stimulation of Na(+),K(+)-ATPase activity as a possible driving force in cholesterol evolution. J Membr Biol 2016;249:251–259. ArticlePubMedPDF
- 34. Namazi G, Pourfarzam M, Jamshidi Rad S, Movahedian Attar A, Sarrafzadegan N, Sadeghi M, et al. Association of the total cholesterol content of erythrocyte membranes with the severity of disease in stable coronary artery disease. Cholesterol 2014;2014:821686ArticlePubMedPMCPDF
- 35. Gottlieb MH. Rates of cholesterol exchange between human erythrocytes and plasma lipoproteins. Biochim Biophys Acta 1980;600:530–541. ArticlePubMed
- 36. Fielding CJ, Fielding PE. Intracellular cholesterol transport. J Lipid Res 1997;38:1503–1521. ArticlePubMed
- 37. Cornelius F, Habeck M, Kanai R, Toyoshima C, Karlish SJ. General and specific lipid-protein interactions in Na,K-ATPase. Biochim Biophys Acta 2015;1848:1729–1743. ArticlePubMed
- 38. Thompson GR, Soutar AK, Spengel FA, Jadhav A, Gavigan SJ, Myant NB. Defects of receptor-mediated low density lipoprotein catabolism in homozygous familial hypercholesterolemia and hypothyroidism in vivo. Proc Natl Acad Sci U S A 1981;78:2591–2595. ArticlePubMedPMC
- 39. Caraccio N, Ferrannini E, Monzani F. Lipoprotein profile in subclinical hypothyroidism: response to levothyroxine replacement, a randomized placebo-controlled study. J Clin Endocrinol Metab 2002;87:1533–1538. ArticlePubMedPDF
- 40. Tian L, Song Y, Xing M, Zhang W, Ning G, Li X, et al. A novel role for thyroid-stimulating hormone: up-regulation of hepatic 3-hydroxy-3-methyl-glutaryl-coenzyme A reductase expression through the cyclic adenosine monophosphate/protein kinase A/cyclic adenosine monophosphate-responsive element binding protein pathway. Hepatology 2010;52:1401–1409. ArticlePubMed
- 41. Zhang T, Zhou L, Li CC, Shi H, Zhou X. TSH increases synthesis of hepatic ATP-binding cassette subfamily A member 1 in hypercholesterolemia. Biochem Biophys Res Commun 2016;476:75–81. ArticlePubMed
References
Box plot showing distribution of individual study parameter for both subclinical hypothyroidism (SH), overt hypothyroidism (OH), and control (CON) groups. TSH, thyroid stimulating hormone; T4, thyroxine; Mem cho, membrane cholesterol.
Mean, SE, and Indicators Regarding the Normal Distribution of the Study Parameters in All Study Groups
Values are expressed as mean±SE.
SE, standard error; SCH, subclinical hypothyroidism; OH, overt hypothyroidism; BMI, body mass index; TSH, thyroid stimulating hormone; T4, thyroxine; LDL-C, low density lipoprotein cholesterol; HDL-C, high density lipoprotein cholesterol; TG, triglyceride.
aThe Kolmogorov-Smirnov test was used to assay the normality of the distribution of the data. P values >0.05 suggest a normal distribution pattern.
 PubReader
 Cite
Cite

