
Articles
- Page Path
- HOME > Endocrinol Metab > Volume 32(2); 2017 > Article
-
Original ArticleAssociation between Body Weight Changes and Menstrual Irregularity: The Korea National Health and Nutrition Examination Survey 2010 to 2012
-
Kyung Min Ko1, Kyungdo Han2, Youn Jee Chung3, Kun-Ho Yoon1,4, Yong Gyu Park2, Seung-Hwan Lee1,4

-
Endocrinology and Metabolism 2017;32(2):248-256.
DOI: https://doi.org/10.3803/EnM.2017.32.2.248
Published online: June 23, 2017
1Department of Internal Medicine, College of Medicine, The Catholic University of Korea, Seoul, Korea.
2Department of Medical Statistics, College of Medicine, The Catholic University of Korea, Seoul, Korea.
3Department of Obstetrics and Gynecology, College of Medicine, The Catholic University of Korea, Seoul, Korea.
4Division of Endocrinology and Metabolism, Department of Internal Medicine, Seoul St. Mary's Hospital, College of Medicine, The Catholic University of Korea, Seoul, Korea.
- Corresponding author: Seung-Hwan Lee. Division of Endocrinology and Metabolism, Department of Internal Medicine, Seoul St. Mary's Hospital, College of Medicine, The Catholic University of Korea, 222 Banpo-daero, Seocho-gu, Seoul 06591, Korea. Tel: +82-2-2258-6069, Fax: +82-2-595-2534, hwanx2@catholic.ac.kr
- Corresponding author: Yong Gyu Park. Department of Medical Statistics, College of Medicine, The Catholic University of Korea, 222 Banpo-daero, Seocho-gu, Seoul 06591, Korea. Tel: +82-2-2258-7226, Fax: +82-2-595-2534, ygpark@catholic.ac.kr
Copyright © 2017 Korean Endocrine Society
This is an Open Access article distributed under the terms of the Creative Commons Attribution Non-Commercial License (http://creativecommons.org/licenses/by-nc/4.0/) which permits unrestricted non-commercial use, distribution, and reproduction in any medium, provided the original work is properly cited.
ABSTRACT
-
Background
- Menstrual irregularity is an indicator of endocrine disorders and reproductive health status. It is associated with various diseases and medical conditions, including obesity and underweight. We aimed to assess the association between body weight changes and menstrual irregularity in Korean women.
-
Methods
- A total of 4,621 women 19 to 54 years of age who participated in the 2010 to 2012 Korea National Health and Nutrition Examination Survey were included in this study. Self-reported questionnaires were used to collect medical information assessing menstrual health status and body weight changes. Odds ratios (ORs) and 95% confidence interval (CI) were calculated to evaluate the association between body weight changes and menstrual irregularity.
-
Results
- Significantly higher ORs (95% CI) were observed in the association between menstrual irregularity and both weight loss (OR, 1.74; 95% CI, 1.22 to 2.48) and weight gain (OR, 1.45; 95% CI, 1.13 to 1.86) after adjusting for age, body mass index, current smoking, heavy alcohol drinking, regular exercise, calorie intake, education, income, metabolic syndrome, age of menarche, parity, and stress perception. Of note, significant associations were only observed in subjects with obesity and abdominal obesity, but not in non-obese or non-abdominally obese subjects. U-shaped patterns were demonstrated in both obese and abdominally obese subjects, indicating that greater changes in body weight are associated with higher odds of menstrual irregularity.
-
Conclusion
- We found a U-shaped pattern of association between body weight changes and menstrual irregularity among obese women in the general Korean population. This result indicates that not only proper weight management but also changes in body weight may influence the regulation of the menstrual cycle.
- Menstruation is a regular discharge of blood and mucosal tissue from the uterus and typically follows a 28-day cycle that is determined by the rising and falling of sex-steroid hormones during the follicular and luteal phases. Menstrual disorders are common gynecological problems in reproductive women. It is reported that the prevalence of menstrual irregularity ranges from 10% to 38% in menstruating women [12] and is considered an indicator of endocrine disorders and reproductive health status.
- Previous reports have suggested that menstrual irregularity is associated with various diseases and medical conditions, such as metabolic syndrome [34], coronary heart disease [5], type 2 diabetes [6], periodontal disease [7], rheumatoid arthritis [8], dry eye disease [9], and psychological distress [101112]. Furthermore, female reproductive physiology is affected by several conditions, such as fasting [13], extreme weight loss, excessive exercising, medical conditions and even psychological stress or mood disorders, such as depression [1214]. Of note, obesity is known to be closely associated with infertility [1516]. Thus, it could be assumed that menstrual cycle irregularity might be associated with changes in body weight. Because no previous studies have examined the association between menstrual irregularity and body weight changes, we aimed to investigate this relationship in Korean women using large-scale population-based survey data.
INTRODUCTION
- Study population
- This study was conducted using data collected from the Korea National Health and Nutrition Examination Survey (2010 to 2012, KNHANES V). KNHANES is a cross-sectional and nationally representative survey that was conducted by the Division of Chronic Disease Surveillance of the Korea Centers for Disease Control and Prevention. KNHANES was designed to assess national health and nutritional status and consists of a health and nutrition survey collected through household interviews and a health examination and blood sampling conducted in specially equipped examination centers. The sampling frame was designed based on the 2005 population and housing census in Korea and used a rolling sampling design that involved complex, stratified, multistage, clustered, and probability sampling. The details of this survey have been published elsewhere [717].
- Of the 25,534 subjects who participated in the 2010 to 2012 survey, subjects with ages under 19 years (n=5,935), postmenopausal status (n=6,350) or ages over 55 years (n=19), male gender (n=8,461), current pregnancy (n=2), pathologic weight changes over 10 kg (n=142), and incomplete data (n=4) were excluded. There were no breast-feeding women included in this study. Finally, a total of 4,621 subjects 19 to 54 years of age were included in this study. The KNHANES data are available to the public, and written informed consent was obtained from all participants. Ethics approval was obtained from the Institutional Review Board of The Catholic University of Korea (No. KC16OISI0526).
- Health interview
- Self-reported questionnaires were used to collect medical history and lifestyle habit information. Current smokers were defined as those who currently smoke and had smoked at least five packs of cigarettes during their lifetime. Heavy drinkers were defined as subjects who drink more than 30 g/day of alcohol. Regular exercise was defined as performing vigorous physical activity for at least 20 minutes three times a week. Total caloric intake was assessed through a 24-hour dietary recall questionnaire administered by a trained dietitian. Results were calculated using the food composition table developed by the Korean National Rural Resources Development Institute.
- To evaluate changes in body weight, the following question was asked “Were there any weight changes compared to 1 year before?” The answer was categorized into “no change (including weight gain and loss of less than 3 kg),” “weight loss (3 to 6, 6 to 10, more than 10 kg),” or “weight gain (3 to 6, 6 to 10, more than 10 kg).” Self-perceived weight status was assessed by asking, “What do you think of your body weight status?” Responses were categorized into three answers, including lean (very lean and a little lean), normal, and obese (very obese and a little obese). Subjective health status was classified into three answers: good (good and very good), intermediate, and bad (bad and very bad). To evaluate mental health status, subjects were asked to report their levels of psychological stress, continuous depressive symptoms lasting more than 2 weeks during the past year (yes or no) and suicidal ideation over the previous year (yes or no). The level of psychological stress was answered as no, a little, a lot, or very much and was recategorized dichotomously as yes or no.
- Age at menarche was defined as the age at the start of menstruation and asked as an open-ended question “What age did you have your first menstrual period?” Subjects who answered “no” to the question “Do you have regular menstrual periods?” were classified into the menstrual irregularity group.
- Measurements
- Anthropometric measurements were obtained by trained staff members with subjects dressed in a light gown. Waist circumference (WC) was measured in standing position at a level midpoint between the lower rib margin and the iliac crest during minimal respiration and body mass index (BMI) was calculated as the subject's weight (kg) divided by the square of the subject's height (m2). Blood pressure (BP) was measured using a mercury sphygmomanometer three times on the right arm with the subject in a seated position after at least 5 minutes of resting. Blood samples were drawn after at least 8 hours of fasting and were analyzed at a central, certified laboratory (NeoDin Medical Institute, Seoul, Korea). Serum levels of glucose were determined by a hexokinase method; total cholesterol, triglyceride, and high density lipoprotein cholesterol (HDL-C) levels were measured enzymatically with an automatic chemistry analyzer (Hitachi 7600, Hitachi Ltd., Tokyo, Japan); and low density lipoprotein cholesterol (LDL-C) level was calculated using the Friedewald formula. Metabolic syndrome was defined as the presence of ≥3 of the following criteria: (1) abdominal obesity (WC ≥80 cm); (2) high BP (BP ≥130/85 mm Hg) or antihypertensive medication use; (3) fasting glucose (≥100 mg/dL) or antidiabetic medication use; (4) hypertriglyceridemia (≥150 mg/dL); and (5) low HDL-C (<50 mg/dL) or medication use. Self reported hypertension and diabetes were also collected on the questionnaire.
- Statistical analysis
- Statistical analyses were conducted using SAS version 9.4 (SAS Institute Inc., Cary, NC, USA). The SAS survey procedure was applied to reflect the complex sampling design and sampling weights of the KNHANES and to provide nationally representative prevalence estimates. Baseline characteristics were described using means±standard error, geometric means (95% confidence interval [CI]) or percentage (standard error). T tests, analysis of variance, or chi-square tests were used to compare the characteristics between subgroups. Log-transformed variables were used for triglyceride level, which exhibited a skewed deviation. Multivariable logistic regression analysis was used to evaluate the association between body weight changes and menstrual irregularity, and odds ratios (ORs) and 95% CI were calculated after adjusting for potential confounders. Model 1 was adjusted for age and BMI, and model 2 was adjusted for the variable in model 1 plus current smoking, heavy alcohol drinking, regular exercise, calorie intake, education, and income. Model 3 was adjusted for the variables in model 2 plus metabolic syndrome, age of menarche, parity, and stress perception. Subgroup analyses were performed according to obesity (BMI cutoff 25 kg/m2) or abdominal obesity (WC cutoff 80 cm) status [1819]. A P value <0.05 was considered statistically significant.
METHODS
- Baseline characteristics of the subjects
- Metabolic and socioeconomic characteristics of study participants according to body weight changes in the previous year are shown in Table 1. Subjects with weight loss in the previous year were younger, had a higher prevalence of current smoking and regular exercise, and had younger age of menarche compared with the no weight change group. Subjects with weight gain in the previous year were younger; were more obese, with higher BMI and WC levels; had higher total cholesterol and triglyceride and lower HDL-C levels; had a higher prevalence of current smoking and heavy alcohol drinking; and had younger age of menarche compared with the no weight change group. The prevalence of menstrual irregularity was significantly higher in both groups compared with the no weight change group.
- Next, we compared the characteristics between the regular and irregular menstruation groups (Table 2). Subjects with irregular menstruation were more obese; had higher total cholesterol, triglycerides, and LDL-C levels; and had a higher prevalence of diabetes mellitus and metabolic syndrome compared with the regular menstruation group. Lesser subjects in the irregular menstruation group had higher educational level, presence of spouse and parity. The percentage of subjects with no weight change was higher in the group with the absence of menstrual irregularity. Conversely, the percentage of both weight gain and loss among subjects was higher in the presence of menstrual irregularity than in the absence of menstrual irregularity. Higher percentages of subjects reported that they have bad subjective health status, psychological stress, depressive symptoms, and suicidal ideation over the previous year in the irregular menstruation group.
- Relationship of body weight changes with menstrual irregularity
- Multivariable logistic regression analysis was performed to estimate the odds of having menstrual irregularity in the weight loss and weight gain groups using the no change group as a reference (Table 3). Significantly higher ORs (95% CI) were observed in both the weight loss (OR, 1.48; 95% CI, 1.07 to 2.04) and weight gain (OR, 1.30; 95% CI, 1.03 to 1.64) groups after adjusting for age and BMI. Further adjustments for possible confounders did not attenuate these associations, as the weight loss group had 74% greater odds and the weight gain group had 45% greater odds of menstrual irregularity.
- Next, we assessed whether these findings are similar in both non-obese and obese participants. Interestingly, significant associations were only observed in subjects with obesity and abdominal obesity, but not in non-obese or non-abdominally obese subjects. After adjusting for possible confounding factors, the odds of menstrual irregularity was 233% and 207% higher in the weight loss groups who were obese or abdominally obese, respectively. Similarly, weight gain was associated with 162% and 343% greater odds of menstrual irregularity in obese or abdominally obese subjects, respectively.
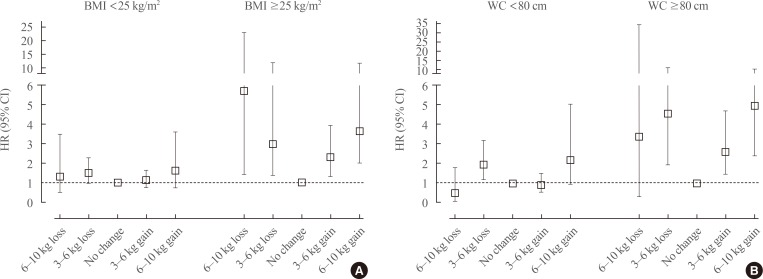
- To evaluate the specific pattern of association between menstrual irregularity and weight changes, weight change values were classified into five subgroups (6 to 10 kg loss, 3 to 6 kg loss, no change, 3 to 6 kg gain, 6 to 10 kg gain). No significant association was noted in non-obese or non-abdominally obese subjects. In contrast, U-shaped patterns were observed in both obese and abdominally obese subjects, indicating that greater changes in body weight are associated with higher risk of menstrual irregularity (Fig. 1). The ORs (95% CI) of menstrual irregularity in subjects with 6 to 10 kg gain were 3.65 (95% CI, 2.00 to 6.65) and 5.00 (95% CI, 2.42 to 10.35) in the obese and abdominally obese groups, respectively. The ORs (95% CI) of menstrual irregularity in subjects with 6 to 10 kg loss were 5.71 (95% CI, 1.40 to 23.26) in the obese group.
RESULTS
- This cross-sectional study is the first large-scale investigation of the association between body weight changes and menstrual irregularity using nationally representative data. We found that menstrual irregularity was associated with body weight changes over the previous year. Furthermore, this association differed by obesity status. Within the obese and abdominally obese groups, both weight gain and weight loss had significant U-shaped associations with increased odds of menstrual irregularity. However, there was no association between menstrual irregularity and body weight changes in the non-obese or non-abdominally obese group.
- Obesity is associated with many comorbidities and obese women frequently suffer from reproductive disorders, including polycystic ovary syndrome, infertility, and menstrual disorders [152021]. However, how increased body weight or adiposity affects the reproductive axis is not fully understood. Hormonal abnormalities, including increased testosterone and insulin levels and a decreased sex hormone-binding globulin (SHBG) level were found in obese women, potentially influencing the menstrual cycle [21]. Obese women also showed decreased excretion of the urinary progesterone metabolite, pregnanediol 3-glucuronide (PDG), and reduced serum and urinary luteinizing hormone (LH) levels; these data indicated that the PDG deficit exceeds the LH deficit and obesity directly affects ovary, oocyte, and corpus luteum function [22]. It was also found that weight reduction with strict calorie restriction results in a decrease in nocturnal urinary LH concentrations, which is correlated with an increase in serum SHBG and inversely related to the severity of insulin resistance [23]. It is likely that the association between decreased LH level and weight reduction is more dependent on the absolute levels of insulin sensitivity than on the amount of general adiposity [23]. Interestingly, there was a primate study using vervet monkeys to examine the effect of weight gain and loss on menstrual cycles and corpus luteum gene expression. In their study, although weight gain and loss did not significantly alter menstrual cyclicity, corpus luteum gene expression was altered, suggesting that weight gain and loss may contribute to corpus luteum dysfunction [22].
- There are several known mechanisms for the influence of adipose tissue on ovulation and menstrual cycle: (1) adipose tissue converts androgens to estrogen by aromatization in breast, abdomen, omentum, and fatty marrow of long bones; (2) body weight influences the direction of estrogen metabolism, with very thin women producing a less potent inactivated form of estrogen (2-hydroxylated form) and obese women producing more potent forms of estrogen because of activated estrogenic activity (16-hydroxylated form); (3) obese women have diminished capacity for estrogen binding with SHBG, which inactivates estrogen and results in an elevated percentage of free serum estradiol; and (4) adipose tissue stores steroid hormones in obese women [24]. In addition, central effects on hypothalamic pituitary axis also potentially regulate ovarian function.
- Previous studies [3] have identified that irregular menstruation is associated with metabolic syndrome, which is consistent with our findings. It was reported that there was a negative relationship between BMI and menarche age in a cohort study [25] and early menarche was associated with increased adult BMI in a meta-analysis [26]. Data have consistently shown that women with early menarche have higher risks of metabolic syndrome, type 2 diabetes and cardiovascular disease [252728]. Conversely, in our study, subjects with menstrual irregularity had a higher age of menarche (14.0±0.1) compared to subjects without menstrual irregularity (13.8±0.0). Late menarche, as well as early menarche, is likely to be related to menstrual irregularity [29]. A number of earlier studies have suggested that medical conditions and psychological factors influence the menstrual cycle [129]. In the present study, psychological stress, depression, and suicidal ideation within previous year were associated with menstrual irregularity. It is possible that unhealthy mental status interrupts hormonal homeostasis along the hypothalamic-pituitary-adrenal (HPA) axis. The hypothalamus regulates the menstrual cycle by secreting pulsatile gonadotropin-releasing hormone (GnRH), and follicular stimulating hormone (FSH) and LH from the pituitary gland are regulated by GnRH. Both FSH and LH are required for follicular maturation and ovulation, which assists in maintaining the corpus luteum. Under stressful conditions, corticotrophin-releasing hormone (CRH) is released from the hypothalamus, and CRH stimulates adrenocorticotropic hormone (ACTH) from the pituitary gland; then cortisol is secreted from adrenal gland, which is stimulated by ACTH. Cortisol inhibits the release of LH by the pituitary gland and estrogen by the ovaries, leading to interruption of the menstruation cycle. In addition, fluctuating estrogen and progesterone levels in the menstrual cycle influence the response of the HPA axis to stress itself [30].
- There are several limitations of our study. First, this was a cross-sectional study. Therefore, we cannot estimate the cause-effect relationship between weight changes and menstrual irregularity. Second, because the degree of body weight changes, menstrual irregularity, stress, and depressive symptoms were measured using self-reported questionnaires, information bias may not fully be excluded. In addition, the pattern or severity of menstrual irregularity couldn't be assessed in detail. Third, how the subjects gained or lost body weight was not evaluated, and possible secondary causes leading to weight changes might have remained. Typically, the health implication of intentional and unintentional weight loss can be significantly different. Fourth, we did not have information on the use of oral contraceptives that might affect menstrual irregularity. In spite of these limitations, this study involved a large sample size using nationally representative data in Korean adults. To the best of our knowledge, this is the first study to separately evaluate the relationship between body weight changes and menstrual irregularity in obese and non-obese groups.
- In conclusion, we found a U-shaped association between body weight changes and menstrual irregularity in obese group among the general Korean population. This result indicates that not only proper weight management but also changes in body weight may influence in the regulation of menstrual cycle.
DISCUSSION
-
CONFLICTS OF INTEREST: No potential conflict of interest relevant to this article was reported.
Article information
- 1. Rowland AS, Baird DD, Long S, Wegienka G, Harlow SD, Alavanja M, et al. Influence of medical conditions and lifestyle factors on the menstrual cycle. Epidemiology 2002;13:668–674. ArticlePubMed
- 2. Palm-Fischbacher S, Ehlert U. Dispositional resilience as a moderator of the relationship between chronic stress and irregular menstrual cycle. J Psychosom Obstet Gynaecol 2014;35:42–50. ArticlePubMed
- 3. Lee SS, Kim DH, Nam GE, Nam HY, Kim YE, Lee SH, et al. Association between metabolic syndrome and menstrual irregularity in middle-aged Korean women. Korean J Fam Med 2016;37:31–36. ArticlePubMedPMCPDF
- 4. Kim MJ, Lim NK, Choi YM, Kim JJ, Hwang KR, Chae SJ, et al. Prevalence of metabolic syndrome is higher among non-obese PCOS women with hyperandrogenism and menstrual irregularity in Korea. PLoS One 2014;9:e99252ArticlePubMedPMC
- 5. Gast GC, Grobbee DE, Smit HA, Bueno-de-Mesquita HB, Samsioe GN, van der Schouw YT. Menstrual cycle characteristics and risk of coronary heart disease and type 2 diabetes. Fertil Steril 2010;94:2379–2381. ArticlePubMed
- 6. Solomon CG, Hu FB, Dunaif A, Rich-Edwards J, Willett WC, Hunter DJ, et al. Long or highly irregular menstrual cycles as a marker for risk of type 2 diabetes mellitus. JAMA 2001;286:2421–2426. ArticlePubMed
- 7. Han K, Ko Y, Park YG, Park JB. Associations between the periodontal disease in women before menopause and menstrual cycle irregularity: the 2010-2012 Korea National Health and Nutrition Examination Survey. Medicine (Baltimore) 2016;95:e2791ArticlePubMedPMC
- 8. Karlson EW, Mandl LA, Hankinson SE, Grodstein F. Do breast-feeding and other reproductive factors influence future risk of rheumatoid arthritis? Results from the Nurses' Health Study. Arthritis Rheum 2004;50:3458–3467. ArticlePubMed
- 9. Song JY, Kim MH, Paik JS, Kim HS, Na KS. Epidemiologic Survey Committee of the Korean Ophthalmologic Society. Association between menstrual irregularity and dry eye disease: a population-based study. Cornea 2016;35:193–198. ArticlePubMed
- 10. Delara M, Woodgate RL. Psychological distress and its correlates among university students: a cross-sectional study. J Pediatr Adolesc Gynecol 2015;28:240–244. ArticlePubMed
- 11. Nagma S, Kapoor G, Bharti R, Batra A, Batra A, Aggarwal A, et al. To evaluate the effect of perceived stress on menstrual function. J Clin Diagn Res 2015;9:QC01–QC03.Article
- 12. Kaplan JR, Manuck SB. Ovarian dysfunction, stress, and disease: a primate continuum. ILAR J 2004;45:89–115. ArticlePubMedPDF
- 13. Yavangi M, Amirzargar MA, Amirzargar N, Dadashpour M. Does Ramadan fasting has any effects on menstrual cycles? Iran J Reprod Med 2013;11:145–150. PubMedPMC
- 14. Chen EC, Brzyski RG. Exercise and reproductive dysfunction. Fertil Steril 1999;71:1–6. ArticlePubMed
- 15. Seth B, Arora S, Singh R. Association of obesity with hormonal imbalance in infertility: a cross-sectional study in north Indian women. Indian J Clin Biochem 2013;28:342–347. ArticlePubMedPMCPDF
- 16. Yilmaz N, Kilic S, Kanat-Pektas M, Gulerman C, Mollamahmutoglu L. The relationship between obesity and fecundity. J Womens Health (Larchmt) 2009;18:633–636. ArticlePubMed
- 17. Lee DH, Jung KY, Park KS, Kim KM, Moon JH, Lim S, et al. Characterization of patients with type 2 diabetes according to body mass index: Korea National Health and Nutrition Examination Survey from 2007 to 2011. Endocrinol Metab (Seoul) 2015;30:514–521. ArticlePubMedPMC
- 18. Lim JS, Choi YJ, Kim SK, Huh BW, Lee EJ, Huh KB. Optimal waist circumference cutoff value based on insulin resistance and visceral obesity in Koreans with type 2 diabetes. Diabetes Metab J 2015;39:253–263. ArticlePubMedPMC
- 19. Yoon YS, Oh SW. Optimal waist circumference cutoff values for the diagnosis of abdominal obesity in Korean adults. Endocrinol Metab (Seoul) 2014;29:418–426. ArticlePubMedPMC
- 20. Seif MW, Diamond K, Nickkho-Amiry M. Obesity and menstrual disorders. Best Pract Res Clin Obstet Gynaecol 2015;29:516–527. ArticlePubMed
- 21. Wei S, Schmidt MD, Dwyer T, Norman RJ, Venn AJ. Obesity and menstrual irregularity: associations with SHBG, testosterone, and insulin. Obesity (Silver Spring) 2009;17:1070–1076. ArticlePubMed
- 22. Kuokkanen S, Polotsky AJ, Chosich J, Bradford AP, Jasinska A, Phang T, et al. Corpus luteum as a novel target of weight changes that contribute to impaired female reproductive physiology and function. Syst Biol Reprod Med 2016;62:227–242. ArticlePubMedPMC
- 23. Butzow TL, Lehtovirta M, Siegberg R, Hovatta O, Koistinen R, Seppala M, et al. The decrease in luteinizing hormone secretion in response to weight reduction is inversely related to the severity of insulin resistance in overweight women. J Clin Endocrinol Metab 2000;85:3271–3275. ArticlePubMed
- 24. Frisch RE. The right weight: body fat, menarche and fertility. Proc Nutr Soc 1994;53:113–129. ArticlePubMed
- 25. Stracciolini A, Quinn BJ, Geminiani E, Kinney S, McCrystal T, Owen M, et al. Body mass index and menstrual patterns in dancers. Clin Pediatr (Phila) 2016 4 18 [Epub]. Article
- 26. Prentice P, Viner RM. Pubertal timing and adult obesity and cardiometabolic risk in women and men: a systematic review and meta-analysis. Int J Obes (Lond) 2013;37:1036–1043. ArticlePubMedPDF
- 27. Lim SW, Ahn JH, Lee JA, Kim DH, Seo JH, Lim JS. Early menarche is associated with metabolic syndrome and insulin resistance in premenopausal Korean women. Eur J Pediatr 2016;175:97–104. ArticlePubMedPDF
- 28. Day FR, Elks CE, Murray A, Ong KK, Perry JR. Puberty timing associated with diabetes, cardiovascular disease and also diverse health outcomes in men and women: the UK Biobank study. Sci Rep 2015;5:11208ArticlePubMedPMCPDF
- 29. Chang PJ, Chen PC, Hsieh CJ, Chiu LT. Risk factors on the menstrual cycle of healthy Taiwanese college nursing students. Aust N Z J Obstet Gynaecol 2009;49:689–694. ArticlePubMed
- 30. Edozien LC. Mind over matter: psychological factors and the menstrual cycle. Curr Opin Obstet Gynecol 2006;18:452–456. ArticlePubMed
References
The association between body weight changes and menstrual irregularity according to obesity status (A) or abdominal obesity status (B). Adjusted for age, body mass index (BMI), current smoking, heavy alcohol drinking, regular exercise, calorie intake, education, income, metabolic syndrome, age of menarche, parity, and stress perception. HR, hazard ratio; CI, confidence interval; WC, waist circumference.
Baseline Characteristics of the Study Subjects According to Body Weight Changes in Previous 1 Year
Baseline Characteristics of the Study Subjects According to the Presence or Absence of Menstrual Irregularity
Odds Ratios for the Presence of Menstrual Irregularity According to Body Weight Changes
BMI, body mass index; WC, waist circumference.
aModel 1: adjusted for age and BMI; bModel 2: adjusted for age, BMI, current smoking, heavy alcohol drinking, regular exercise, calorie intake, education, and income; cModel 3: adjusted as model 2 and metabolic syndrome, age of menarche, parity, and stress perception.
Figure & Data
References
Citations
- Metabolic hormones are integral regulators of female reproductive health and function
Faria Athar, Muskan Karmani, Nicole M. Templeman
Bioscience Reports.2024;[Epub] CrossRef - Efficacy Confirmation Test of Black Cumin (Nigella sativa L.) Seeds Extract Using a High-Fat Diet Mouse Model
Khawaja Muhammad Imran Bashir, Joo Wan Kim, Jong-Kyu Kim, Yoon-Seok Chun, Jae-Suk Choi, Sae-Kwang Ku
Metabolites.2023; 13(4): 501. CrossRef - Body mass index, menstruation, acne, and hirsutism of polycystic ovary syndrome in women: A cross-sectional study
Jung-Hee Kim, Oksoo Kim, Heeja Jung, Yanghee Pang, Hyunju Dan
Health Care for Women International.2022; 43(1-3): 85. CrossRef - A cross-sectional study on prevalence of menstrual problems, lifestyle, mental health, and PCOS awareness among rural and urban population of Punjab, India
Priya Sharma, Mandeep Kaur, Sachin Kumar, Preeti Khetarpal
Journal of Psychosomatic Obstetrics & Gynecology.2022; 43(3): 349. CrossRef - The global pandemic and changes in women’s reproductive health: an observational study
Liya Haile, Niels van de Roemer, Kristina Gemzell-Danielsson, Josep Perelló Capó, Iñaki Lete Lasa, Silvia Vannuccini, Martin C. Koch, Thomas Hildebrandt, Joaquim Calaf
The European Journal of Contraception & Reproductive Health Care.2022; 27(2): 102. CrossRef - A STUDY TO ESTABLISH RELATIONSHIP BETWEEN VARIOUS FACTORS WITH MENSTRUAL IRREGULARITY AMONG RURAL WOMEN IN BHOPAL DISTRICT, MADHYA PRADESH
Shweta Singh, Avadhesh Diwakar
INDIAN JOURNAL OF APPLIED RESEARCH.2022; : 5. CrossRef - The effects of obesity on the menstrual cycle
Khalida Itriyeva
Current Problems in Pediatric and Adolescent Health Care.2022; 52(8): 101241. CrossRef - The association between obesity and weight loss after bariatric surgery on the vaginal microbiota
Olivia Raglan, David A. MacIntyre, Anita Mitra, Yun S. Lee, Ann Smith, Nada Assi, Jaya Nautiyal, Sanjay Purkayastha, Marc J. Gunter, Hani Gabra, Julian R. Marchesi, Phillip R. Bennett, Maria Kyrgiou
Microbiome.2021;[Epub] CrossRef - Do women with HIV/AIDS on anti-retroviral therapy have a lower incidence of symptoms associated with menstrual dysfunction?
Nicola Tempest, Damitha N Edirisinghe, Steven Lane, Dharani K Hapangama
European Journal of Obstetrics & Gynecology and Reproductive Biology.2021; 265: 137. CrossRef - Influence of overweight and obesity on the development of reproductive disorders in women
O.S. Payenok
INTERNATIONAL JOURNAL OF ENDOCRINOLOGY (Ukraine).2021; 17(7): 575. CrossRef - Diabetes: a metabolic and reproductive disorder in women
Eleanor P Thong, Ethel Codner, Joop S E Laven, Helena Teede
The Lancet Diabetes & Endocrinology.2020; 8(2): 134. CrossRef - Menstrual Cycle Length in Women Ages 20-30 years in Makassar
Andi Asmawati Azis, N Kurnia, Hartati, Andi Bida Purnamasari
Journal of Physics: Conference Series.2018; 1028: 012019. CrossRef - Body Weight Changes in Obese Women and Menstruation
Jung Hee Kim
Endocrinology and Metabolism.2017; 32(2): 219. CrossRef - Nutritional Counseling Promotes Changes in the Dietary Habits of Overweight and Obese Adolescents with Polycystic Ovary Syndrome
Adriana Lúcia Carolo, Maria Célia Mendes, Ana Carolina Japur de Sá Rosa e Silva, Carolina Sales Vieira, Marcos Felipe Silva de Sá, Rui Alberto Ferriani, Rosana Maria dos Reis
Revista Brasileira de Ginecologia e Obstetrícia / RBGO Gynecology and Obstetrics.2017; 39(12): 692. CrossRef
 PubReader
 Cite
Cite- Figure
-

- Related articles
-
- Familial Correlation and Heritability of Hand Grip Strength in Korean Adults (Korea National Health and Nutrition Examination Survey 2014 to 2019)
- Intake of Fruit and Glycemic Control in Korean Patients with Diabetes Mellitus Using the Korea National Health and Nutrition Examination Survey
- Associations of Phthalate Metabolites and Bisphenol A Levels with Obesity in Children: The Korean National Environmental Health Survey (KoNEHS) 2015 to 2017

