Articles
- Page Path
- HOME > Endocrinol Metab > Volume 32(4); 2017 > Article
-
Original ArticleClinical Study Factors Associated with Postoperative Diabetes Insipidus after Pituitary Surgery
-
Antonio L. Faltado
 , Anna Angelica Macalalad-Josue, Ralph Jason S. Li, John Paul M. Quisumbing, Marc Gregory Y. Yu, Cecilia A. Jimeno
 -
Endocrinology and Metabolism 2017;32(4):426-433.
DOI: https://doi.org/10.3803/EnM.2017.32.4.426
Published online: November 21, 2017
Section of Endocrinology, Diabetes and Metabolism, Department of Medicine, Philippine General Hospital, University of the Philippines, Manila, Philippines.
- Corresponding author: Antonio L. Faltado Jr. Section of Endocrinology, Diabetes and Metabolism, Department of Medicine, Philippine General Hospital, University of the Philippines, Taft Av, Ermita, Manila 1000, Philippines. Tel: +63-998-851-4700, Fax: +63-922-835-3582, aj_tons@yahoo.com
• Received: June 8, 2017 • Revised: August 10, 2017 • Accepted: August 22, 2017
Copyright © 2017 Korean Endocrine Society
This is an Open Access article distributed under the terms of the Creative Commons Attribution Non-Commercial License (http://creativecommons.org/licenses/by-nc/4.0/) which permits unrestricted non-commercial use, distribution, and reproduction in any medium, provided the original work is properly cited.
ABSTRACT
-
Background
- Determining risk factors for diabetes insipidus (DI) after pituitary surgery is important in improving patient care. Our objective is to determine the factors associated with DI after pituitary surgery.
-
Methods
- We reviewed records of patients who underwent pituitary surgery from 2011 to 2015 at Philippine General Hospital. Patients with preoperative DI were excluded. Multiple logistic regression analysis was performed and a predictive model was generated. The discrimination abilities of the predictive model and individual variables were assessed using the receiving operator characteristic curve.
-
Results
- A total of 230 patients were included. The rate of postoperative DI was 27.8%. Percent change in serum Na (odds ratio [OR], 1.39; 95% confidence interval [CI], 1.15 to 1.69); preoperative serum Na (OR, 1.19; 95% CI, 1.02 to 1.40); and performance of craniotomy (OR, 5.48; 95% CI, 1.60 to 18.80) remained significantly associated with an increased incidence of postoperative DI, while percent change in urine specific gravity (USG) (OR, 0.53; 95% CI, 0.33 to 0.87) and meningioma on histopathology (OR, 0.05; 95% CI, 0.04 to 0.70) were significantly associated with a decreased incidence. The predictive model generated has good diagnostic accuracy in predicting postoperative DI with an area under curve of 0.83.
-
Conclusion
- Greater percent change in serum Na, preoperative serum Na, and performance of craniotomy significantly increased the likelihood of postoperative DI while percent change in USG and meningioma on histopathology were significantly associated with a decreased incidence. The predictive model can be used to generate a scoring system in estimating the risk of postoperative DI.
- Antidiuretic hormone (ADH) is a nonapeptide produced in the magnocellular neurons of the hypothalamic supraoptic and paraventriclar nuclei. It is transported via the hypothalamo-hypophyseal tract, terminating in the neurohypophysis where it matures and is stored for future release [1]. Disturbances in ADH secretion leading to disorders of water balance are among the most common perioperative complications in patients undergoing transsphenoidal surgery [2]. Untreated diabetes insipidus (DI) patients can develop hypernatremia and increased serum osmolality which can lead to dehydration and impaired mental status in severe cases [3].
- Usually a complication of the postsurgical course after pituitary surgery, postoperative DI is transient and benign in the majority of cases. Permanent DI, which is due to damage to the hypothalamus or proximal infundibulum may also occur [4]. The overall incidence of any postoperative (transient or permanent) DI in various series varies from 1.6% to 31% [256]. In the Philippines, two tertiary centers reported a 20% and 24% incidence of postoperative DI after pituitary surgery, respectively [78].
- A few international studies have delved into the risk factors associated with postoperative DI. Those identified include Cushing's disease [69], intraoperative cerebrospinal fluid (CSF) leak [9], microadenoma [9], tumor volume, preoperative to postoperative serum sodium change [10], tumor location [11], and functionality [6] however these results were inconsistent from study to study.
- Determining factors associated with the development of postoperative DI following pituitary surgery is important in improving overall patient care. Physicians will be able to identify in advance which patient populations are at higher risk of developing DI thus aiding them in planning treatment algorithms. Hence, this study aimed to determine the factors associated with DI after pituitary surgery as well as to generate a predictive model that can be used to create a scoring system that will help physicians estimate the risk of postoperative DI enabling earlier identification and more vigilant monitoring of patients undergoing pituitary surgery.
INTRODUCTION
- Study design and setting
- This is a retrospective cohort study conducted at the Philippine General Hospital (PGH), a tertiary university hospital and referral center for pituitary cases. This study was conducted after approval by the University of the Philippines Manila Research Ethics Board.
- Study population and sampling
- All patients who underwent pituitary surgery in PGH from January 2011 to December 2015 were included. Those who had preoperative DI: urine output (UO) (>2.5 mL/kg body weight per hour or at least 4 L per day), urine specific gravity (USG) ≤ 1.005 or urine osmolality <200 mOsm/kg H2O with or without hypernatremia or hyperosmolality present prior to surgery were excluded as well as those given medications that can potentially affect serum Na levels and UO. Patients with missing charts were also excluded.
- Definition of terms
- We defined postoperative DI as the presence of documented voluminous UO (>2.5 mL/kg body weight per hour or at least 4 L per day), with a USG of ≤1.005 or urine osmolality <200 mOsm/kg H2O with or without hypernatremia or hyperosmolality or as clinically diagnosed by the attending endocrinologist, developing anytime during hospital admission following pituitary surgery. Other causes of polyuria such as postoperative water diuresis, glycosuria from diabetes and steroid induced hyperglycemia were differentiated from DI through the findings of normal or increased USG (>1.005) in these cases. If hypotonic polyuria was observed, other potential causes besides DI were first considered.
- Data collection
- Patients included in the study were identified through the computerized databases of the Section of Endocrinology and records in the Department of Pathology. Data were collected using a standardized data collection form. Study subjects were anonymized and were given code numbers as identifiers. Information gathered included age, sex, size of mass, type of mass (macroadenoma vs. microadenoma), histopathology, functionality of tumor, type of surgery, status of surgery, type of surgeon, and other postoperative complications. Laboratory parameters such as preoperative serum Na and USG and first postoperative serum Na and USG were also collected. At our institution, the first postoperative serum Na and USG are usually collected upon arrival at the neurosurgical critical care unit or at least within 6 hours postoperatively. Percent change in serum Na was computed as the difference between postoperative and preoperative serum Na divided by the preoperative serum Na. Percent change in USG was also computed similarly.
- Statistical analysis
- Demographic data were presented using descriptive statistics. Quantitative variables were expressed using means and standard deviations for normally distributed data and median and interquartile range (IQR) for non-normally distributed data, while qualitative variables were expressed using frequencies and percentages. Normality of distribution for continuous variables was tested using the Shapiro-Wilks test. Student t test and Wilcoxon rank sum test were used to compare continuous variables between two groups with normal and non-normal distribution, respectively. Chi-square test was used to compare categorical variables. Prior to predictive modeling, tests for collinearity, confounding, and interaction were performed. Multicollinearity was assumed if the variable inflation factor was >10. Collinear variables that were identified included change in serum Na and USG, and postoperative serum Na and USG; hence, these were excluded in the logistic model. A variable was tested as a possible confounder if the independent variable was related to both the dependent variable (postoperative DI) and the percent change in serum Na. Confounding was considered if the change in odds ratio (OR) in the crude and adjusted logistic model was >10%. Histopathology, functionality, and complications were identified as significant confounders. After checking for interaction, no variables were identified to significantly modify the relationship of postoperative DI and percent change in serum Na. During the univariate logistic regression analysis, variables found to be significant at P<0.2 were entered into an exploratory multivariate logistic regression model for postoperative DI. After univariate analysis, status of surgery (initial vs. repeat), sex, size of mass, and type of mass (macroadenoma vs. microadenoma) were excluded from the full model.
- Multivariate logistic regression was then performed to examine whether percent change in serum sodium was independently associated with postoperative DI after adjustment for age, surgeon (consultant vs. trainee), percent change in USG, preoperative serum Na, preoperative USG, type of surgery, histopathology, functionality, and surgical complications. Independent predictors of postoperative DI were identified using the hierarchical method of variable selection with multivariate logistic regression analysis. The significant variables (P<0.05) after hierarchical stepwise elimination formed the final predictive model: percent change in serum Na, percent change in USG, preoperative serum Na, preoperative USG, type of surgery, and histopathology. The Hosmer-Lemeshow test was used to determine goodness-of-fit of our model. The discrimination abilities (diagnostic accuracy) of the predictive model as well as individual variables—preoperative serum Na and USG, percent change in serum Na and USG, were assessed with the area under the receiver operator characteristic (ROC) curve. All the statistical analyses were performed using STATA 13 (StataCorp, College Station, TX, USA).
METHODS
- A total of 242 patient records were initially retrieved. Of these, 10 patients were excluded due to the presence of preoperative DI, while two patients were excluded because they were given mannitol postoperatively which can affect sodium levels and UO. There were 230 patients included in the final analysis, with 124 females (53.9%) and 106 males (46.1%) and a mean age of 44 years. The demographic and clinical data are summarized in Table 1. Majority of the pituitary masses were greater than 1 cm (96.9%) with a mean size of 3.3 cm. The most common histopathology was that of pituitary adenoma (82.2%), followed by meningioma (8.3%) and craniopharyngioma (8.3%). Most of the tumors were non-functioning (82%). Among the functional pituitary tumors, prolactinoma was the most common (8.5%).
- Transsphenoidal surgery (both nasal and labial approaches) was performed in 170 patients (73.9%). Majority of the cases underwent pituitary surgery for the first time (88.2%). Two thirds of the cases were performed by a neurosurgery consultant. The most common postoperative complication other than DI was infection (3.5%) followed by postsurgical hemorrhage (2.6%).
- In this 5-year period, 64 patients developed postoperative DI with an overall rate of 27.8%. The mean onset of postoperative DI in this study is 27.38 hours after surgery. All laboratory parameters were non-normally distributed and presented as median (IQR) as seen in Table 2. Notably, the absolute and percent change in serum Na and USG (preoperative to 6 hours postoperative) were all statistically greater among patients who developed DI.
- In the univariate analysis (Table 3), age (OR, 0.97; 95% confidence interval [CI], 0.95 to 0.99), craniopharyngioma (OR, 6; 95% CI, 2.17 to 16.7), and craniotomy (OR, 2.5; 95% CI, 1.20 to 4.86) were associated with postoperative DI, without adjustment for other factors. All laboratory parameters (except for preoperative and postoperative serum Na) met the level of statistical significance to be included in the exploratory multivariate logistic regression modeling (cut-off P<0.2). However, since the preoperative and postoperative serum Na are some of our major variable of interest, we decided to include it in the multivariate logistic regression analysis.
- In the final logistic regression model (Table 4), laboratory parameters that were independently associated with postoperative DI include percent change in serum Na (OR, 1.39; 95% CI, 1.15 to 1.69), percent change in USG (OR, 0.53; 95% CI, 0.33 to 0.87), and preoperative serum Na (OR, 1.19; 95% CI, 1.02 to 1.4). The higher the percent change in serum Na and preoperative serum Na, the higher the probability of postoperative DI. Patients with meningioma are less likely to have postoperative DI compared to pituitary adenoma (OR, 0.05; 95% CI, 0.004 to 0.70). On the other hand, patients who underwent craniotomy are five times more likely to develop postoperative DI compared to the transnasal approach. The presence of craniopharyngioma (OR, 0.5; 95% CI, 0.09 to 2.66) and the use of labial approach (OR, 0.64; 95% CI, 0.20 to 1.99) also seem to have less likelihood of postoperative DI; however, these associations did not reach statistical significance.
- Evaluation of goodness of fit indicates a good overall fit of the model with our data (Pearson chi2=130.3, P=0.25; Hosmer-Lemeshow chi2=7.9, P=0.45). The sensitivity and specificity of the model was at 64% and 89%, respectively. In addition, the positive and negative predictive value was at 78% and 80%, respectively. The predictive model was able to correctly predict postoperative DI in 80% of cases.
- Receiver operator characteristic curves
- Fig. 1 shows the ROC curves for the different laboratory parameters that were included in the final model. Individually, the preoperative serum Na (area under curve [AUC], 0.47) and USG (AUC, 0.44) as well as USG (AUC, 0.32) were poor tests in discriminating postoperative DI. The percent change in serum Na (AUC, 0.70) can only fairly discriminate postoperative DI based on the AUC of 0.70 and on the appearance of the ROC curve.
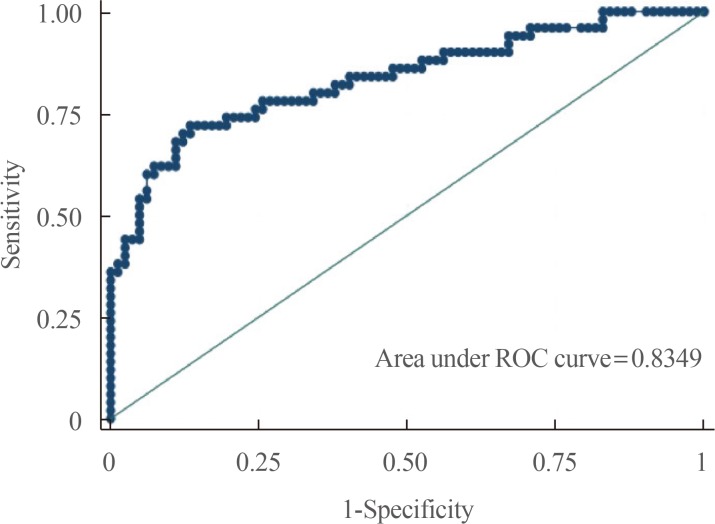
- On the other hand, our predictive model incorporating all four laboratory parameters as well as histopathology and type of surgery has good diagnostic accuracy in predicting postoperative DI with an AUC of 0.83 with an ROC curve shown below (Fig. 2).
RESULTS
- This is the first study in the Philippines to investigate factors associated with postoperative DI after pituitary surgery. The DI incidence in our study is 27.3% higher than the reported 20% by Alinsonorin et al. [8] in 2003. This may be due to the lower number of patients who underwent pituitary surgery reported in the earlier study (87 vs. 230). However, the incidence in our study is still higher than that reported by Nemergut et al. [9] (18.3%), and Schreckinger et al. [10] (16.3%). The mean time of the onset of postoperative DI in our study was 27.38 hours. While most of the postoperative DI resolved prior to discharge, 18 out of the 64 or 28.13% of those who developed postoperative DI were sent home on desmopressin. However, we cannot ascertain if they progressed to permanent DI since we were not able follow the patients after discharge.
- Unlike previous studies, age, sex, tumor size, and CSF leak were not associated with an increased incidence of postoperative DI in this study. Moreover, in contrast to previous reports [912], craniopharyngioma did not appear to be associated with postoperative DI in our study. This may have been due to the relatively small number of craniopharyngioma cases in this present study. Earlier reports found conflicting results with regards to association of mass size with postoperative DI. In some studies, patients with macroadenoma were more likely to have postoperative DI [513], whereas other studies found microadenoma to be more associated with DI [69]. In our study, tumor size did not correlate with the incidence of postoperative DI. Although microadenoma could have been underrepresented in the study. Similar to the results of Nemergut et al. [9], repeated surgery in this study did not increase the incidence of postoperative DI.
- It has been proposed in one study that surgeries done by more experienced surgeons tend to have lower likelihood of developing DI postoperatively [14]; however, our study showed no statistically significant difference with regards to who performed the operation. This can be attributed to a higher volume of surgeries done by experienced surgeons in this study compared to those done by trainees (67% vs. 33%).
- After multivariate logistic regression analysis, only percent change in serum Na, preoperative serum Na, and performance of craniotomy were found to be associated with increased risk of postoperative DI, while percent change in USG and meningioma on histopathology were associated with decreased incidence of DI. The reason why meningiomas are associated with a lower risk of postoperative DI in this study is still uncertain. Performance of craniotomy in the study was found to have significantly increased likelihood of developing postoperative DI. This may be due to a larger tumor size and the extent of tissue involvement when craniotomy is done.
- While increased UO is a hallmark of the diagnosis of postoperative DI, there are several factors that affect urine volume postoperatively such as postoperative mobilization of fluids and medications. Hence, serum Na and USG are used to differentiate these causes from DI. UO postoperatively is difficult to interpret; thus, we only included more objective measures to determine the presence of DI.
- Although the study of Schreckinger et al. [12] found percent change in serum Na to be good predictor of DI with a 96% sensitivity and 50% specificity, our study showed percent change in serum Na to be poor in discriminating postoperative DI based on ROC. Furthermore, preoperative serum Na, preoperative USG, and percent change USG were also not shown to be good predictors of postoperative DI. Hence, specific cut-offs for each variable were not obtained. However, incorporating all these variables into our predictive model showed good diagnostic accuracy in predicting postoperative DI.
- The predictive model from our study can be used to generate a scoring system that will aid physicians in estimating point-of-care risk of postoperative DI, which may improve postoperative monitoring and management.
- There are limitations related to this study. Although there is a correlation of tumor location with postoperative DI in a previous study [11], our study was not able to analyze tumor location because it was not recorded in most of the patients' charts. Moreover, a separate analysis for transient and permanent DI was also not done in this study because we were not able to follow patients after discharge. Another limitation of this present study was that other supporting biochemical data in diagnosing DI such as urine osmolality and serum osmolality were not commonly done in our hospital and were not part of the analysis therefore we relied only on the USG, urine volume and serum Na.
- In conclusion, our study found that greater percent change in serum Na, preoperative serum Na, and performance of craniotomy significantly increased the likelihood of postoperative DI while percent change in USG and meningioma on histopathology were significantly associated with a decreased incidence of postoperative DI. The predictive model from this study has a good diagnostic accuracy in predicting postoperative DI and can be used to generate a scoring system that will aid physicians in estimating the risk of postoperative DI.
DISCUSSION
-
Acknowledgements
- We would like to thank the Records Section of the Outpatient Department of the Philippine General Hospital.
ACKNOWLEDGMENTS
-
CONFLICTS OF INTEREST: No potential conflict of interest relevant to this article was reported.
Article information
- 1. Zimmerman EA, Robinson AG. Hypothalamic neurons secreting vasopressin and neurophysin. Kidney Int 1976;10:12–24. ArticlePubMed
- 2. Singer PA, Sevilla LJ. Postoperative endocrine management of pituitary tumors. Neurosurg Clin N Am 2003;14:123–138. ArticlePubMed
- 3. Sheehan JM, Sheehan JP, Douds GL, Page RB. DDAVP use in patients undergoing transsphenoidal surgery for pituitary adenomas. Acta Neurochir (Wien) 2006 148:287–291. discussion 291. ArticlePubMedPDF
- 4. Postoperative diabetes insipidus. BMJ 1989;298(6671):459.Article
- 5. Black PM, Zervas NT, Candia GL. Incidence and management of complications of transsphenoidal operation for pituitary adenomas. Neurosurgery 1987;20:920–924. ArticlePubMedPDF
- 6. Hensen J, Henig A, Fahlbusch R, Meyer M, Boehnert M, Buchfelder M. Prevalence, predictors and patterns of postoperative polyuria and hyponatraemia in the immediate course after transsphenoidal surgery for pituitary adenomas. Clin Endocrinol (Oxf) 1999;50:431–439. ArticlePubMed
- 7. Fonte JS, Cunanan EC, Matawaran BJ, Mercado-Asis LB. Treatment outcomes of pituitary tumors at the University of Santo Tomas Hospital: 2004-2008. Philipp J Intern Med 2009;47:121–128.Article
- 8. Alinsonorin DG, Santos-Batongbacal MA, Paz-Pacheco E, Trajano-Acampado L. Pituitary adenoma: clinical profile of 120 patients at the Philippine General Hospital. Philipp J Intern Med 2003;41:323–329.
- 9. Nemergut EC, Zuo Z, Jane JA Jr, Laws ER Jr. Predictors of diabetes insipidus after transsphenoidal surgery: a review of 881 patients. J Neurosurg 2005;103:448–454. ArticlePubMed
- 10. Schreckinger M, Walker B, Knepper J, Hornyak M, Hong D, Kim JM, et al. Post-operative diabetes insipidus after endoscopic transsphenoidal surgery. Pituitary 2013;16:445–451. ArticlePubMedPDF
- 11. Hans P, Stevenaert A, Albert A. Study of hypotonic polyuria after trans-sphenoidal pituitary adenomectomy. Intensive Care Med 1986;12:95–99. ArticlePubMedPDF
- 12. Schreckinger M, Szerlip N, Mittal S. Diabetes insipidus following resection of pituitary tumors. Clin Neurol Neurosurg 2013;115:121–126. ArticlePubMed
- 13. Olson BR, Gumowski J, Rubino D, Oldfield EH. Pathophysiology of hyponatremia after transsphenoidal pituitary surgery. J Neurosurg 1997;87:499–507. ArticlePubMed
- 14. Ciric I, Ragin A, Baumgartner C, Pierce D. Complications of transsphenoidal surgery: results of a national survey, review of the literature, and personal experience. Neurosurgery 1997;40:225–236. ArticlePubMed
References
Fig. 1
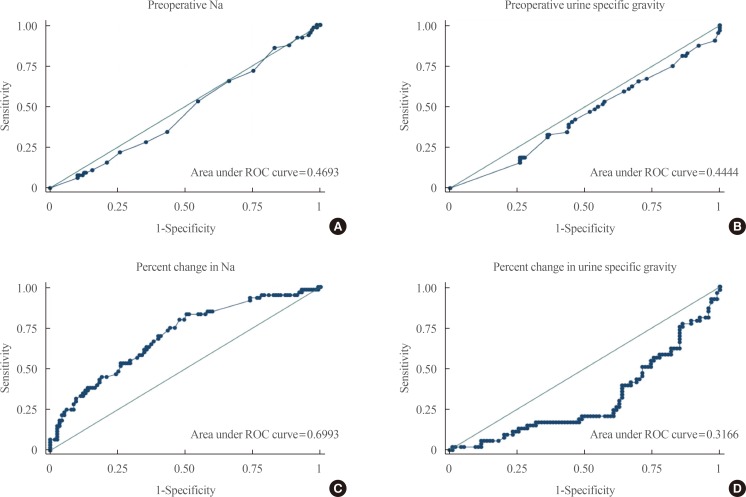
Receiver operator characteristic (ROC) curves of various laboratory parameters. (A) Preoperative sodium. (B) Preoperative urine specific gravity. (C) Percent change in sodium. (D) Percent change in urine specific gravity.

Table 1
![enm-32-426-i001.jpg]()
Demographic Data and Clinical Characteristics of Patients
Table 2
![enm-32-426-i002.jpg]()
Laboratory Characteristics of Patients with and without Postoperative Diabetes Insipidus
Table 3
![enm-32-426-i003.jpg]()
Univariate Analysis
Table 4
![enm-32-426-i004.jpg]()
Multivariate Logistic Regression Analysis
Figure & Data
References
Citations
Citations to this article as recorded by 
- Importance of Intraoperative Factors in Postoperative Arginine Vasopressin Deficiency After Pituitary Adenoma Surgery
Nasim Alidaei, Guive Sharifi, Zahra Davoudi
Endocrine Practice.2024; 30(3): 253. CrossRef - Incidence of post-operative diabetes insipidus and associated factors after pituitary surgery in two teaching hospitals, in Addis Ababa, Ethiopia: A prospective observational study
Abera Chanie, Abat Sahlu
Interdisciplinary Neurosurgery.2024; 37: 101978. CrossRef - Pituitary Adenoma in the Philippines: A Scoping Review on the Treatment Gaps, Challenges, and Current State of Care
Mykha Marie B. Tabuzo, Mary Angeline Luz U. Hernandez, Annabell E. Chua, Patricia D. Maningat, Harold Henrison C. Chiu, Roland Dominic G. Jamora
Medical Sciences.2024; 12(1): 16. CrossRef - Correlation of Pituitary Descent and Diabetes Insipidus After Transsphenoidal Pituitary Macroadenoma Resection
Josh Ma, Peter Gooderham, Ryojo Akagami, Serge Makarenko
Neurosurgery.2023; 92(6): 1269. CrossRef - Risk Factors Related to Transient Diabetes Insipidus Development Following Transsphenoidal Pituitary Adenoma Resection: A Multicentric Study
Marcos Ezequiel Yasuda, Daniela Renedo, Soledad Sosa, Karina Danilowicz, Rodolfo Recalde, Roberto Zaninovich, Santiago Gonzalez Abbati, Andrés Cervio, Sebastian Giovannini, Juan Villalonga, Liezel Ulloque-Caamaño, Kesava Reddy, Mariano Socolovsky, Alvaro
World Neurosurgery.2023; 175: e636. CrossRef - Change in cephalocaudal tumor cavity diameter after transsphenoidal surgery is a predictor of diabetes insipidus in pituitary adenoma
Kunzhe Lin, Kaichun Fan, Shuwen Mu, Shousen Wang
European Journal of Medical Research.2022;[Epub] CrossRef - Change in the pituitary stalk deviation angle after transsphenoidal surgery can predict the development of diabetes insipidus for pituitary adenomas
Liang Xue, Jianwu Wu, Jie Chen, Yongkai Yang
Endocrine Connections.2022;[Epub] CrossRef - Disorders of Salt and Water Balance After Pituitary Surgery
Emily K Brooks, Warrick J Inder
The Journal of Clinical Endocrinology & Metabolism.2022; 108(1): 198. CrossRef - Postoperative diabetes insipidus: how to define and grade this complication?
Friso de Vries, Daniel J. Lobatto, Marco J. T. Verstegen, Wouter R. van Furth, Alberto M. Pereira, Nienke R. Biermasz
Pituitary.2021; 24(2): 284. CrossRef - Diaphragma sellae sinking can predict the onset of hyponatremia after transsphenoidal surgery for pituitary adenomas
Kunzhe Lin, Jun Li, Lingling Lu, Shangming Zhang, Shuwen Mu, Zhijie Pei, Cheng Wang, Jingying Lin, Liang Xue, Liangfeng Wei, Lin Zhao, Shousen Wang
Journal of Endocrinological Investigation.2021; 44(11): 2511. CrossRef - Adrenocorticotropic hormone-secreting pituitary macroadenoma: A pictorial case report and review
Ujjwala Murkute
Indian Journal of Continuing Nursing Education.2021; 22(2): 137. CrossRef - Sodium Perturbations After Pituitary Surgery
Kevin C.J. Yuen, Adnan Ajmal, Ricardo Correa, Andrew S. Little
Neurosurgery Clinics of North America.2019; 30(4): 515. CrossRef
 PubReader
 Cite
Cite