Vascular Cell Adhesion Molecule 1, Intercellular Adhesion Molecule 1, and Cluster of Differentiation 146 Levels in Patients with Type 2 Diabetes with Complications
Article information
Abstract
Background
Type 2 diabetes mellitus (T2DM) is a multisystemic, chronic disease accompanied by microvascular complications involving various complicated mechanisms. Intercellular adhesion molecule 1 (ICAM-1), vascular cell adhesion molecule 1 (VCAM-1), and cluster of differentiation-146 (CD146) are mainly expressed by endothelial cells, and facilitate the adhesion and transmigration of immune cells, leading to inflammation. In the present study, we evaluated the levels of soluble adhesion molecules in patients with microvascular complications of T2DM.
Methods
Serum and whole blood samples were collected from 58 T2DM patients with microvascular complications and 20 age-matched healthy subjects. Levels of soluble ICAM-1 (sICAM-1) and soluble VCAM-1 (sVCAM-1) were assessed using enzyme-linked immunosorbent assay, while flow cytometry was used to determine CD146 levels.
Results
Serum sICAM-1 levels were lower in T2DM patients with microvascular complications than in healthy controls (P<0.05). No significant differences were found in sVCAM-1 and CD146 levels between the study and the control group. Although patients were subdivided into groups according to the type of microvascular complications that they experienced, cell adhesion molecule levels were not correlated with the complication type.
Conclusion
In the study group, most of the patients were on insulin therapy (76%), and 95% of them were receiving angiotensin-converting enzyme (ACE)-inhibitor agents. Insulin and ACE-inhibitors have been shown to decrease soluble adhesion molecule levels via various mechanisms, so we suggest that the decreased or unchanged levels of soluble forms of cellular adhesion molecules in our study group may have resulted from insulin and ACE-inhibitor therapy, as well as tissue-localized inflammation in patients with T2DM.
INTRODUCTION
Type 2 diabetes mellitus (T2DM), which is characterized by hyperglycemia, is a metabolic disease increasing in prevalence worldwide. In patients with uncontrolled diabetes, hyperglycemia leads to oxidative stress and consequent endothelial dysfunction via inflammation. The long-term course of diabetes induces systemic endothelial dysfunction and chronic inflammation, which are responsible for microvascular complications such as diabetic kidney disease (DKD), diabetic retinopathy (DR), and diabetic neuropathy (DN) [1].
DR is characterized by the loss of pericytes, endothelial cell dysfunction, blood-retinal barrier breakdown, diminished capillary perfusion, microaneurysms, hemorrhages, and neovascularization [2].
DKD occurs when postinflammatory vascular changes, diffuse nodular or (less frequently) exudative glomerulosclerosis, and hyalinizing alterations are observed in the blood vessels, along with gradual reduction in the glomerular filtration rate [3].
Tumor necrosis factor α, a proinflammatory cytokine, stimulates endothelial cells, and the induced endothelium expresses adhesion molecules, such as intercellular adhesion molecule 1 (ICAM-1); vascular cell adhesion molecule 1 (VCAM-1); and melanoma cell adhesion molecule 1, which is also known as cluster of differentiation 146 (CD146) [4]. These adhesion molecules are found on the walls of vessels, and they mediate the rolling and transendothelial migration of inflammatory cells into the intima by providing an anchor into the circulation [5]. Prior studies have shown soluble forms of these adhesion molecules to be present in the serum of diabetic patients, suggesting that endothelial activation may play a role in diabetes [678]. Thus, these processes not only affect the vascular endothelium as such, but also contribute to the development of microvascular complications.
Four cellular adhesion molecule (CAM) families have been identified to date: cadherins, selectins, integrins, and the immunoglobulin CAM superfamily (IgSF-CAM). ICAM-1, VCAM-1, and CD146 are normally expressed on the surface of endothelial and epithelial cells at low levels under physiological conditions [9].
Inflammatory cells do not adhere to the vessel wall of a properly functioning endothelium, as a result of the balance between pro- and anti-inflammatory factors. In contrast, under hyperglycemic conditions, excess glucose molecules are non-enzymatically coupled with the lateral chains of lysine in proteins, which is the mechanism through which glycosylation end products are produced, and as a result of oxidative stress, adhesion molecules are produced in higher amounts on the surface of activated endothelial cells [7]. Leukocytes bind to the activated endothelium via CAMs and their receptors (lymphocyte function-associated antigen 1 and very late antigen-4) and transmigrate into the tissues, where they then initiate the inflammatory process [1011]. With the further induction of these pathways, the vascular endothelium is impaired and capillary permeability is increased, leading to substantial microvascular damage and, eventually, the complications observed in T2DM patients [7].
The soluble forms of CAMs can be detected in circulation as potential markers of endothelial dysfunction. Numerous studies have suggested that CAMs play an important role in the development of diabetic complications.
In this study, we aimed to evaluate the concentrations of soluble forms of selected CAMs, since their concentrations might reflect their expression in endothelial cells in patients with microvascular complications of uncontrolled T2DM. We attempted to determine whether levels of these molecules were related to the state of endothelial dysfunction, the extent of systemic inflammation, or the severity of T2DM.
METHODS
The study group consisted of 58 T2DM patients with microvascular complications (DKD, DR, or DN) and 20 healthy age-matched volunteers. All subjects were clinically stable, without acute or chronic infections.
DKD was present in all of the diabetic patients with microvascular complications; DKD was accompanied by DN in three patients, DR in 27 patients, and both DR and DN in 10 patients. A total of 44 of the 58 subjects in the study group were receiving insulin therapy, and 32 were on oral hypoglycemic agents (sulfonylureas or sulfonylureas and biguanides). Eighteen of the subjects in the study group were taking a combination of insulin and oral hypoglycemic agents. Forty-two of the diabetic patients were treated with angiotensin-converting enzyme (ACE) inhibitors. The subjects in the control group were not on medications affecting carbohydrate or lipid metabolism and did not take any vitamin or mineral supplement.
Microvascular complications related to T2DM were identified as present if patients suffered from DKD, DR, or DN based on a diagnosis made by expert nephrologists, neurologists, and ophthalmologists on the basis of detailed examinations, including fundoscopy and electromyelography.
DKD was defined using the urine albumin to creatinine ratio (ACR). Microalbuminuria was defined as an ACR between 30.0 and 299 mg/g and macroalbuminuria as an ACR ≥300 mg/g.
This study was conducted in accordance with the Declaration of Helsinki and approved by the Ethical Committee of Istanbul Education and Research Hospital. Written informed consent was obtained from all subjects.
Demographic data (gender and age), anthropometric data (weight, height, and body mass index [BMI]), and clinical data (disease duration and medication usage) were verified in face-to-face interviews with the subjects.
Routine analyses
Venous blood samples and spot urine samples were obtained for analysis following overnight fasting. All icteric, lipemic, or hemolytic blood samples were discarded. Clinical chemistry analyses (high density lipoprotein cholesterol [HDL-C], low density lipoprotein cholesterol [LDL-C], triglycerides, total cholesterol, glucose, insulin, C-peptide, high-sensitivity C-reactive protein, blood urea nitrogen [BUN], creatinine, hemoglobin A1c [HbA1c], and urinary ACR) were performed on the same day that the sample was obtained, using Siemens Advia 2400 and Centaur XP autoanalyzers with enzymatic and immunoassay methods using commercial kits (Siemens Diagnostics, Siemens Healthcare GmbH, Erlangen, Germany).
Serum soluble ICAM-1 and soluble VCAM-1 levels
For the measurement of serum soluble ICAM-1 (sICAM-1) and soluble VCAM-1 (sVCAM-1) levels, serum samples were stored at −80℃ until the day of analysis. Serum sICAM-1 and sVCAM-1 levels were measured with human sICAM-1 (RayBiotech Inc., Norcross, GA, USA) and human sVCAM-1 (RayBiotech) reagents using the enzyme-linked immunosorbent assay method. For absorbance measurements, a Synergy HT Multi-Mode Microplate Reader (Bio-Tek, Winooski, VT, USA) was used.
Flow cytometric analyses
Flow cytometric analyses were performed using fresh whole blood samples in order to obtain the greatest possible viable cell count. For the flow cytometric analysis of CD146 levels, PE mouse anti-human CD146 (BD Biosciences, San Jose, CA, USA) antibody was used. Peripheral blood cells were dyed using 7-aminoactinomycin D, fluorescent isothiocyanide-marked anti-CD31, phycoerythrin-marked anti-CD146, and PC5-marked anti-lymphocyte common antigen (CD45) antibodies.
Following erythrolysis, cells were evaluated using a FACS-Canto II flow cytometer (BD Biosciences). First, cells were grouped according to their expression of CD45. When CD45- negative cells (i.e., non-lymphocytic cells) were subgrouped according to the expression of CD31 (also known as platelet-endothelial cell adhesion molecule 1) and CD146 on the surface, three different subpopulations (CD31+/CD146+, CD31−/CD146+, and CD31+/CD146−) were obtained. The percentage of these populations was compared between the study group and the control group and within the study group. Peripheral endothelial cells were defined as cells with the CD45−/CD31+/CD146+ expression pattern.
Statistical analyses
Statistical analyses were performed using SPSS version 10.0 (SPSS Inc., Chicago, IL, USA). The Student t test and the Mann-Whitney U test were performed to compare the continuous data, along with the mean and standard deviation. The chi-square test was performed to evaluate the categorical data. P<0.05 was considered to indicate statistical significance within the 95% confidence interval. Correlations between parameters were tested using the Pearson and Spearman correlation coefficients.
RESULTS
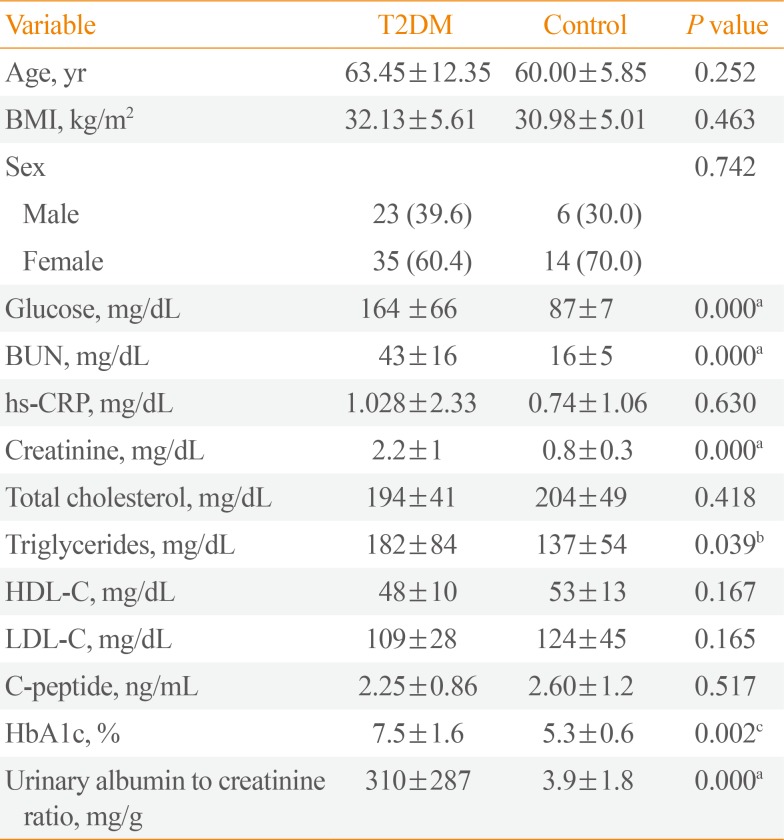
Table 1 summarizes the demographic and biochemical data of the T2DM patients and the control group. Comparisons of the groups according to age, gender, and BMI revealed no significant differences (P>0.05).

Demographic and Biochemical Variables in the Diabetic and Control Subjects
The blood lipid profile, including total cholesterol, LDL-C, and HDL-C, was not significantly different between the groups; however, triglyceride levels were higher in the T2DM group (P<0.05). Glucose, BUN, creatinine, and HbA1c levels, as well as the urinary ACR, were significantly higher in patients with T2DM than in the control group (P<0.001, except for HbA1c). No significant differences were found between the groups in C-peptide or high-sensitive C-reactive protein (hs-CRP) levels.
The endothelial sICAM-1, sVCAM-1, CD31−/CD146+, CD31+/CD146+, and CD31+/CD146− parameters of the control and patient groups are shown in Table 2. sICAM-1 levels were significantly lower in the T2DM group than in the controls (P<0.05). However, no significant differences were found between the groups in the levels of sVCAM-1 or the CD31−/CD146+, CD31+/CD146+, and CD31+/CD146− patterns. No statistically significant difference in the levels of soluble adhesion molecules were found according to gender (Table 2).

Comparison of sICAM-1, sVCAM-1, and CD146 Levels between the T2DM Patients and the Control Group
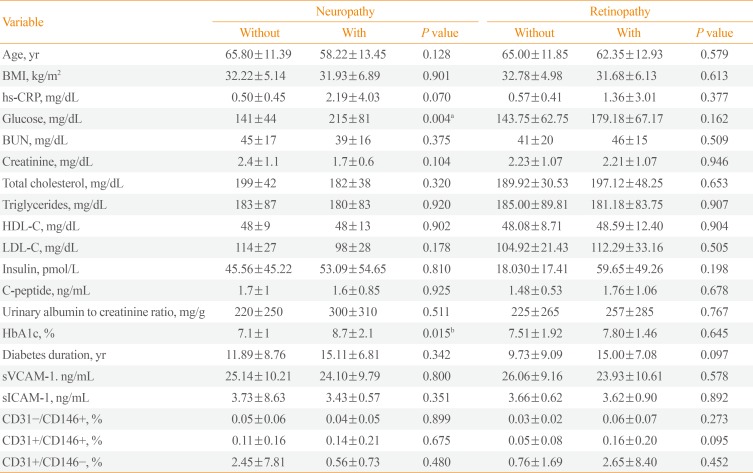
When complications were investigated in isolation, glucose and HbA1c levels were significantly higher in the neuropathy group than in the T2DM patients without neuropathy (P<0.05). However, the demographic, clinical, and biochemical variables did not differ between these groups, and no significant differences were found in the endothelial parameters (P>0.05). When T2DM patients were subdivided according to the presence of DR, no statistically significant differences were observed in the levels of either biochemical or endothelial parameters (P>0.05) (Table 3).

Comparison of Biochemical Variables and sICAM-1, sVCAM-1, and CD146 Levels between the Complication Groups among T2DM
DISCUSSION
In the present study, we investigated whether circulating levels of sICAM-1, sVCAM-1, and CD146 were correlated with endothelial damage leading to diabetic microvascular complications. According to our results, sICAM-1 levels were considerably lower in T2DM patients with microvascular complications than in age-matched healthy controls, irrespective of the type of diabetic complication. The levels of the other soluble CAMs did not differ between the groups.
As a result of long-term hyperglycemia and the development of complications via inflammatory processes, glucose, HbA1c, creatinine, and BUN levels were significantly higher in the T2DM group. We did not detect any significant differences in lipoprotein levels, although triglyceride levels were notably higher in the T2DM group.
DKD was present in all members of the study group, and it was accompanied by DN in 13 patients and by DR in 37 patients. When patients were subdivided according to the type of microvascular complication, no statistically significant differences were found in the levels of circulating CAMs. However, glucose and HbA1c levels were significantly higher in the DN group, as a natural consequence of uncontrolled T2DM that had persisted for a long time.
When compared with the healthy controls, the decreased levels of sICAM-1 in the study group may have been a cause of late-stage diabetic complications. Supporting this hypothesis, studies have shown decreased or stabilized levels of soluble CAMs in unstable diabetic patients [1213]. Additional evidence comes from recent studies showing that the concentrations of soluble CAMs reflected the degree of endothelial damage in the progression of diabetic complications [141516].
The conflicting evidence about the levels of soluble CAMs in circulation suggests that different CAMs may play different roles in different stages of microangiopathy over the course of T2DM, since endothelial cells isolated from diabetic patients have been found to express higher amounts of VCAM-1 than ICAM-1 when stimulated by cytokines in a high-glucose-mediated microenvironment [1718]. In a study of patients with T2DM, the sICAM-1 and sVCAM-1 concentrations were found to be higher in the study group. However, plasma sVCAM-1, but not sICAM-1, was independently associated with DKD, suggesting that sICAM-1 and sVCAM-1 may play different roles in the different stages of the same disease [19].
Increased levels of ICAM-1 have been reported in the diabetic retina in the early stages of retinopathy, suggesting that ICAM-1 mediates the adhesion and transendothelial migration of circulating leukocytes through the retinal vessel walls, one of the earliest pathological changes observed in the course of the development of DR [19]. Further research has found plasma CD146 levels to be elevated at the early stage of diabetic complications [20].
Additional data have shown the increased expression of adhesion molecules in the kidneys during the progression of DKD in T2DM [21]. This is consistent with our findings, in which elevated levels of soluble CAMs were observed in the early stages of diabetic complications. Excess CAMs may be localized on sites of inflammation, such as microvessels, and thus, in the late stages, their levels could be decreased or diminished in the circulation.
However, the studies by Guler et al. [22] and Lu et al. [17], which compared T2DM patients with and without DKD, revealed higher mean levels of sICAM-1 in patients with DKD than in patients without nephropathy.
According to the theory proposed by Kanasaki et al. [23], the binding between CAMs and their receptors can further aggravate tissue damage by causing leukocytes to aggregate on endothelial cells. Additionally, impaired blood flow increases glomerular capillary pressure and stimulates ICAM-1 expression by endothelial cells, resulting in chronic inflammation [23].
A study with a larger sample size by Matsumoto et al. [24] suggested that elevated levels of soluble adhesion molecules might promote diabetic microangiopathy, since ICAM-1, VCAM-1, and E-selectin levels were significantly elevated in patients with microangiopathy. They also speculated that the contribution of ICAM-1 may be greater in microangiopathy than in macroangiopathy, and that diabetic microangiopathy may be closely correlated with chronic hyperglycemia resulting from insulin resistance [24].
Insulin has been shown to be an arterial and venous vasodilator that acts by stimulating nitric oxide (NO) release through increased endothelial nitric oxide synthase (e-NOS) expression, and an inhibitor of ICAM-1 expression that acts by inducing e-NOS and NO generation [25]. Supporting this hypothesis, the majority of our patients (76%) in the microangiopathy group were on insulin therapy.
In order to prevent the above-mentioned adverse changes, ACE inhibitors are used to treat patients. Numerous studies have reported that angiotensin II increased endothelial cell death [7]. As a vasodilator molecule, NO has anti-inflammatory properties and decreases VCAM expression [26]. It has been shown that the inhibition of ACE stimulates NO production by increasing bradykinin [27]. Furthermore, ACE inhibitors have been shown to reduce circulating levels of CAMs in T2DM patients [28].
The ACE inhibitors, which were present in the medication regimen of most of our patients (72%), may have been why reduced sICAM-1 levels were observed jointly with the presence of diabetic microvascular complications in this group. However, why only the sICAM-1 levels were found to be decreased needs more investigation.
Additionally, hs-CRP levels did not differ significantly between the groups, indicating that a non-inflammatory microenvironment was present in the T2DM patients; in light of this finding, observing increased levels of inflammatory substances would not be expected.
In summary, our study shows that circulating sICAM-1 levels were decreased in late-stage T2DM patients with complications, whereas the levels of the other variables that we investigated(sVCAM-1 and CD146) did not differ, suggesting that a local inflammatory model would be appropriate for these molecules. Additionally, the widespread use of insulin and ACE inhibitors in our study group may explain these findings, because those medications have vasodilatory and anti-inflammatory properties. In conclusion, our data suggest that circulating levels of CAMs are not associated with chronic and late-stage complications in T2DM patients, but their role in different stages of the inflammatory process in diabetic patients should be studied further.
Notes
CONFLICTS OF INTEREST: No potential conflict of interest relevant to this article was reported.