Articles
- Page Path
- HOME > Endocrinol Metab > Volume 33(1); 2018 > Article
-
Original ArticleThe Association between Persistent Hypertriglyceridemia and the Risk of Diabetes Development: The Kangbuk Samsung Health Study
-
Yu Hyun Kwon1, Seul-Ki Kim1, Jung Hwan Cho1, Hyemi Kwon1, Se Eun Park1, Hyung-Geun Oh2, Cheol-Young Park1, Won-Young Lee1, Ki-Won Oh1, Sung-Woo Park1, Eun-Jung Rhee1

-
Endocrinology and Metabolism 2018;33(1):55-61.
DOI: https://doi.org/10.3803/EnM.2018.33.1.55
Published online: January 30, 2018
1Division of Endocrinology and Metabolism, Department of Internal Medicine, Kangbuk Samsung Hospital, Sungkyunkwan University School of Medicine, Seoul, Korea.
2Department of Neurology, Soonchunhyang University Cheonan Hospital, Soonchunhyang University College of Medicine, Cheonan, Korea.
- Corresponding author: Eun-Jung Rhee. Division of Endocrinology and Metabolism, Department of Internal Medicine, Kangbuk Samsung Hospital, Sungkyunkwan University School of Medicine, 29 Saemunan-ro, Jongno-gu, Seoul 03181, Korea. Tel: +82-2-2001-2485, Fax: +82-2-2001-1588, hongsiri@hanmail.net
Copyright © 2018 Korean Endocrine Society
This is an Open Access article distributed under the terms of the Creative Commons Attribution Non-Commercial License (http://creativecommons.org/licenses/by-nc/4.0/) which permits unrestricted non-commercial use, distribution, and reproduction in any medium, provided the original work is properly cited.
ABSTRACT
-
Background
- Hypertriglyceridemia is known to have an association with increased risks of insulin resistance and diabetes. The aim of this study was to investigate the risk of diabetes mellitus, according to changes in the concentrations of triglycerides, over time.
-
Methods
- A total of 15,932 non-diabetic participants (mean age 43.2 years, 68% men) who attended five consecutive annual health check-ups at Kangbuk Samsung Hospital, between January 2010 and December 2014, were recruited. Participants were classified according to their triglyceride concentrations; normal (<150 mg/dL) and abnormal (≥150 mg/dL). According to the triglyceride levels in 2010 and 2012, subjects were divided into four groups: normal-normal, normal-abnormal, abnormal-normal, and abnormal-abnormal. The risk for incident diabetes was assessed in 2014.
-
Results
- Among the total subjects, 67.5% belonged to the normal-normal group, 8.6% to the normal-abnormal group, 9.4% to the abnormal-normal group, and 14.5% to the abnormal-abnormal group. A total of 234 subjects (1.5%) were newly diagnosed with diabetes, between 2010 and 2014. Over 4 years, 1%, 1.5%, 2.1%, and 3.0% of the subjects developed diabetes in the normal-normal, normal-abnormal, abnormal-normal, and abnormal-abnormal groups, respectively. When the risk for incident diabetes was analyzed in the groups, after adjusting the confounding variables, a 1.58-fold increase in the risk of diabetes (95% confidence interval [CI], 1.10 to 2.26) was observed in the participants with persistent hypertriglyceridemia (abnormal-abnormal group). This was attenuated by further adjustments for body mass index (BMI) (hazard ratio, 1.25; 95% CI, 0.86 to 1.80).
-
Conclusion
- In this large study population, persistent hypertriglyceridemia, over a period of 2 years, was significantly associated with the risk of incident diabetes, which was attenuated after adjustment for BMI.
- With the increase in the global prevalence of diabetes mellitus and the associated economic burden, efforts to reduce the risk of diabetes development, through identifying individuals at a risk of incident diabetes as well as the modifiable factors, are continuously underway [12].
- Hyperinsulinemia and insulin resistance are the most powerful predictors of the development of type 2 diabetes [34]. Insulin resistance, determined by the hyperinsulinemic euglycemic clamp, is traditionally presented as the most fundamental element of the metabolic syndrome, of which a variety of factors vary from the literature, and new standards are being proposed [56]. In particular, the abnormality of lipid metabolism, in insulin resistance, is characterized by an increase in triglyceride (TG) levels, a decrease in high density lipoprotein cholesterol (HDL-C) levels, and increase in free fatty acid levels. Diabetic dyslipidemia also includes qualitative and kinetic lipid abnormalities, which are more atherogenic in nature, as the cholesteryl ester transfer protein (CETP) increases the production of small dense low density lipoprotein (LDL) particles [789]. These abnormalities of multiple lipid metabolisms in cases of insulin resistance are very complex and the precise pathophysiological mechanisms are not fully understood. The most important factor behind this has been suggested to be excess weight, in particular visceral obesity and expansion in adipose tissue, so called active endocrine organ that influence energy expenditure and metabolism in our body [1011].
- There are many studies that predict the development of diabetes by using the pathophysiology of lipid metabolism in insulin resistance [12131415]. In this retrospective longitudinal study, we investigate the association of the risk of diabetes with changes in TG concentrations, over the course of 4 years.
INTRODUCTION
- Subjects
- This is a retrospective, longitudinal study that evaluated the incidence of diabetes, according to the changes in the TG levels of those who participated in medical health check-up programs at the Health Promotion Center of the Kangbuk Samsung Hospital, Sungkyunkwan University School of Medicine, Seoul, Korea. The purpose of these medical health check-up program is not only primary prevention or early diagnosis but also secondary prevention, through the identification of risk factors for major public health problems such as cardiovascular disease and cancers. Most of the examinees are employees of various industrial companies across the country and their family members. The employers largely pay for the costs of the medical examinations, and a considerable proportion of the examinees undergo examinations annually or biannually.
- Initial data pertaining to a total of 29,956 participants were extracted from the medical checkup programs performed over 5 consecutive years, between January 2010 and December 2014. Among these, 14,024 participants were excluded due to the presence of diabetes in 2010 and 2012 and/or missing data. After the exclusions, 15,932 participants (10,833 men and 5,099 women) were analyzed in this study.
- The participants provided written informed consent for the usage of their medical check-up data for the purpose of this research. The design, protocol, and the consent procedure of this study were reviewed and approved by the Institutional Review Board of Kangbuk Samsung Hospital (KBSMC 2014-11-030). This study was conducted in accordance with the Helsinki Declaration of 1975.
- Anthropometric and laboratory measurements
- The participants' height and weight were measured twice and then averaged. The body mass index (BMI) was calculated by dividing the weight (kg) by the square of the height (m). The waist circumference was measured, with the participants in the standing position, at the middle point between the anterior iliac crest and the lower border of the ribs, by a single examiner. The blood pressure was measured using a standardized sphygmomanometer, after a 5-minute period of rest.
- All the participants were examined after an overnight fast. The hexokinase method was used to measure fasting blood glucose (FBG) concentrations (Hitachi Modular D2400, Roche, Tokyo, Japan). Fasting serum insulin concentrations were determined by electrochemiluminescence immunoassay (Hitachi Modular E170, Roche). An enzymatic colorimetric test was used to measure serum total cholesterol (TC) and TG concentrations. The selective inhibition method was used to measure the level of HDL-C, and a homogeneous enzymatic colorimetric test was used to measure the level of LDL-cholesterol (LDL-C). Glycated hemoglobin (HbA1c) levels were measured by immunoturbidimetric assay with a Cobra Integra 800 automatic analyzer (Roche Diagnostics, Basel, Switzerland), with a reference value of 4.4% to 6.4%. The methodology was aligned with the standard set by the Diabetes Control and Complications Trial (DCCT) and National Glycohemoglobin Standardization Program (NGSP) [14]. The intra-assay coefficient of variation (CV) was 2.3% and the inter-assay CV was 2.4%; both were within the acceptable limits defined by the NGSP [16].
- Information regarding smoking status, alcohol consumption, and exercise status was collected through standardized, self-administered questionnaires. Participants were subsequently categorized as ‘current smoker’ and ‘non-current smoker.’ The item of alcohol consumption was divided into two categories by the number of times participants drank per week: three times or more per week, and less than three times per week. Physical activity was divided into ‘stable state,’ ‘light activities,’ ‘average activities,’ and ‘vigorous activities,’ according to the questionnaire.
- The participants were divided into four groups, based on their TG levels at the baseline (2010) and 2 years later (2012); serum TGs level <150 mg/dL was defined as normal, and serum TGs level ≥150 mg/dL was defined as abnormal.
- As the assessment of the incidence of type 2 diabetes in 2014 was the primary end-point of this study, we excluded participants, with underlying diabetes at the baseline, from the study. The presence of diabetes mellitus was determined according to participants' replies to questionnaires and the diagnostic criteria of the American Diabetes Association [17].
- Statistical analysis
- All data were analyzed using IBM SPSS for Windows version 24.0 (IBM Co., Armonk, NY, USA) and presented as mean±standard deviation and number with percentages. Comparisons of the variables among the four groups, divided by the change in TG levels in 2010 and 2012, were performed by a one-way analysis of variance for continuous variable and the post hoc test using Tukey method was used. Categorical variables were expressed as percentages and compared between groups using the chi-square test. For the multiple comparison analysis, Bonferroni's correction was used to perform post hoc comparisons. Data that did not follow a normal distribution were analyzed after logarithmic transformation. Comparisons of adjusted odds ratios (ORs) for incident diabetes in the four groups, divided by changes in TG levels in 2010 and 2012, were analyzed by multiple logistic regression analysis after adjusting for confounding baseline variables. All the P values were two-tailed, and P<0.05 was considered statistically significant.
METHODS
- Baseline characteristics
- The baseline characteristics of the participants in 2010 are presented in Table 1. The mean age of the participants at the baseline was 43.2 years and 68% of the participants were men. The BMI, FBG level, and HbA1c level at the baseline were 23.6±3.0 kg/m2, 91.0±8.5 mg/dL, and 5.6%±0.3%, respectively.
- Comparison of the baseline characteristics of the participants assigned to groups based on the level of TGs, in 2010 and 2012
- Based on the TG levels in 2010 and 2012, 67.5% of participants were assigned to the normal-normal group, 8.6% to the normal-abnormal group, 9.4% to the abnormal-normal group, and 14.5% to the abnormal-abnormal group (Table 2). The participants in the abnormal-abnormal group had higher mean values of BMI, waist circumference, TC levels, TG levels, FBG levels, and fasting insulin levels, compared to the participants in the other groups. On comparing the normal-abnormal group and the abnormal-normal group, except for the HbA1c and LDL-C levels, the mean values of the BMI, waist circumference, blood pressure, FBG, TGs, HDL-C, and fasting insulin in abnormal-normal group pointed to worse impairment. In terms of lifestyle, the percentage of current smokers and those who consumed alcohol three times or more per week was higher in the order of TG values, and in terms of physical activity, an opposite trend was observed.
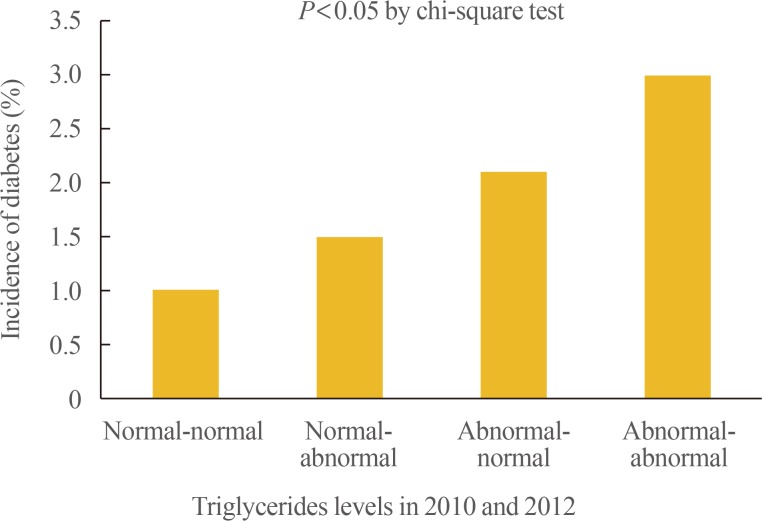
- Incidence rate of and ORs for diabetes in the groups divided by the level of triglycerides, in 2010 and 2012
- A total of 234 subjects (1.5%) in the whole group were newly diagnosed with diabetes, in 2014. The incidence rate for diabetes were 1.0%, 1.5%, 2.1%, and 6.7% in the normal-normal, normal-abnormal, abnormal-normal, and abnormal-abnormal groups, respectively (Table 3, Fig. 1).
- Table 3 shows the ORs and 95% confidence intervals (CIs) for the risk of diabetes development, according to the measurements of fasting TG levels, checked 2 years apart. The participants with persistent hypertriglyceridemia (abnormal-abnormal group) had a 2.928-fold increase in the OR for diabetes development (OR, 2.928; 95% CI, 2.16 to 3.97) compared to those in the normal-normal group. After adjusting the OR for age, sex, FBG level, TC level, alcohol consumption, smoking status and exercise status, a 1.576-fold increase in the risk for diabetes development (OR, 1.576; 95% CI, 1.10 to 2.26) was still observed in the participants in the abnormal-abnormal group, but the correlation was less statistically significant on further adjusting for BMI (OR, 1.25; 95% CI, 0.86 to 1.80). After adjusting the confounding variables, it was found that there was no statistically significant correlation of the diabetes risk between the normal-abnormal group and the abnormal-normal group.
RESULTS
- In this study, an increased risk of diabetes development was observed in the persistent hypertriglyceridemia group, which was assessed after a 2-year interval and compared with the reference group, even after adjusting the confounding factors. When we further adjusted the BMI, a reduction in the risk was observed, which might have been due to the positive correlation between BMI and the TG level [18].
- A number of factors may contribute to the alterations in the lipid metabolism that are observed in patients with insulin resistance or hyperinsulinemia. Insulin-controlled apolipoprotein production in the liver, the regulation of lipoprotein lipase, the actions of CETP, and the peripheral actions of insulin on adipose tissue and muscles are considered to be the important mechanisms responsible for diabetic dyslipidemia [9192021].
- Conversely, many previously conducted studies have demonstrated dyslipidemia as a facilitating factor in the development of pancreatic β-cell apoptosis, insulin biosynthesis, defective insulin secretion, and altered glucose metabolism. Fatty acid metabolism, including ceramide formation, endoplasmic reticulum stress, oxidative stress, inflammation, insulin signal pathway, and protein kinase B, is known to be associated with the damage of pancreatic β-cells [222324]. In addition, prolonged exposure to fatty acids could seriously impair insulin biosynthesis, possibly associated with the activities of transcription factors such as pancreatic duodenal homeobox 1 and MafA [2225]. Several studies have been done on the correlation between insulin secretion deficiency and lipid metabolism, and one of these revealed that islet cholesterol accumulation due to the loss of the ABCA1 gene leads to the impairment of the exocytosis of insulin granules [2627]. Although the reciprocal relationship between diabetes and lipid metabolism is unclear, there is a complex causal relationship between the factors.
- Several studies have pointed to hyperlipidemia values as predictors of diabetes. A significant association between the TC to HDL-C ratio and the risk of diabetes development was found in 5,577 non-diabetic Koreans in a 4-year follow-up [13]. In another study, the risk of development of diabetes, according to changes in the TG level at the baseline and 5 years later, was analyzed in 13,953 Caucasian males with a mean age of 32.4 years [14]. The risk of diabetes showed more than a 12-fold increase in the men who moved from the lowest tertile of the TG levels at the baseline to the highest tertile of the TG levels after 5 years. Among men in whom the highest tertile of the TG levels was maintained at both time points, there was only more than a 7-fold increase in the risk of diabetes development. This is in accordance with a recent study in which the risk for diabetes development increased in participants with large variations in TC levels, among 2,827,950 Koreans [15]. The discrepancy in our research, pertaining to the participants with persistent hypertriglyceridemia showing the highest risk of diabetes, was probably due to the difference in the age, sex, race, and follow-up period.
- We could not find any correlation between the risk of diabetes in the normal-abnormal group and abnormal-normal group, after adjusting the compounding variables. This suggests that a single measurement at a particular time point may be insufficient to assess the risk of developing diabetes. The probability of developing diabetes significantly increases only if two consecutive measurements of TGs are above 150 mg/dL. Although this was not of statistical significance, the metabolic parameters at the baseline were more impaired and the incidence of diabetes was higher in the abnormal-normal group than in the normal-abnormal group. This suggests that it could take years for diabetes to develop due to hypertriglyceridemia, as the presence of insulin resistance precedes the onset of the disease by 10 to 20 years [2829].
- Although an elevated risk of diabetes can be predicted in participants with high TG levels, based on the current literature as well as the findings of this study, it cannot be assumed that a reduction in the levels of TGs in a fragmentary manner will lower the risk for the development of diabetes. Statins are effective in lowering LDL-C levels as well as very LDL levels [30]. However, they have been found to modestly increase the risk of developing diabetes mellitus [31]. The inhibition of isoprenoid biosynthesis, downregulation of C/EBPα (CCAAT-enhancer-binding protein) production, downregulation of GLUT4/SLC2A4 (glucose transporter type 4/solute carrier family 2 member 4) in adipocytes, and over-production of nitric oxide are the various mechanisms of statin-induced diabetes mellitus that have been proposed so far, but there are no clear ideas [32]. Therefore, when statins are used, in addition to their TG lowering effects, their diabetogenic potential mechanism should also be considered.
- Finally, when BMI was further included in the model, statistical significance was attenuated. However, in a study published in 2014, regardless of obesity, the metabolically unhealthy group based on the component of metabolic syndrome had a higher risk of future diabetes development [33]. Persistent hypertriglyceridemia may not be an independent or sole risk factor for diabetes development and it has definitely weaker influence for diabetes development than BMI. However, subjects with persistent hypertriglycetidemia should be monitored for future diabetes development in clinical setting.
- Our study has several limitations. Frist, since this study was observational in design, it is likely that some of the factors that have a significant impact on the outcome have not been controlled. Second, the follow-up period was 4 years, which is perhaps not a long enough period. Extending the length of the follow-up period may result in different outcomes. Third, whether the changes in the TG levels were due to lipid lowering therapy or lifestyle changes was not taken into consideration. Finally, we set the cut-off value of the TG level at 150 mg/dL, but we did not study the changes in the associations below 150 mg/dL or above 150 mg/dL of TGs. Despite these limitations, however, this is the first study to compare the change in TG levels over time and the risk of diabetes development, in community-dwelling Koreans.
- In conclusion, this is the first large population-based study to investigate the relationship between the risk of diabetes development and changes in TG levels over time, in Korea. In this study, it was observed that there was an increased risk of diabetes development in the participants with persistent hypertriglyceridemia. Therefore, the sequential measurement of TG levels, more than twice, can help predict the risk of diabetes development in the general population. Further studies are required to find a specific framework than can be used in clinical practice.
DISCUSSION
-
CONFLICTS OF INTEREST: No potential conflict of interest relevant to this article was reported.
Article information
- 1. Seuring T, Archangelidi O, Suhrcke M. The economic costs of type 2 diabetes: a global systematic review. Pharmacoeconomics 2015;33:811–831. ArticlePubMedPMCPDF
- 2. Shaw JE, Sicree RA, Zimmet PZ. Global estimates of the prevalence of diabetes for 2010 and 2030. Diabetes Res Clin Pract 2010;87:4–14. ArticlePubMed
- 3. Ohn JH, Kwak SH, Cho YM, Lim S, Jang HC, Park KS, et al. 10-Year trajectory of β-cell function and insulin sensitivity in the development of type 2 diabetes: a community-based prospective cohort study. Lancet Diabetes Endocrinol 2016;4:27–34. ArticlePubMed
- 4. Abdul-Ghani MA, Williams K, DeFronzo RA, Stern M. What is the best predictor of future type 2 diabetes? Diabetes Care 2007;30:1544–1548. ArticlePubMed
- 5. Gutch M, Kumar S, Razi SM, Gupta KK, Gupta A. Assessment of insulin sensitivity/resistance. Indian J Endocrinol Metab 2015;19:160–164. ArticlePubMedPMC
- 6. Roberts CK, Hevener AL, Barnard RJ. Metabolic syndrome and insulin resistance: underlying causes and modification by exercise training. Compr Physiol 2013;3:1–58. ArticlePubMedPMC
- 7. Verges B. Pathophysiology of diabetic dyslipidaemia: where are we? Diabetologia 2015;58:886–899. ArticlePubMedPMCPDF
- 8. Sandhofer A, Kaser S, Ritsch A, Laimer M, Engl J, Paulweber B, et al. Cholesteryl ester transfer protein in metabolic syndrome. Obesity (Silver Spring) 2006;14:812–818. ArticlePubMed
- 9. Bardini G, Rotella CM, Giannini S. Dyslipidemia and diabetes: reciprocal impact of impaired lipid metabolism and beta-cell dysfunction on micro- and macrovascular complications. Rev Diabet Stud 2012;9:82–93. ArticlePubMedPMC
- 10. Tchernof A, Despres JP. Pathophysiology of human visceral obesity: an update. Physiol Rev 2013;93:359–404. ArticlePubMed
- 11. Galic S, Oakhill JS, Steinberg GR. Adipose tissue as an endocrine organ. Mol Cell Endocrinol 2010;316:129–139. ArticlePubMed
- 12. Dotevall A, Johansson S, Wilhelmsen L, Rosengren A. Increased levels of triglycerides, BMI and blood pressure and low physical activity increase the risk of diabetes in Swedish women. A prospective 18-year follow-up of the BEDA study. Diabet Med 2004;21:615–622. ArticlePubMed
- 13. Seo MH, Bae JC, Park SE, Rhee EJ, Park CY, Oh KW, et al. Association of lipid and lipoprotein profiles with future development of type 2 diabetes in nondiabetic Korean subjects: a 4-year retrospective, longitudinal study. J Clin Endocrinol Metab 2011;96:E2050–E2054. ArticlePubMedPDF
- 14. Tirosh A, Shai I, Bitzur R, Kochba I, Tekes-Manova D, Israeli E, et al. Changes in triglyceride levels over time and risk of type 2 diabetes in young men. Diabetes Care 2008;31:2032–2037. ArticlePubMedPMC
- 15. Rhee EJ, Han K, Ko SH, Ko KS, Lee WY. Increased risk for diabetes development in subjects with large variation in total cholesterol levels in 2,827,950 Koreans: a nationwide population-based study. PLoS One 2017;12:e0176615. ArticlePubMedPMC
- 16. Schwartz KL, Monsur JC, Bartoces MG, West PA, Neale AV. Correlation of same-visit HbA1c test with laboratory-based measurements: a MetroNet study. BMC Fam Pract 2005;6:28ArticlePubMedPMCPDF
- 17. Marathe PH, Gao HX, Close KL. American Diabetes Association standards of medical care in diabetes 2017. J Diabetes 2017;9:320–324. ArticlePubMed
- 18. Sommariva D, Tirrito M, Bellintani L, Bonfiglioli D, Branchi A, Pogliaghi I, et al. Interrelationships between body mass and lipid and lipoprotein triglycerides and cholesterol in obese women. Ric Clin Lab 1986;16:481–488. ArticlePubMedPDF
- 19. Shimada A, Kimura H, Oida K, Kanehara H, Bando Y, Sakamoto S, et al. Serum CETP status is independently associated with reduction rates in LDL-C in pitavastatin-treated diabetic patients and possible involvement of LXR in its association. Lipids Health Dis 2016;15:57ArticlePubMedPMC
- 20. Ginsberg HN, Zhang YL, Hernandez-Ono A. Regulation of plasma triglycerides in insulin resistance and diabetes. Arch Med Res 2005;36:232–240. ArticlePubMed
- 21. Muacevic-Katanec D, Reiner Z. Diabetic dyslipidemia or ‘diabetes lipidus’? Expert Rev Cardiovasc Ther 2011;9:341–348. ArticlePubMed
- 22. Hagman DK, Hays LB, Parazzoli SD, Poitout V. Palmitate inhibits insulin gene expression by altering PDX-1 nuclear localization and reducing MafA expression in isolated rat islets of Langerhans. J Biol Chem 2005;280:32413–32418. ArticlePubMedPMC
- 23. Shimabukuro M, Higa M, Zhou YT, Wang MY, Newgard CB, Unger RH. Lipoapoptosis in beta-cells of obese prediabetic fa/fa rats. Role of serine palmitoyltransferase overexpression. J Biol Chem 1998;273:32487–32490. ArticlePubMed
- 24. Cunha DA, Hekerman P, Ladriere L, Bazarra-Castro A, Ortis F, Wakeham MC, et al. Initiation and execution of lipotoxic ER stress in pancreatic beta-cells. J Cell Sci 2008;121(Pt 14):2308–2318. ArticlePubMed
- 25. Poitout V, Hagman D, Stein R, Artner I, Robertson RP, Harmon JS. Regulation of the insulin gene by glucose and fatty acids. J Nutr 2006;136:873–876. ArticlePubMedPMCPDF
- 26. Kruit JK, Wijesekara N, Fox JE, Dai XQ, Brunham LR, Searle GJ, et al. Islet cholesterol accumulation due to loss of ABCA1 leads to impaired exocytosis of insulin granules. Diabetes 2011;60:3186–3196. ArticlePubMedPMC
- 27. Hao M, Head WS, Gunawardana SC, Hasty AH, Piston DW. Direct effect of cholesterol on insulin secretion: a novel mechanism for pancreatic beta-cell dysfunction. Diabetes 2007;56:2328–2338. ArticlePubMed
- 28. Warram JH, Martin BC, Krolewski AS, Soeldner JS, Kahn CR. Slow glucose removal rate and hyperinsulinemia precede the development of type II diabetes in the offspring of diabetic parents. Ann Intern Med 1990;113:909–915. ArticlePubMed
- 29. Lillioja S, Mott DM, Howard BV, Bennett PH, Yki-Jarvinen H, Freymond D, et al. Impaired glucose tolerance as a disorder of insulin action. Longitudinal and cross-sectional studies in Pima Indians. N Engl J Med 1988;318:1217–1225. ArticlePubMed
- 30. Ginsberg HN. Effects of statins on triglyceride metabolism. Am J Cardiol 1998;81:32B–35B. ArticlePubMed
- 31. Shah RV, Goldfine AB. Statins and risk of new-onset diabetes mellitus. Circulation 2012;126:e282–e284. ArticlePubMed
- 32. Chogtu B, Magazine R, Bairy KL. Statin use and risk of diabetes mellitus. World J Diabetes 2015;6:352–357. ArticlePubMedPMC
- 33. Rhee EJ, Lee MK, Kim JD, Jeon WS, Bae JC, Park SE, et al. Metabolic health is a more important determinant for diabetes development than simple obesity: a 4-year retrospective longitudinal study. PLoS One 2014;9:e98369. ArticlePubMedPMC
References

Baseline Characteristics of the Participants (n=15,932)
Comparisons of Metabolic Parameters among Groups Divided by Triglycerides Level, in 2010 and 2012 (n=15,932)
Values are expressed as mean±SD or number (%).
BMI, body mass index; SBP, systolic blood pressure; DBP, diastolic blood pressure; FBG, fasting blood glucose; TC, total cholesterol; TG, triglyceride; HDL-C, high density lipoprotein cholesterol; LDL-C, low density lipoprotein cholesterol; HbA1c, glycated hemoglobin.
aMean values of all groups were significantly different when analyzed by one-way analysis of variance test.
Risk of Diabetes Development in 2014, according to Triglyceride Levels in 2010 and 2012
Model 1, unadjusted; Model 2, adjusted for age and sex; Model 3, adjusted for variables in model 2 plus fasting blood glucose and total cholesterol; Model 4, adjusted for variables in model 3 plus alcohol consumption, smoking habits, and exercise; Model 5, adjusted for variables in model 4 plus body mass index.
Figure & Data
References
Citations
- Cumulative exposure to hypertriglyceridemia and risk of type 2 diabetes in young adults
Min-Kyung Lee, Kyungdo Han, Bongsung Kim, Jong-Dai Kim, Moon Jung Kim, Byungpyo Kim, Jung Heo, Jiyeon Ahn, Seo-Young Sohn, Jae-Hyuk Lee
Diabetes Research and Clinical Practice.2024; 208: 111109. CrossRef - Usefulness of SPISE Index for Screening and Detection of Early Stages of Insulin Resistance among Chilean Young Adults
Isabel Pereyra González, Sandra Lopez-Arana
Annals of Nutrition and Metabolism.2023; 79(4): 372. CrossRef - Lipid variability in patients with diabetes mellitus
Jeongmin Lee, Seung-Hwan Lee
Cardiovascular Prevention and Pharmacotherapy.2023; 5(4): 126. CrossRef - Sesamin: A Promising Therapeutic Agent for Ameliorating Symptoms of Diabetes
Shu-Ming Huang, Cheng-Hung Chuang, Christine Joyce F. Rejano, Lemmuel L. Tayo, Cheng-Yang Hsieh, Steven Kuan-Hua Huang, Po-Wei Tsai
Molecules.2023; 28(21): 7255. CrossRef - Variability, Mean, and Baseline Values of Metabolic Parameters in Predicting Risk of Type 2 Diabetes
Duong Duc Pham, Jaekyung Song, Yunwan Jeon, Ibrahimi Hajar, Chae Hun Leem
The Journal of Clinical Endocrinology & Metabolism.2022; 107(5): 1270. CrossRef - Lipid Variability and Diabetes Mellitus
Jeongmin Lee, Seung-Hwan Lee
The Journal of Korean Diabetes.2022; 23(1): 28. CrossRef - The Risk of Type 2 Diabetes Mellitus in a Russian Population Cohort According to Data from the HAPIEE Project
Svetlana V. Mustafina, Oksana D. Rymar, Liliya V. Shcherbakova, Evgeniy G. Verevkin, Hynek Pikhart, Olga V. Sazonova, Yuliya I. Ragino, Galina I. Simonova, Martin Bobak, Sofia K. Malyutina, Mikhail I. Voevoda
Journal of Personalized Medicine.2021; 11(2): 119. CrossRef - The influence of VDR polymorphisms on the type 2 diabetes susceptibility in Chinese: an interaction with hypertriglyceridemia
Dongdong Zhang, Cheng Cheng, Yan Wang, Yuan Xue, Yaping Liu, Yiming Liu, Mingming Feng, Ze Xu, Wenjie Li, Xing Li
Molecular Genetics and Genomics.2021; 296(4): 837. CrossRef - Development and validation of a new diabetes index for the risk classification of present and new-onset diabetes: multicohort study
Shinje Moon, Ji-Yong Jang, Yumin Kim, Chang-Myung Oh
Scientific Reports.2021;[Epub] CrossRef - Hypertriglyceridemia as an Independent Predictor for Ten-Year Incidence of Diabetes in Thais
Suranut Charoensri, Supatida Turnsaket, Chatlert Pongchaiyakul
Vascular Health and Risk Management.2021; Volume 17: 519. CrossRef - Prevalence and Current Management of Cardiovascular Risk Factors in Korean Adults Based on Fact Sheets
Eun-Jung Rhee
Endocrinology and Metabolism.2020; 35(1): 85. CrossRef - HDL-Cholesterol, Its Variability, and the Risk of Diabetes: A Nationwide Population-Based Study
Seung-Hwan Lee, Hun-Sung Kim, Yong-Moon Park, Hyuk-Sang Kwon, Kun-Ho Yoon, Kyungdo Han, Mee Kyoung Kim
The Journal of Clinical Endocrinology & Metabolism.2019; 104(11): 5633. CrossRef - Response: The Association between Persistent Hypertriglyceridemia and the Risk of Diabetes Development: The Kangbuk Samsung Health Study (Endocrinol Metab 2018;33:55–61, Yu Hyun Kwon et al.)
Eun-Jung Rhee, Yu Hyun Kwon
Endocrinology and Metabolism.2018; 33(3): 425. CrossRef - The Association between Persistent Hypertriglyceridemia and the Risk of Diabetes Development: The Kangbuk Samsung Health Study (Endocrinol Metab 2018;33:55–61, Yu Hyun Kwon et al.)
Mi Hae Seo
Endocrinology and Metabolism.2018; 33(2): 305. CrossRef
 PubReader
 ePub Link
 Cite
Cite