
Articles
- Page Path
- HOME > Endocrinol Metab > Volume 33(1); 2018 > Article
-
Original ArticleAssociation between White Blood Cell Counts within Normal Range and Hemoglobin A1c in a Korean Population
-
Jae Won Hong, Jung Hyun Noh, Dong-Jun Kim

-
Endocrinology and Metabolism 2018;33(1):79-87.
DOI: https://doi.org/10.3803/EnM.2018.33.1.79
Published online: January 30, 2018
Department of Internal Medicine, Inje University Ilsan Paik Hospital, Inje University College of Medicine, Goyang, Korea.
- Corresponding author: Dong-Jun Kim. Department of Internal Medicine, Inje University Ilsan Paik Hospital, Inje University College of Medicine, 170 Juhwa-ro, Ilsanseo-gu, Goyang 10380, Korea. Tel: +82-31-910-7205, Fax: +82-31-913-5095, djkim@paik.ac.kr
Copyright © 2018 Korean Endocrine Society
This is an Open Access article distributed under the terms of the Creative Commons Attribution Non-Commercial License (http://creativecommons.org/licenses/by-nc/4.0/) which permits unrestricted non-commercial use, distribution, and reproduction in any medium, provided the original work is properly cited.
ABSTRACT
-
Background
- We examined whether white blood cell (WBC) count levels within normal range, could be associated with hemoglobin A1c (HbA1c) levels.
-
Methods
- Among the 11,472 people (≥19 years of age) who participated in the 2011 to 2012 Korea National Health and Nutrition Examination, subjects with chronic disease or illness, including 807 patients with diabetes currently taking anti-diabetic medications and/or 1,149 subjects with WBC levels <4,000 or >10,000/µL were excluded.
-
Results
- Overall, adjusted HbA1c levels increased across the WBC quartiles (5.55%±0.01%, 5.58%±0.01%, 5.60%±0.01%, and 5.65%±0.01%, P<0.001) after adjusting for confounding factors, such as age, gender, fasting plasma glucose, college graduation, smoking history, waist circumference, presence of hypertension, serum total cholesterol, serum triglyceride, and presence of anemia. The adjusted proportions (%) of HbA1c levels of ≥5.7%, ≥6.1%, and ≥6.5% showed significant increases across WBC quartiles (P<0.001, P=0.002, and P=0.022, respectively). Logistic regression analyses of WBC quartiles for the risk of HbA1c levels of ≥5.7%, ≥6.1%, and ≥6.5%, using the variables above as covariates, showed that the odds ratios of the fourth quartile of WBCs were 1.59 (95% confidence interval [CI], 1.35 to 1.89; P<0.001), 1.78 (95% CI, 1.31 to 2.42; P<0.001), and 2.03 (95% CI, 1.13 to 3.64; P=0.018), using the first quartile of WBCs as the reference.
-
Conclusion
- HbA1c levels were positively associated with WBC levels within normal range in a general adult population.
- Hemoglobin A1c (HbA1c) is used to diagnose diabetes and to identify individuals at high risk of developing diabetes or prediabetes, as well as to monitor the overall glucose control during the previous 2 to 3 months [1]. The American Diabetes Association has suggested that an HbA1c level of ≥6.5% is the diagnostic cut-off point for diabetes and that a level of 5.7% is the threshold for prediabetes [2]. Measurement of HbA1c levels to screen for diabetes or prediabetes has many advantages over measuring the fasting plasma glucose (FPG) level or performing the 75-g oral glucose tolerance test (OGTT). However, HbA1c levels can be influenced by a variety of factors, including age, ethnicity, smoking, conditions that alter red cell turnover, as well as glucose levels [345678].
- Several studies have shown that increased inflammation responses also influence HbA1c levels [910]. To date, most studies have investigated the effect of inflammation on the hyperglycemia or HbA1c levels in patients with type 2 diabetes. It is assumed that chronic inflammation impairs glucose metabolism and elevates the blood glucose concentrations, affecting higher HbA1c levels. This background has led to translation to clinical trials using anti-inflammatory drugs, investigating that inflammation might be a therapeutic target in type 2 diabetes, despite disappointing results from several studies [1112].
- Recently, a few studies have reported that HbA1c is positively associated with inflammation, even in nondiabetic subjects [1314]. Previous study showed that an elevated leucocyte count and high-sensitivity C-reactive protein (hs-CRP) were associated with changes in HbA1c before the diagnosis of type 2 diabetes [15]. Furthermore, Liu et al. [9] demonstrated that HbA1c was positively associated with inflammation, even independent of FPG level, in nondiabetic subjects.
- Although white blood cell (WBC) count is commonly measured as a reliable marker of systemic inflammation in clinical practice, few studies have investigated the clinical association of WBC level within normal range and HbA1c level, especially as a screening parameter for diabetes or prediabetes. Thus, we examined whether blood WBC levels within normal range could be associated with HbA1c levels, as a non-glycemic parameter, in a general adult population based on data from the 2011 to 2012 Korea National Health and Nutrition Examination Survey (KNHANES).
INTRODUCTION
- Study population and data collection
- This study is based on data from the 2011 to 2012 KNHANES, a cross-sectional and nationally representative survey conducted by the Korea Centers for Disease Control and Prevention (KCDC) [16]. The KNHANES has been conducted periodically since 1998 to assess the health and nutritional status of the civilian, non-institutionalized population in Korea. Participants were selected using proportional allocation-systemic sampling with multistage stratification. A standardized interview was conducted in the homes of the participants to collect information on demographic variables, family history, medical history, medication usage, and a variety of other health-related variables. The health interview included an established questionnaire to determine the demographic and socioeconomic characteristics of the subjects including age, education level, occupation, income, marital status, smoking habits, alcohol consumption, exercise, previous and current diseases, and family disease history [17].
- Regular exercise was defined as exercising five or more times per week. Heavy alcohol use was categorized as drinking four or more times per week during the month prior to the interview. Obesity was defined as a body mass index (BMI) ≥25 kg/m2 according to the Asia-Pacific obesity classification [18]. Height and weight were obtained using standardized techniques and equipment. Height was measured to the nearest 0.1 cm using a portable stadiometer (Seriter, Bismarck, ND, USA). Weight was measured to the nearest 0.1 kg using a Giant-150N calibrated balance-beam scale (Hana, Seoul, Korea). BMI was calculated by dividing weight by the square of the height (kg/m2). Systolic and diastolic blood pressure (BP) was measured by standard methods using a sphygmomanometer while the patient was seated. Three measurements were recorded for all subjects at 5-minute intervals, and the average of the second and third measurements was used in the analysis.
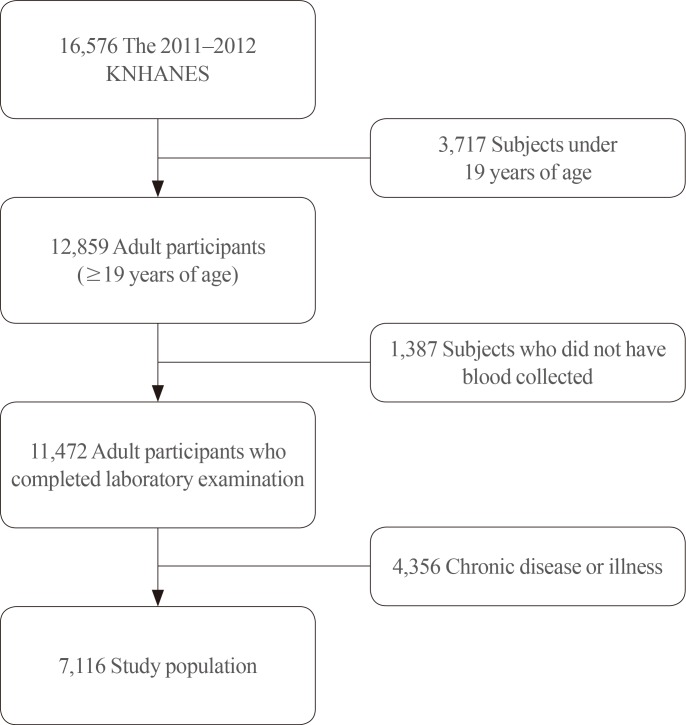
- Among the 16,576 participants who participated in the 2011 to 2012 KNHANES, 3,717 subjects under 19 years of age were excluded. Moreover, 1,387 adults did not have blood collected and were excluded. Participants with chronic disease or taking various medications that could influence even subclinical inflammation and complicate the value of WBC (n=4,356) were also excluded. Exclusion criteria included positivity for hepatitis B virus surface antigen (n=405); prior diagnosed diabetic patients with anti-diabetic medications (n=807), prior diagnosed hypertensive patients with anti-hypertensive medications (n=1,839), or anti-hyperlipidemic medications (n=137); a history of cancer (n=333); an estimated glomerular filtration rate <60 mL/min/1.73 m2 (n=315); or a blood WBC level <4,000/µL to exclude abnormal conditions leading to leukopenia or a blood WBC level >10,000/µL, suggesting clinically significant inflammation (n=1,149). Finally, data from the remaining 7,116 participants were analyzed (Fig. 1). This study included subjects who were diagnosed as hypertension (defined as systolic BP ≥140 mm Hg and/or diastolic BP ≥90 mm Hg) without anti-hypertensive medication and diabetes (defined as a FPG level ≥7.0 mmol/L) without anti-diabetes medication.
- Laboratory methods
- Blood samples were collected in the morning after fasting for at least 8 hours. Total cholesterol, FPG, triglyceride (TG), and high density lipoprotein (HDL) cholesterol levels were measured using a Hitachi Automatic Analyzer 7600 (Hitachi, Tokyo, Japan). HbA1c was measured using high-performance liquid chromatography (HLC-723G7, Tosoh, Tokyo, Japan). WBC were quantified using an automated blood cell counter (ADIVA 120, Bayer, Tarrytown, NY, USA).
- Ethics statement
- This study was approved by the Institutional Review Board of Inje University Ilsan Paik Hospital, Republic of Korea (ISPAIK 2016-06-001). After approval of the study proposal, the KNHANES dataset was made available at the request of the investigator. Because the dataset did not include any personal information and participants' consent had already been given for the KNHANES, our study was exempt from the requirement for participant consent.
- Statistical analyses
- We classified WBC levels into the following four groups. The quartile cut-off points for the WBC level were: first quartile (Q1), 4,000 to 4,990/µL; second quartile (Q2), 4,991 to 5,790/µL; third quartile (Q3), 5,791 to 6,780/µL; and fourth quartile (Q4), 6,781 to 10,000/µL.
- Difference in age according to WBC quartile was evaluated with analysis of variance, and the percentage of females was evaluated with the chi-square test. To compare age- and gender-adjusted demographics and clinical characteristics according to WBC quartile, analysis of covariance (ANCOVA) and the Bonferroni post hoc test were used. General linear models were used to assess HbA1c levels and the proportion (%) of HbA1c levels of ≥5.7%, ≥6.1%, and ≥6.5% according to WBC quartile before (Model 1) and after (Models 2, 3, and 4) adjustment for confounders. Age (years), gender (men/women), and FPG level (mmol/L) were adjusted in Model 2. Model 3 adjusted for college graduation, smoking history (never, past, or current), waist circumference, presence of hypertension, serum total cholesterol, serum TG, presence of anemia (defined in accordance with the World Health Organization criteria: hemoglobin <13 g/dL in men and <12 g/dL in women), age, gender, and FPG level. Adjustment for confounding factors in Model 3 was performed after exclusion of FPG ≥126 mg/dL in Model 4. A logistic regression analysis was used to evaluate the odds ratios (ORs) of the WBC quartile for HbA1c levels of ≥5.7%, ≥6.1%, and ≥6.5% treating age, gender, FPG, college graduation, smoking history, waist circumference, presence of hypertension, serum total cholesterol, serum TG, and presence of anemia as covariates.
- The HbA1c cut-off value of 6.1% was selected because a recent Korean study showed that an HbA1c cut-off level of 6.1% was the optimal value for diagnosing diabetes, with the criteria of an FPG level of ≥7.0 mmol/L and/or a 2-hour FPG level of ≥11.1 mmol/L on the 75-g OGTT (63.8% sensitivity, 88.1% specificity) [19]. An HbA1c threshold of 5.7% had reasonable sensitivity (48.6%) and specificity (65.7%) for the identification of prediabetes [19].
- All tests were two-sided, and P values <0.05 were considered to indicate statistical significance. Statistical analyses were performed using SPSS software version 21.0 for Windows (IBM Co., Armonk, NY, USA).
METHODS
- Demographic and clinical characteristics of the study population
- The demographic and clinical characteristics of the study population are shown in Table 1. The median (range) age of the population was 44 years (range, 19 to 92), and 56.1% of the participants were female. The median (range) level of WBCs was 5,790/µL (range, 4,000 to 10,000). The mean HbA1c and FPG levels were 5.59% and 94.1 mg/dL, respectively. The percentages of subjects with HbA1c levels ≥5.7%, ≥6.1%, and ≥6.5% were 35.2%, 9.7%, and 3.6%, respectively.
- Age- and gender-adjusted demographic and clinical characteristics according to WBC quartile
- Table 2 presents age- and gender-adjusted clinical characteristics according to WBC quartile (Q1, 4,000 to 4,990/µL; Q2, 4,991 to 5,790/µL; Q3, 5,791 to 6,780/µL; and Q4, 6,781 to 10,000/µL). Age (Q1, 46.4±0.4 years vs. Q4, 43.9±0.4 years, P<0.001) and the percentage of women (Q1, 69.0% vs. Q4, 43.7%, P<0.001) tended to decrease with increased WBC quartile (P<0.001). There was a significant positive relationship between WBC and HbA1c levels (5.5%±0.1%, 5.6%±0.1%, 5.6%±0.1%, and 5.7%±0.1%, P<0.001), FPG level (92.5±0.4, 93.5±0.4, 94.5±0.4, and 95.8±0.4 mg/dL, P<0.001), the prevalence of impaired fasting glucose (100≤ FPG ≤125 mg/dL: 15.0%±0.9%, 17.6%±0.9%, 18.7%±0.9%, and 20.3%±0.9%, P<0.001), and the prevalence of diabetes (2.6%±0.5%, 3.2%±0.5%, 5.6%±0.6%, and 6.4%±0.5%, P<0.001). Systolic BP (Q1, 114.8±0.3 mm Hg vs. Q4, 117.1±0.3 mm Hg, P<0.001), diastolic BP (Q1, 75.0±0.2 mm Hg vs. Q4, 76.2±0.2 mm Hg, P<0.001), and the prevalence of hypertension (Q1, 10.9%±0.8% vs. Q4, 16.9%±0.8%, P<0.001) also showed significant trends across the four WBC groups. Serum total cholesterol (Q1, 186.5±0.8 mg/dL vs. Q4, 197.1±0.8 mg/dL, P<0.001), TG levels (Q1, 107.7±2.5 mg/dL vs. Q4, 155.5±2.5 mg/dL, P<0.001), and waist circumference (Q1, 78.2±0.2 cm vs. Q4, 81.6±0.2 cm, P<0.001) all increased with increased WBC quartiles. BMI (Q1, 22.8±0.1 kg/m2 vs. Q4, 23.9±0.1 kg/m2, P<0.001) and the prevalence of obesity (Q1, 23.0%±1.1% vs. Q4, 34.8%±1.1%, P<0.001) also increased with the increase in WBC quartiles. The prevalence of anemia (Q1, 9.5%±0.6% vs. Q4, 5.7%±0.6%, P<0.001) decreased with WBC quartile. Current smoking (Q1, 15.2%±0.9% vs. Q4, 31.8%±0.9%, P<0.001) was positively associated with WBC quartile. However, heavy alcohol drinking showed no association with WBC quartile.
- Adjusted HbA1c (%) according to WBC quartile
- We assessed the adjusted HbA1c levels according to WBC quartile and FPG level (Table 3). Overall, adjusted HbA1c levels increased across WBC quartiles (5.6%±0.1%, 5.6%±0.1%, 5.6%±0.1%, and 5.7%±0.1%, respectively; P<0.001) after adjusting for confounding factors (Models 2, 3).
- Among subjects with a FPG level <100 mg/dL, HbA1c level increased along with WBC quartiles (5.4%±0.1%, 5.5%±0.1%, 5.5%±0.1%, and 5.5%±0.1%, respectively; P<0.001) before (Model 1) and after (Models 2, 3) adjustment for confounders. The adjusted HbA1c level of subjects with a FPG level of 100 to 125 mg/dL also increased along with the increase in WBC quartile (P<0.05, Models 2, 3). In Model 3, the adjusted HbA1c level (5.8%±0.1%) in WBC Q1 was lower than the HbA1c levels (5.9%±0.1%) in Q3 (post hoc analysis, P=0.013) and Q4 (post hoc analysis, P=0.003) of WBC. The HbA1c levels of subjects with a FPG level of ≥126 mg/dL showed a tendency to increase according to WBC quartile, but this tendency did not reach statistical significance.
- Spearman's correlation coefficient between HbA1c and WBC were 0.116, 0.094, and 0.088 in Model 1 to 3, respectively (P<0.001).
- The proportions (%) of HbA1c levels of ≥5.7%, ≥6.1%, and ≥6.5% according to WBC quartile
- The proportions (%) of subjects with HbA1c levels of ≥5.7%, ≥6.1%, and ≥6.5% are shown in Table 4 according to WBC quartile. The adjusted proportions (%) of an HbA1c level of ≥5.7% increased across the WBC quartiles (29.0%±1.0%, 32.1%±1.0%, 34.8%±1.0%, and 37.9%±1.0%, respectively in Model 4; P<0.001). The adjusted proportions (%) of an HbA1c level of ≥6.1% also increased along the WBC quartiles (5.7%±0.6%, 7.1%±0.6%, 8.0%±0.6%, and 8.9%±0.6%, respectively in Model 4; P=0.001). The adjusted proportion of an HbA1c level of ≥6.5% showed a significant trend across the WBC quartiles (1.1%±0.3%, 1.2%±0.3%, 1.9%±0.3%, and 2.0%±0.3%, respectively in Model 4; P=0.045) after adjusting for confounders.
- ORs of WBCs for the risks of HbA1c levels of ≥5.7%, ≥6.1%, and ≥6.5%
- We performed logistic regression analyses of WBC quartiles for the risks of HbA1c levels of ≥5.7%, ≥6.1%, and ≥6.5% using age, gender, FPG, college graduation, smoking history, presence of hypertension, serum total cholesterol, serum TG, and the presence of anemia as covariates. The ORs of WBCs for HbA1c levels of ≥5.7%, ≥6.1%, and ≥6.5% are shown in Table 5. Using Q1 of WBCs as the reference, Q2 to Q4 of WBCs were associated with HbA1c levels of ≥5.7%, the current cutoff value for abnormal glucose regulation. For the HbA1c level of ≥6.1%, using WBC Q1 as the reference, WBC Q3 and Q4 showed increased risks, by 48% (P=0.012) and 78% (P<0.001), respectively. For the HbA1c level of ≥6.5%, using WBC Q1 as the reference, the OR of WBC Q4 was 2.03 (95% confidence interval, 1.13 to 3.64; P=0.018).
RESULTS
- Because HbA1c is formed by glycation of the N-terminal valine residue of the β-chain of hemoglobin, many conditions that affects red blood cells, such as hemolytic anemia, structural hemoglobinopathies, major blood loss, and blood transfusions, influence HbA1c levels and do so independent of glycemia [1]. However, the association between WBCs and HbA1c has received little attention.
- Based on the KNHANES 2011 to 2012 data on the general adult population of Korea, we found that a higher WBC level within the normal range slightly was associated with increased the HbA1c level, and that it was so independently of the FPG level, even after adjusting for several confounding factors. This finding occurred both in the normoglycemic range with an FPG level of <100 mg/dL and in the prediabetic range with an FPG level of 100 to 125 mg/dL.
- There have been a few studies showing an association between WBCs and HbA1c in subjects without diabetes. Jiang et al. [20] reported that HbA1c was independently correlated with WBC count within the normal range in subjects with and without diabetes in a large Chinese population. Gustavsson and Agardh [14] showed that WBC count was independently correlated with HbA1c in non-diabetic acute coronary syndrome patients. A study using data from the US National Health and Nutrition Examination Survey also showed that polymorphonuclear leukocyte and monocyte counts independently predicted the hemoglobin glycation index in non-diabetic adults [9]. However, these studies did not assess the association of high WBC levels and HbA1c levels, especially as a diagnostic parameter for diabetes or prediabetes.
- This study demonstrated that a higher WBC level, even within the normal range, was associated with the HbA1c distribution, with higher proportions of HbA1c levels ≥5.7% and ≥6.5%. Subjects in the Q4 of WBCs were about twice as likely to have diabetes as were those in the Q1 of WBC, using a diagnostic cut-off value of HbA1c ≥6.5%. This result suggests that WBC levels, even within the normal range, need to be taken into account when using HbA1c levels to screen pre-diabetes or diabetes. Thus, measuring FPG or performing the OGTT should be considered when diagnosing diabetes or prediabetes in patients in the upper normal range of WBCs and close to the diagnostic threshold of HbA1c level.
- Although the mechanisms leading to increased HbA1c levels in patients with higher WBC levels even without diabetes remain unclear, insulin resistance has been suggested to have a role. Over the last decade, it has become increasingly evident that inflammation is a major component of insulin resistance [21]. Activation of proinflammatory signaling pathways that promote the differentiation and maturation of WBCs are involved in the pathogenesis of insulin resistance, via various cytokines and signaling pathways [22]. Furthermore, insulin resistance is commonly accompanied by low-grade systemic inflammation and adipose tissue inflammation [23]. Independent of initial events, the relationship becomes bidirectional in a vicious cycle [24]. Accordingly, higher WBC levels were also positively associated with parameters of insulin resistance syndrome (metabolic syndrome), such as elevated TG level, increased waist circumference, lower HDL level, hypertension, and HbA1c, in this study.
- We consider other potential mechanisms, regardless of inflammation-related glucose dysregulation, because we found the association between WBCs and HbA1c to be independent of the FPG level. Recently, Liu et al. [9] reported that the correlation coefficients for the relationships between the biomarkers of inflammation and HbA1c were higher than were those for such biomarkers and FPG, suggesting that low-grade inflammation influenced variation in HbA1c levels more than did variation in FPG.
- This study has several strengths. First, this is the first large population-based study to investigate the clinical association of WBC levels and HbA1c level as a screening parameter for diabetes or prediabetes. Second, patients with diabetes not currently taking anti-diabetes medications were included in this study, which differentiates it from the study populations in previous studies. This allowed us to assess the association between WBC levels and the HbA1c distribution. Although the difference in HbA1c between subgroups of WBC quartiles was relatively small, subjects with HbA1c around 5.7% (the current cutoff value for abnormal glucose regulation criteria) and 6.5% (the diagnostic cut-off point for diabetes) can be categorized as prediabetes and diabetes or not, respectively, according to WBC level.
- This study also had some limitations. First, because this was not a prospective observational study, we could not confirm any inferences regarding causality due to the cross-sectional design of the study. Second, we analyzed after adjusting for only FPG level, not including random glucose level or postprandial glucose level as confounding factors. Thus it is still uncertain whether the association between WBC level and HbA1c is mediated through elevated glucose levels caused by subclinical inflammation. Unfortunately, we could not evaluate the more accurate inflammatory marker, such as hs-CRP, reflecting subclinical inflammation, because KNHANES do not include these data.
- In conclusion, HbA1c levels were positively associated with WBC levels in subjects with and without diabetes in a general adult population.
DISCUSSION
-
CONFLICTS OF INTEREST: No potential conflict of interest relevant to this article was reported.
-
AUTHOR CONTRIBUTIONS: Conception or design: J.H.M. Acquisition, analysis, or interpretation of data: J.H.M., J.E.L., K.M.K., T.J.O. Drafting the work or revising: J.H.M., J.E.L., D.H.L., S.H.C., S.L., Y.J.P., D.J.P., H.C.J. Final approval of the manuscript: J.H.M., J.E.L.
Article information
- 1. Gillett MJ. International Expert Committee report on the role of the A1c assay in the diagnosis of diabetes: diabetes care 2009;32(7):1327-1334. Clin Biochem Rev 2009;30:197–200. PubMedPMC
- 2. American Diabetes Association. Diagnosis and classification of diabetes mellitus. Diabetes Care 2014;37(Suppl 1):S81–S90. ArticlePubMed
- 3. Wolffenbuttel BH, Herman WH, Gross JL, Dharmalingam M, Jiang HH, Hardin DS. Ethnic differences in glycemic markers in patients with type 2 diabetes. Diabetes Care 2013;36:2931–2936. ArticlePubMedPMC
- 4. Gallagher EJ, Le Roith D, Bloomgarden Z. Review of hemoglobin A(1c) in the management of diabetes. J Diabetes 2009;1:9–17. ArticlePubMed
- 5. Herman WH, Ma Y, Uwaifo G, Haffner S, Kahn SE, Horton ES, et al. Differences in A1C by race and ethnicity among patients with impaired glucose tolerance in the Diabetes Prevention Program. Diabetes Care 2007;30:2453–2457. ArticlePubMedPMC
- 6. Ahmad J, Rafat D. HbA1c and iron deficiency: a review. Diabetes Metab Syndr 2013;7:118–122. ArticlePubMed
- 7. Pani LN, Korenda L, Meigs JB, Driver C, Chamany S, Fox CS, et al. Effect of aging on A1C levels in individuals without diabetes: evidence from the Framingham Offspring Study and the National Health and Nutrition Examination Survey 2001-2004. Diabetes Care 2008;31:1991–1996. ArticlePubMedPMC
- 8. Soulimane S, Simon D, Herman WH, Lange C, Lee CM, Colagiuri S, et al. HbA1c, fasting and 2 h plasma glucose in current, ex- and never-smokers: a meta-analysis. Diabetologia 2014;57:30–39. ArticlePubMedPDF
- 9. Liu S, Hempe JM, McCarter RJ, Li S, Fonseca VA. Association between inflammation and biological variation in hemoglobin A1c in US nondiabetic adults. J Clin Endocrinol Metab 2015;100:2364–2371. ArticlePubMedPMC
- 10. Wu T, Dorn JP, Donahue RP, Sempos CT, Trevisan M. Associations of serum C-reactive protein with fasting insulin, glucose, and glycosylated hemoglobin: the Third National Health and Nutrition Examination Survey, 1988-1994. Am J Epidemiol 2002;155:65–71. ArticlePubMedPDF
- 11. Donath MY. Targeting inflammation in the treatment of type 2 diabetes. Diabetes Obes Metab 2013;15(Suppl 3):193–196.Article
- 12. Ridker PM, Howard CP, Walter V, Everett B, Libby P, Hensen J, et al. Effects of interleukin-1β inhibition with canakinumab on hemoglobin A1c, lipids, C-reactive protein, interleukin-6, and fibrinogen: a phase IIb randomized, placebo-controlled trial. Circulation 2012;126:2739–2748. ArticlePubMed
- 13. Gustavsson CG, Agardh CD. Markers of inflammation in patients with coronary artery disease are also associated with glycosylated haemoglobin A1c within the normal range. Eur Heart J 2004;25:2120–2124. ArticlePubMedPDF
- 14. Gustavsson CG, Agardh CD. Inflammatory activity increases with haemoglobin A1c in patients with acute coronary syndrome. Scand Cardiovasc J 2009;43:380–385. ArticlePubMed
- 15. Kluppelholz B, Thorand B, Koenig W, de Las Heras Gala T, Meisinger C, Huth C, et al. Association of subclinical inflammation with deterioration of glycaemia before the diagnosis of type 2 diabetes: the KORA S4/F4 study. Diabetologia 2015;58:2269–2277. ArticlePubMedPDF
- 16. Korea Centers for Disease Control and Prevention. Korea National Health and Nutrition Examination Survey 2011-2012 [Internet]; Cheongju: KCDC; c2012. cited 2017 Dec 31. Available from: https://knhanes.cdc.go.kr/knhanes/index.do.
- 17. Kweon S, Kim Y, Jang MJ, Kim Y, Kim K, Choi S, et al. Data resource profile: the Korea National Health and Nutrition Examination Survey (KNHANES). Int J Epidemiol 2014;43:69–77. ArticlePubMedPMCPDF
- 18. WHO Expert Consultation. Appropriate body-mass index for Asian populations and its implications for policy and intervention strategies. Lancet 2004;363:157–163. ArticlePubMed
- 19. Lee H, Oh JY, Sung YA, Kim DJ, Kim SH, Kim SG, et al. Optimal hemoglobin A1c cutoff value for diagnosing type 2 diabetes mellitus in Korean adults. Diabetes Res Clin Pract 2013;99:231–236. ArticlePubMed
- 20. Jiang H, Yan WH, Li CJ, Wang AP, Dou JT, Mu YM. Elevated white blood cell count is associated with higher risk of glucose metabolism disorders in middle-aged and elderly Chinese people. Int J Environ Res Public Health 2014;11:5497–5509. ArticlePubMedPMC
- 21. Bastard JP, Maachi M, Lagathu C, Kim MJ, Caron M, Vidal H, et al. Recent advances in the relationship between obesity, inflammation, and insulin resistance. Eur Cytokine Netw 2006;17:4–12. PubMed
- 22. Chen L, Chen R, Wang H, Liang F. Mechanisms linking inflammation to insulin resistance. Int J Endocrinol 2015;2015:508409ArticlePubMedPMCPDF
- 23. Wieser V, Moschen AR, Tilg H. Inflammation, cytokines and insulin resistance: a clinical perspective. Arch Immunol Ther Exp (Warsz) 2013;61:119–125. ArticlePubMedPDF
- 24. de Luca C, Olefsky JM. Inflammation and insulin resistance. FEBS Lett 2008;582:97–105. ArticlePubMed
References
Participants disposition to be included in this study. KNHANES, Korea National Health and Nutrition Examination Survey.
Demographic and Clinical Characteristics of Korean Population, Aged 19 Years and Older, in 2011 to 2012 Korea National Health and Nutrition Examination Survey
Values are expressed as median (range) or mean±SEM.
HDL-C, high density lipoprotein cholesterol; HbA1c, hemoglobin A1c; FPG, fasting plasma glucose; eGFR, estimated glomerular filtration rate.
aHeavy alcohol drinking ≥×4 alcoholic drinks/week; bRegular exercise ≥×5 exercise/week; cBody mass index ≥25 kg/m2; dSystolic blood pressure ≥140 mm Hg without anti-hypertensive medication; eDiastolic blood pressure ≥90 mm Hg without anti-hypertensive medication; fFasting plasma glucose ≥126 mg/dL without anti-diabetes medication; gHemoglobin <13 g/dL in men and <12 g/dL in women.
Age, Sex, and Age- and Sex-Adjusted Demographic and Clinical Characteristics According to the Quartile of WBC Level
Values are expressed as mean±SEM.
WBC, white blood cell; BP, blood pressure; HDL-C, high density lipoprotein cholesterol; FPG, fasting plasma glucose; HbA1c, hemoglobin A1c; eGFR, estimated glomerular filtration rate.
aHeavy alcohol drinking ≥×4 alcoholic drinks/week; bRegular exercise ≥×5 exercise/week; cBody mass index ≥25 kg/m2; dSystolic BP ≥140 mm Hg without anti-hypertensive medication; eDiastolic BP ≥90 mm Hg without anti-hypertensive medication; fFPG ≥126 mg/dL without anti-diabetes medication; gHemoglobin <13 g/dL in men and <12 g/dL in women.
Hemoglobin A1c (%) According to the Quartile of WBC Level
Values are expressed as mean±SEM.
WBC, white blood cell; FPG, fasting plasma glucose.
aModel 1: unadjusted; bModel 2: adjusted for age, sex, and FPG; cModel 3: adjusted for college graduation, smoking history (never, past, and current smoking), waist circumference, the presence of hypertension, serum total cholesterol, serum triglyceride, the presence of anemia, and variables in model 2; dModel 4, model 3 after exclusion of FPG ≥126 mg/dL (n=204).
The Proportions of HbA1c ≥5.7%, ≥6.1%, and ≥6.5% (%) According to the Quartile of WBC Level
Values are expressed as mean±SEM.
HbA1c, hemoglobin A1c; WBC, white blood cell.
aModel 1: unadjusted; bModel 2: adjusted for age, sex, and fasting plasma glucose (FPG); cModel 3: adjusted for college graduation, smoking history (never, past, and current smoking), waist circumference, the presence of hypertension, serum total cholesterol, serum triglyceride, the presence of anemia, and variables in model 2; dModel 4, model 3 after exclusion of FPG ≥126 mg/dL (n=204).
ORs of White Blood Cell Quartiles for the Risks of HbA1c Levels of ≥5.7%, ≥6.1%, and ≥6.5%
Covariates: age, sex, and fasting plasma glucose, college graduation, smoking history (never, past, and current smoking), waist circumference, the presence of hypertension, serum total cholesterol, serum triglyceride, the presence of anemia.
OR, odds ratio; HbA1c, hemoglobin A1c; CI, confidence interval.
Figure & Data
References
Citations
- Vitamin D supplementation modulates glycated hemoglobin (HBA1c) in diabetes mellitus
Asma Akhter, Sultan Alouffi, Uzma Shahab, Rihab Akasha, Mohd Fazal-Ur-Rehman, Mohamed E. Ghoniem, Naved Ahmad, Kirtanjot Kaur, Ramendra Pati Pandey, Ahmed Alshammari, Firoz Akhter, Saheem Ahmad
Archives of Biochemistry and Biophysics.2024; 753: 109911. CrossRef - Glucose indices as inflammatory markers in children with acute surgical abdomen: a cross-sectional study
Hoda Atef Abdelsattar Ibrahim, Sherif Kaddah, Sara Mohamed Elkhateeb, Abeer Aboalazayem, Aya Ahmed Amin, Mahmoud Marei Marei
Annals of Medicine.2023;[Epub] CrossRef - Factors associated with relative muscle strength in patients with type 2 diabetes mellitus
Chiao-Nan Chen, Ting-Chung Chen, Shiow-Chwen Tsai, Chii-Min Hwu
Archives of Gerontology and Geriatrics.2021; 95: 104384. CrossRef - Non-vascular contributing factors of diabetic foot ulcer severity in national referral hospital of Indonesia
Em Yunir, Dicky L. Tahapary, Tri Juli Edi Tarigan, Dante Saksono Harbuwono, Yoga Dwi Oktavianda, Melly Kristanti, Eni Iswati, Angela Sarumpaet, Pradana Soewondo
Journal of Diabetes & Metabolic Disorders.2021; 20(1): 805. CrossRef - Association between Inflammatory Markers and Glycemic Control in Korean Diabetic Patients
Min Kang, Seok-Joon Sohn
Journal of Health Informatics and Statistics.2021; 46(3): 247. CrossRef - Prediabetes Is Independently Associated with Subclinical Carotid Atherosclerosis: An Observational Study in a Non-Urban Mediterranean Population
Maria Belén Vilanova, Josep Franch-Nadal, Mireia Falguera, Josep Ramon Marsal, Sílvia Canivell, Esther Rubinat, Neus Miró, Àngels Molló, Manel Mata-Cases, Mònica Gratacòs, Esmeralda Castelblanco, Dídac Mauricio
Journal of Clinical Medicine.2020; 9(7): 2139. CrossRef
 PubReader
 ePub Link
 Cite
Cite

