Associations of Metabolic Syndrome with Total Testosterone and Homocysteine Levels in Male Korean Workers
Article information

Abstract
Background
Low testosterone is associated with metabolic syndrome (MetS), and homocysteine (Hcy) is elevated in individuals with MetS. We investigated the relationships of total testosterone (TT) and serum Hcy levels with MetS in male Korean workers.
Methods
We conducted a cross-sectional study including 8,606 male workers, aged 20 to 58 years, who underwent a physical examination in 2015. MetS was diagnosed based on the criteria of the 2009 harmonized definition, while the Korean standard for waist circumference (WC) was used. Participants' biochemical parameters, including TT and serum Hcy, were measured, and participants were divided into quartiles. Multiple logistic regression models were used to estimate the association of MetS and its individual components depending on TT and serum Hcy quartiles.
Results
The prevalence of MetS in the study population was 16%. TT was lower in participants with MetS than in those without MetS (P<0.001). By contrast, Hcy level was similar between groups (P=0.694). In multiple logistic regression analysis, the odds ratio for the lowest TT quartile was 1.29 (95% confidence interval, 1.06 to 1.57) after adjusting for potential confounders. Participants with lower TT were more likely to have high WC, hypertriglyceridemia, and low high density lipoprotein levels. Serum Hcy levels were not significantly associated with MetS. Of the five components of MetS, only WC was significantly associated with serum Hcy.
Conclusion
In male Korean workers, TT may be an independent predictor of MetS, and serum Hcy levels could be a marker of abdominal obesity. However, future prospective studies are needed.
INTRODUCTION
The prevalence of metabolic syndrome (MetS) has increased worldwide in recent decades and has become an important public health problem globally. In Korea, the prevalence of MetS increased from an age-standardized rate of 24.9% in 1998 to 31.3% in 2007 [1]. MetS is diagnosed when a patient has a cluster of cardiovascular risk factors, including abdominal obesity, hypertriglyceridemia, low high density lipoprotein cholesterol (HDL-C) levels, hyperglycemia, and hypertension. MetS patients are at an elevated risk of cardiovascular disease (CVD) and type 2 diabetes mellitus (DM) [2].
Several epidemiological studies have linked low total testosterone (TT) level to MetS [345]. Some prospective studies have demonstrated that low TT levels predict MetS development [67]. Furthermore, both cross-sectional and longitudinal studies have reported that low TT levels are associated with increased fat deposition, resulting in insulin resistance and abdominal obesity [89]. This bidirectional relationship leads to the development of MetS, as well as type 2 DM and CVD [10].
Homocysteine (Hcy) is involved in the metabolism of methionine as a sulfur-containing amino acid. Hyperhomocysteinemia is an independent risk factor for atherosclerosis and is induced by endothelial dysfunction, smooth muscle cell proliferation, oxidative stress, and hemostasis [11]. Thus, it can cause CVD and cerebrovascular disease [12]. Hyperhomocysteinemia is also associated with insulin resistance and MetS, although some studies have reported conflicting findings [1314].
The relationship between MetS and TT or serum Hcy levels has been studied in different populations worldwide. It is necessary to study larger populations with diverse characteristics. In this study, we investigated whether TT and serum Hcy levels were associated with MetS and metabolic components and whether they could be used as predictors of MetS among male Korean workers, as a population different from those investigated in previous studies.
METHODS
Subjects
This cross-sectional study enrolled male Korean industrial workers who underwent an annual health check-up in 2015. The study population included 8,769 men aged 20 to 58 years. From this population, individuals who were taking testosterone or steroidal agents that could affect serum testosterone level or who had neoplastic, severe liver, or renal disease were excluded. A total of 8,606 men were included in this analysis. The study was approved by the Institutional Review Board of Hanil Hospital, Seoul, Korea (2014-H-001), and written informed consent was obtained from each participant.
Measurements
Participants fasted for at least 8 hours before the study. Body weight, height, and blood pressure (BP) were measured using standard techniques. Body mass index (BMI) was calculated as weight (kg) divided by height squared (m2). Waist circumference (WC) was measured at the level midway between the lowest rib and the iliac crest. Fasting blood samples were collected from the antecubital vein and analyzed biochemically and immunologically using a Cobas c702 module (Cobas, Roche Diagnostics, Basel, Switzerland). Fasting plasma glucose (FPG) levels were measured using an enzymatic reference method with hexokinase. Triglyceride (TG) and uric acid (UA) levels were measured using an enzymatic colorimetric method. Low density lipoprotein cholesterol (LDL-C) and HDL-C levels were assessed using a homogeneous, enzymatic, colorimetric assay. Serum creatinine levels were measured using a kinetic colorimetric assay. Serum high-sensitivity C-reactive protein (hs-CRP) levels were assayed by particle-enhanced immunoturbidimetry. TT levels were measured by a radioimmunoassay using DIAsource TESTO-RIA-CT Kits (DIAsource ImmunoAssays S.A., Louvain-la-Neuve, Belgium); the intra-assay coefficient of variance (CV) was 3.3% to 4.6%, and the inter-assay CV was 4.8% to 6.2%. Liquid stable 2-part homocysteine reagent kits and an Axis-Shield Calibrator (Axis-Shield Diagnostics Ltd., Dundee, Scotland United Kingdom) were used to determine serum Hcy levels. The intra-assay and inter-assay CV was 1.3% to 2.1% and 1.1% to 1.3%, respectively. Insulin levels were measured using [125I] immunoradiometric assay (IRMA) Kits. Homeostasis model assessment of insulin resistance (HOMA-IR) was calculated using the following equation: [glucose (mg/dL)×insulin (µU/mL)]/405. All participants completed a questionnaire on health-related behavior. Behavioral risk factors included smoking status (non-smoker, former smoker, or current smoker), alcohol consumption (non-drinker or drinker; drinkers defined as those who consumed alcohol more than once a week), and exercise. Exercise was defined as above recommended physical activity (PA) if an individual engaged in moderately intense aerobic PA (e.g., badminton or ping-pong) for at least 20 minutes for 5 days a week; vigorously intense activity (e.g., running or mountain climbing) for at least 20 minutes 4 days a week; or walking for 20 minutes every day. Less intense levels of exercise were considered to be below recommended PA.
Definition of MetS
We defined MetS using criteria based on the 2009 harmonized definition [15]. A diagnosis of MetS was made if three of the following criteria were met: (1) WC ≥90 cm; (2) TG ≥150 mg/dL or receiving medical treatment for elevated TG levels; (3) HDL-C <40 mg/dL; (4) BP ≥130/85 mm Hg or current use of anti-hypertensive medications; (5) FPG ≥100 mg/dL or receiving treatment for previously diagnosed type 2 DM. The WC cut-off was set in accordance with the ethnically appropriate abdominal obesity criteria for Koreans as put forth by the Korean Society for the Study of Obesity [16].
Statistical analysis
The characteristics of participants are summarized as mean±standard deviation for continuous variables or as frequencies and percentages for categorical variables. Comparisons of participants with and without MetS were performed using the Student t tests for continuous variables and the chi-square test for categorical variables. Pearson correlation analysis was applied to evaluate the correlations between TT or serum Hcy level and continuous variables, and Spearman rank correlation analysis was used for categorical variables. Participants were divided into quartiles based on their TT level (Q1, ≤5.08 ng/mL; Q2, 5.09 to 6.23 ng/mL; Q3, 6.24 to 7.64 ng/mL; and Q4, ≥7.65 ng/mL) and serum Hcy level (Q1, ≥12.21 µmol/L; Q2, 10.51 to 12.10 µmol/L; Q3, 9.11 to 10.50 µmol/L; and Q4, ≤9.10 µmol/L). The effects of TT and serum Hcy quartile were tested using analysis of variance (ANOVA) for continuous variables and the Kruskal-Wallis test for dichotomous variables. We also performed multiple logistic regression analyses to evaluate associations between TT and serum Hcy quartiles and the prevalence of MetS. Age, alcohol consumption, smoking status, hs-CRP, HOMA-IR, and BMI were included to investigate the influence of potential confounders. Odds ratios (ORs) and 95% confidence intervals (CIs) were estimated to determine the risk of MetS for each quartile. In addition, we examined the association between TT and serum Hcy quartiles and each MetS component separately. All analyses were conducted using SPSS for Windows version 15.0 (SPSS Inc., Chicago, IL, USA). P values <0.05 were considered statistically significant.
RESULTS
Characteristics of the study population
The clinical characteristics of the study participants are presented in Table 1. The mean age of participants with MetS and without MetS was 45.1±8.2 and 39.9±9.4 years, respectively (P<0.001). The prevalence of MetS in the study population was 16%. TT levels were significantly lower in individuals with MetS than in those without MetS (P<0.001). Serum Hcy levels were not significantly different according to the presence of MetS (P=0.694). However, WC, BMI, BP, FPG, TG, LDL-C, HOMA-IR, hs-CRP, alcohol consumption status, and smoking status were significantly higher in individuals with MetS (P<0.001). There was no significant difference in PA between groups (P=0.097), but HDL-C levels were significantly lower in individuals with MetS (P<0.001).

General Characteristics of Study Participants (n=8,606)
Relationships of clinical characteristics with TT and serum Hcy levels
TT levels were correlated with all variables except smoking status. Serum Hcy levels, in contrast, showed significant correlations only with UA, FPG, LDL-C, and smoking status. Unlike what was observed for TT levels, there was an almost negligible correlation with age. Furthermore, TT and serum Hcy levels showed reciprocally very weak correlations (Table 2). We analyzed clinical characteristics, including the individual components of MetS, depending on TT and serum Hcy quartiles using ANOVA (Table 3). Mean values for age, WC, BMI, BP, FPG, lipid levels, UA levels, hs-CRP, and HOMA-IR increased among lower TT quartiles, except for HDL-C, which exhibited an inverse relationship with TT quartile (P<0.001). Higher serum Hcy quartiles were positively related to WC (P=0.003), systolic BP (P=0.008), UA (P<0.001), and TG (P=0.029). However, unexpectedly, FPG decreased in higher serum Hcy quartiles (P=0.001). The number of MetS components and the prevalence of MetS were higher among participants with lower TT quartiles (P<0.001) (Fig. 1). However, serum Hcy quartile was not significantly related with MetS prevalence (P=0.361).
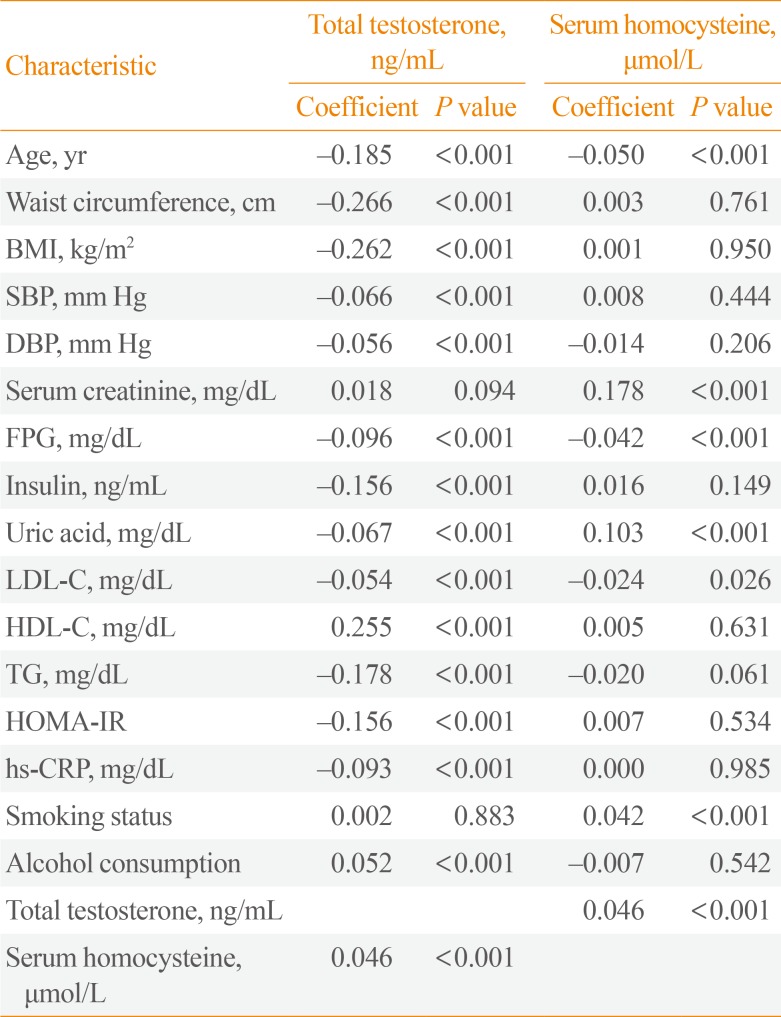
Bivariate Analysis of the Correlations between Total Testosterone, Serum Homocysteine Levels, and Clinical Characteristics
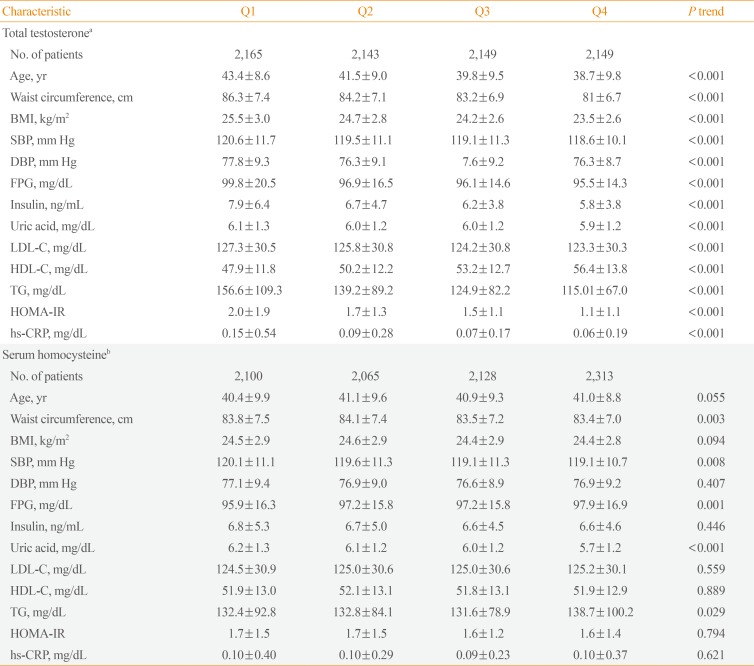
Clinical Characteristics of Participants Based on Total Testosterone and Serum Homocysteine Level Quartiles
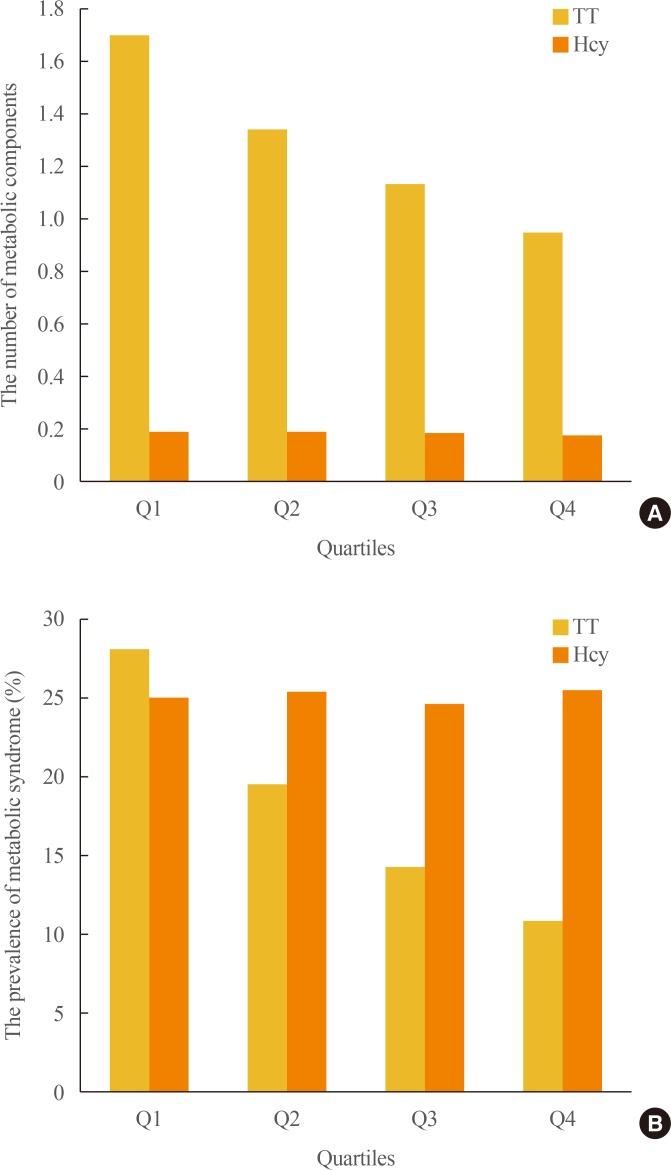
Distribution of the prevalence of metabolic syndrome (MetS) and the number of MetS components depending on total testosterone (TT) and serum homocysteine (Hcy) quartiles in 8,606 male workers. (A) The number of MetS components was significantly different from the first (Q1) to the fourth (Q4) TT quartiles (P<0.001). However, the number of MetS components was not related to serum Hcy quartile (P=0.361). (B) The prevalence of MetS showed similar relationships with TT and serum Hcy quartiles (P<0.001 and P=0.361, respectively).
Associations of MetS with TT and serum Hcy levels
ORs with 95% CIs for the prevalence of MetS depending on TT and serum Hcy quartiles are shown in Table 4. The highest TT and lowest serum Hcy quartiles were used as reference groups. Additive logistic regression models were customized to assess the potential confounding effect of various participant characteristics. The OR for MetS increased among lower TT quartiles. The unadjusted OR for MetS in the lowest TT quartile compared with the highest quartile was 3.18 (95% CI, 2.67 to 3.80) in the crude model (model 1). After adjusting for confounding factors, including age (model 2), alcohol consumption and smoking status (model 3), hs-CRP (model 4), and HOMA-IR (model 5), the ORs for MetS in the lowest TT quartile did not significantly change. However, after adjusting for BMI (model 6), the OR decreased to 1.29 (95% CI, 1.06 to 1.57), which was a weakened but still significant association. By contrast, serum Hcy quartile was not significantly associated with MetS in any model.
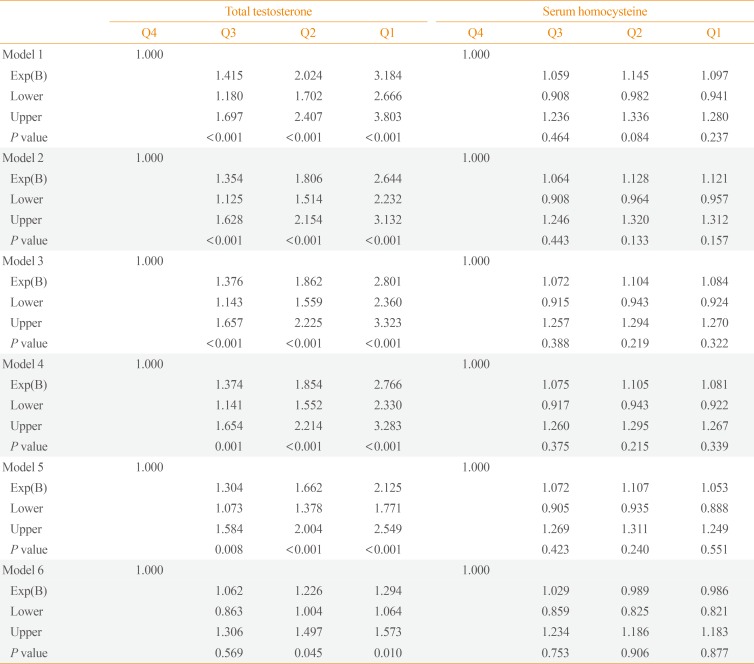
Odds Ratios of Metabolic Syndrome Depending on Total Testosterone and Serum Homocysteine Quartiles
Associations of individual components of MetS with TT and serum Hcy levels
The associations of TT and serum Hcy quartiles with each component of MetS were assessed after adjusting for age, alcohol consumption, smoking status, hs-CRP, and HOMA-IR (Table 5). TT quartile remained significantly associated with high WC, high TG, and low HDL-C levels (P<0.001). However, serum Hcy quartile was only significantly associated with WC (P=0.021). After adjusting for BMI, the associations of TT and serum Hcy quartile with WC were no longer significant (data not shown).

Age-Adjusted Odds Ratios of Metabolic Syndrome Components Depending on Total Testosterone and Serum Homocysteine Quartiles
DISCUSSION
We observed that TT levels were significantly associated with MetS after adjusting for age, alcohol consumption, smoking status, hs-CRP, HOMA-IR, and BMI. In addition, TT levels were associated with the individual MetS components of high WC, hypertriglyceridemia, and low HDL.
The findings of a relationship between TT and MetS, even after adjusting for multiple confounders, are consistent with the results of numerous epidemiological studies. When adjusting for BMI and HOMA-IR, the strength of the associations decreased appreciably but remained significant, suggesting that these factors play a role in the observed associations. Muller et al. [17] found that higher testosterone levels were associated with a reduced risk of MetS independently of insulin level and BMI. A cross-sectional study in Korea reported that TT was negatively associated with the prevalence of MetS independently of BMI [18]. Brand et al. [3] re-analyzed data from 20 observational studies and found that the relationship between TT and MetS prevalence was attenuated, but remained significant, after adjusting for HOMA-IR. Moreover, a prospective study by Laaksonen et al. [7] indicated that low TT independently predicted MetS development in middle-aged men after adjusting for BMI and insulin concentration.
Testosterone is secreted by Leydig cells via the hypothalamic-pituitary-testicular axis. High aromatase activity in adipocytes increases the conversion of testosterone to estradiol and facilitates TG storage in adipocytes, increasing lipoprotein lipase activity [19]. The resulting increase in the size and number of adipocytes leads to insulin resistance. Increased levels of free fatty acids and insulin resistance lead to hypertriglyceridemia and an increased hepatic lipase level [1920]. The level of hepatic lipase determines both the level of HDL-C and its function in reverse cholesterol transport [21]. Additionally, in men with type 2 DM, low HDL-C is associated with TT and the androgen receptor CAG repeat polymorphism [2223]. These findings may provide an explanation for the higher CVD risk in men with lower TT levels. However, the exact mechanism by which testosterone levels affect lipid profiles is still not known.
Considering the individual components of MetS, we observed an inverse relationship between TT and the number of MetS components present. Additionally, MetS components were associated with unfavorable profiles, including increased TG and decreased HDL-C, after fully adjusting for confounding factors. However, the relationship between TT and MetS components, such as hypertension and high glucose, was not significant after adjusting for HOMA-IR. According to previous cross-sectional studies, the associations with TT are strongest for prevalent abdominal obesity and dyslipidemia and weakest for prevalent hypertension [324]. In the present study, we found that insulin resistance mediated hypertension and high glucose levels.
The inverse relationship between TT levels and MetS is consistent across races and ethnicities [24]. In a previous study, Whites were found to have higher correlation than Blacks or Hispanics, but the differences were not significant. As mentioned above, of the MetS components, WC and dyslipidemia showed stronger association with TT levels than other factors. These results have generally been largely consistent across races and ethnicities. Similar patterns have been observed in our study and in other studies in Korea and Japan [1825]. However, the TT levels reported in the other two studies were lower than those found in the present study. This discrepancy is most likely due to differences in the age range of participants. No significant differences in TT levels have been found across racial or ethnic groups, with the exception of a study that found that TT levels in Asians were significantly lower than those of other races in people older than 65 years [2627].
We found that serum Hcy levels were not associated with MetS. However, many studies have reported conflicting results regarding this association. In a longitudinal study of Chinese individuals who underwent a routine health check-up, plasma total Hcy levels were higher in individuals with MetS than in those without MetS, but were not associated with the incidence of MetS [14]. The mean age and Hcy levels were higher in this previous study than in the present study (61.40±11.40 years vs. 40.86±9.41 years and 18.41±8.23 µmol/L vs. 11.26±4.40 µmol/L, respectively). In other studies, serum Hcy has been found to be associated with MetS in individuals with hypertension, obesity, and DM with complications [282930]. However, the participants in our study were generally healthy and received regular health check-ups. In the Iranian general population, there was no significant difference in serum Hcy levels between individuals with or without MetS and no association between serum Hcy levels and MetS [31]. In healthy premenopausal women, plasma Hcy was not associated with insulin resistance or MetS [32]. In terms of racial and ethnic differences, Whites had higher Hcy levels than Blacks and Mexican Americans [33]. This can be attributed to a point mutation in the gene that encodes N5, N10-methylenetetrahydrofolate reductase (MTHFR), because the point mutation in the MTHFR gene is more common in Whites than in Blacks [34]. The C→T substitution at nucleotide 677 results in a thermolabile form with reduced activity that leads to increased Hcy levels. In studies conducted in Canada and England, Hcy levels were significantly higher in South Asians than in Caucasians and East Asians [353637]. Additionally, LDL-C, HDL-C, TG, BMI, diastolic BP, and glucose levels were significantly higher than in other races [36]. This phenomenon is thought to be caused by the vegetarian diet characteristic of religious Hindus or by genetic mutations including MTHFR [3537]. In contrast, East Asians have somewhat lower Hcy levels. Nevertheless, studies in China or Iran have shown no association with MetS [143138]. This discrepancy is presumed to be caused by differences in study design, diet, and genetic mutations. In a cross-sectional study conducted in Korea, there was no association between Hcy levels and MetS, consistent with our results [39]. Therefore, the existence of conflicting reports may have been due to differences among study populations in age, ethnicity, PA, dietary factors, sex, and study design.
In the present study, WC was the only MetS component that was associated with serum Hcy. In a study of a Korean population, the waist-hip ratio was associated with hyperhomocysteinemia [40]. Vaya et al. [41] reported that only the metabolic component of abdominal obesity was associated with Hcy in obese patients, and that abdominal obesity was an independent predictor of hyperhomocysteinemia. However, some studies reported no significant correlation, or an inverse relationship, between abdominal obesity and Hcy [282942]. These discrepancies may have been due to differences in study populations. In the present study, although HOMA-IR and insulin were significantly higher in participants with MetS than in those without MetS, serum Hcy did not differ significantly depending on the presence of MetS and was associated with WC independently of insulin resistance. Several studies show that Hcy levels in healthy individuals are not associated with insulin resistance [324344]. Therefore, serum Hcy levels could serve as a marker of abdominal obesity in generally healthy individuals.
The mechanism underlying the relationship between hyperhomocysteinemia and abdominal obesity is not yet clear. There is an inverse relationship between folate and BMI [4546], leading us to speculate that Hcy levels are increased by reductions in folate and have a proportional relationship with abdominal obesity. In addition, in a study of mice with nonalcoholic fatty liver disease induced by high-calorie food intake, Hcy levels were increased by downregulation of hepatic cystathionine β-synthase and β-lyase, which are involved in the transsulfuration pathway in the liver [47].
We found that FPG was inversely related to serum Hcy levels. Despite the positive association between insulin resistance and Hcy, some research has shown Hcy levels to be lower in healthy individuals with insulin resistance than in the general population and that Hcy levels decreased in response to hyperfiltration of the kidney in the early stage of diabetic nephropathy without severe complications [4849]. Our finding is presumably due to the exclusion of individuals with renal impairment from our study.
Exercise is generally accepted to be a key component of the treatment and prevention of MetS. PA has beneficial effects on BP, WC, and lipid profiles [50]. However, in our study, there was no significant difference in the amount of exercise performed by participants with or without MetS. This finding may be because participants with MetS exercised vigorously or moderately as a means of improving their health through lifestyle modifications.
In this large population-based study, we evaluated the relationships of TT and serum Hcy levels with MetS, including its individual components, after adjusting for multiple potential confounding factors. However, our study has some limitations. First, we could not establish causal relationships because of the cross-sectional study design. Second, our sample cannot be considered representative of the general population, as it included only healthy male workers. Third, the single determination of TT and serum Hcy levels may have resulted in the misclassification of participants. Fourth, the criteria used to define MetS may be different for different ethnic groups. Fifth, dietary factors such as vitamin B12, vitamin B6, and folate, which affect fasting Hcy levels, were not measured or reported.
In conclusion, we suggest that TT is a strong predictor of MetS and that serum Hcy levels could serve as a marker of abdominal obesity. However, further research on the pathogenesis of MetS, including prospective studies, is required.
ACKNOWLEDGMENTS
This study was funded by a grant from the Korea Hydro & Nuclear Power Project (A17LF02).
Notes
CONFLICTS OF INTEREST: No potential conflict of interest relevant to this article was reported.
AUTHOR CONTRIBUTIONS:
Conception or design: S.J.C.
Acquisition, analysis, or interpretation of data: S.H.S., N.H.K., J.K.L.
Drafting the work or revising: S.H.S., S.P.H., S.J.C.
Final approval of the manuscript: S.J.C.