Transcriptome Analysis Identifies an Attenuated Local Immune Response in Invasive Nonfunctioning Pituitary Adenomas
Article information

Abstract
Background
Invasive nonfunctioning pituitary adenomas (NFPAs) remain challenging due to their high complication rate and poor prognosis. We aimed to identify the distinctive molecular signatures of invasive NFPAs, compared with noninvasive NFPAs, using gene expression profiling by RNA sequencing.
Methods
We obtained frozen fresh tissue samples from 14 patients with NFPAs who underwent primary transsphenoidal surgery. Three non-invasive and 11 invasive NFPAs were used for RNA sequencing. The bioinformatics analysis included differential gene expression, gene ontology analysis, and pathway analysis.
Results
A total of 700 genes were differentially expressed (59 up-regulated and 641 down-regulated genes) between invasive and non-invasive NFPAs (false discovery rate <0.1, and |fold change| ≥2). Using the down-regulated genes in invasive NFPAs, gene ontology enrichment analyses and pathway analyses demonstrated that the local immune response was attenuated and that transforming growth factor-β (TGF-β) RII-initiated TGF-β signaling was down-regulated in invasive NFPAs. The overexpression of claudin-9 (CLDN9) and the down-regulation of insulin-like growth factor-binding protein 5 (IGFBP5), death-associated protein kinase 1 (DAPK1), and tissue inhibitor of metalloproteinase-3 (TIMP3) may be related with invasiveness in NFPAs.
Conclusion
Invasive NFPAs harbor different gene expression profiles relative to noninvasive NFPAs. In particular, local suppression of the immune response and TGF-β signaling can make PAs prone to invasiveness.
INTRODUCTION
Nonfunctioning pituitary adenomas (NFPAs) are differentiated from functioning pituitary adenomas (PAs) in that they do not secrete pituitary hormones that cause clinical symptoms. Hence, subjects with NFPAs present with visual impairment due to the large size of these tumors and their location abutting the optic chiasm. Although most PAs are slow-growing and benign intracranial tumors, about 25% to 55% of NFPAs are invasive and infiltrate into neighboring tissues, such as the cavernous sinuses laterally and the sphenoid sinus or bone inferiorly [12]. In invasive PAs, total surgical resection is difficult to achieve owing to the risk of vascular or nerve damage. Moreover, invasive PAs show a higher recurrence rate caused by the tumor remnants, which require additional surgery or radiation, posing a further risk of complications. The definition of invasiveness for PAs has been controversial, and the concept of invasiveness has been confused with aggressiveness and rapid growth. Trouillas et al. [3] proposed a new histopathological classification system distinguishing “invasive” and “proliferative” tumors. In this framework, invasion was defined as histological and/or radiological signs of cavernous or sphenoid sinus invasion [3].
There have been several efforts to establish molecular mechanisms of invasiveness in NFPAs. The overexpression of fibroblast growth factor receptor 4 (FGFR4), matrix metalloproteases (MMPs) and pituitary tumor transforming gene (PTTG) has been established to be related with invasiveness [4]. Hypoxia-inducible factor-1α expression in response to hypoxia or apoplexy may promote angiogenesis via overexpression of vascular endothelial growth factor (VEGF), thereby allowing tumors to acquire invasive abilities [5]. Nonetheless, the whole picture is not clear since the molecular pathogenesis of invasiveness is highly complex, encompassing multiple genes and pathways.
In this study, we aimed to investigate whether invasive NFPAs harbor a distinctive gene expression profile compared with noninvasive NFPAs and to elucidate new mechanisms underlying the invasiveness of NFPAs through whole RNA sequencing.
METHODS
Subjects
This study was approved by the Institutional Review Board of Seoul National University Hospital (IRB no. 1503-040-654). Written informed consent was obtained from all study subjects. We included 14 subjects with clinical NFPAs who underwent primary transsphenoidal surgery and available fresh frozen tumor tissues. Detailed information on the study protocol has been published previously [2]. The tumor tissues were placed in plastic tubes immediately after surgical resection and stored at −80℃ in liquid nitrogen. We obtained magnetic resonance (MR) images of the sella turcica with T1-and T2-weighted spin echo before and after gadolinium-based contrast medium administration in all patients. The maximal tumor size and invasiveness were measured according to preoperative MR imaging according to the Knosp classification system [6]. Invasive PAs were defined by the presence of cavernous sinus or sphenoid sinus invasion on coronal T1-weighted contrast imaging. Based on these criteria, 11 of the 14 subjects were classified as having invasive NFPAs.
Immunohistochemical staining for Ki-67 (MIB-1, Dako, Glostrup, Denmark) was carried out using the Ventana Benchmark XT automated staining system (Ventana Medical Systems, Tucson, AZ, USA). Morphometric analysis of Ki-67 immunostaining was performed in all PAs. The Ki-67 index was calculated as the mean ratio of the number of tumor cells with positive nuclear Ki-67 staining to the total number of tumor cells in the three areas with the highest positive nuclear staining cell ratio.
RNA extraction from tissues
Total RNA was extracted using an RNeasy mini kit from Qiagen (Qiagen, Venlo, the Netherlands), according to the manufacturer's recommendations. RNA quality was evaluated using an Agilent 2100 Bioanalyzer with the Agilent RNA 6000 Nano Kit (Agilent, Santa Clara, CA, USA).
Total RNA sequencing
We used 100 ng of total RNA from all subjects to prepare sequencing libraries by using the TruSeq stranded total RNA sample preparation kit (Illumina, San Diego, CA, USA) which combines RiboZero rRNA depletion with a strand-specific method similar to the deoxyuridine diphosphate method. The quality of these cDNA libraries was evaluated with the Agilent 2100 BioAnalyzer (Agilent). They were quantified with the KAPA library quantification kit (Kapa Biosystems, Wilmington, MA, USA) according to the manufacturer's library quantification protocol. Following cluster amplification of denatured templates, paired-end sequencing progressed (2×100 bp) using the Illumina HiSeq 2500.
RNA-seq data analysis
Sequencing reads were mapped to the human genome (hg19) using STAR [7]. Transcript quantification from the mapped reads and the newly assembled transcripts was performed using HTseq [8]. Fragments per kilobase per million sequenced reads (FPKM)-normalized gene expression were used for the further analysis. Analyses of FPKM data were conducted using iDEP 0.90, using the R package limma [9]. Genes with FPKM values >0.5 in all samples were selected. Genes with a |fold change (FC)| ≥2 and false discovery rate (FDR) for log2-transformed (FPKM+1) <0.1 were considered to be differentially expressed. Gene ontology enrichment analysis and pathway analysis using Reactome 2016 were performed using enrichR [10].
Statistical analysis
Data are shown as mean±standard deviation or number (%). We performed the chi-square test for categorical variables and the Student t test for continuous variables. A P value <0.05 was defined as indicating statistical significance.
RESULTS
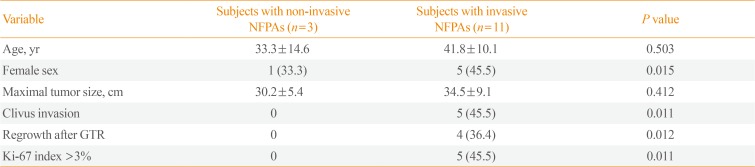
Table 1 showed the clinical, radiological, and pathological characteristics of study subjects with noninvasive and invasive NFPAs. Age was not related with invasiveness, but female sex was more prevalent among the patients with invasive NFPAs. The tumor size was not significantly different between the two groups. The proportion of clivus invasion, regrowth after gross total resection, and a Ki-67 proliferation index >3% was higher in subjects with invasive NFPAs than in those with non-invasive NFPAs.

Clinical, Radiological, and Pathological Characteristics of Study Subjects with Noninvasive and Invasive NFPAs
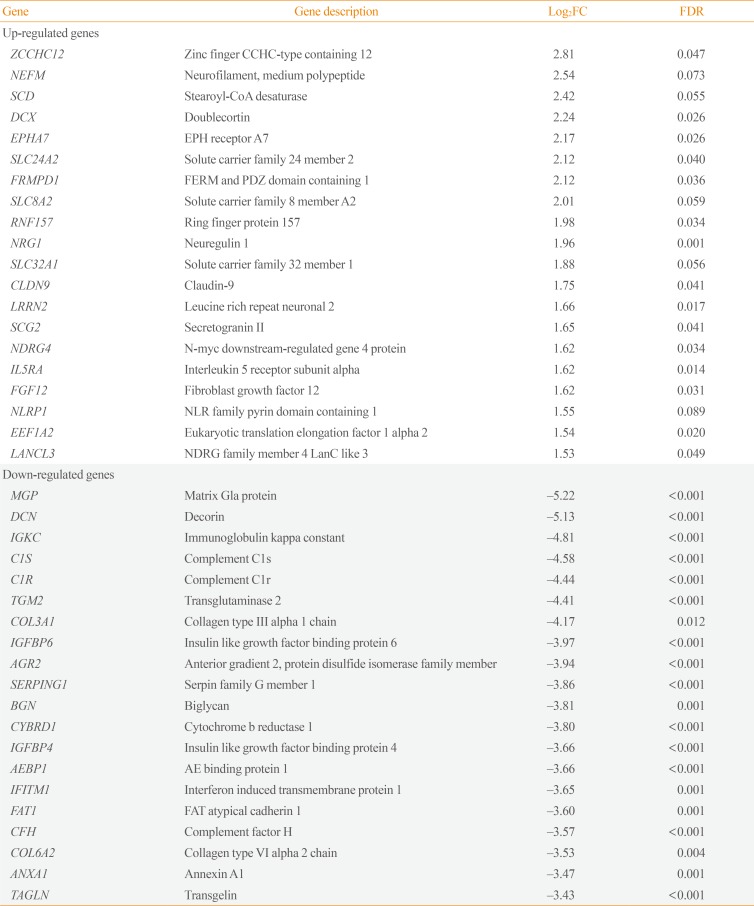
Transcriptome analysis was performed in frozen tissues of three non-invasive and 11 invasive NFPAs. As shown in Fig. 1, hierarchical clustering and principal component analysis indicated the presence of a substantial difference between the two groups. Using the limma package, we identified 700 significantly differentially expressed genes between non-invasive and invasive NFPAs: 59 up-regulated and 641 down-regulated genes (FDR <0.1 and |FC| ≥2). A plot of magnitude and abundance and a scatter plot show the differences in the gene expression profile between the two groups (Fig. 2). Table 2 presents the top 20 differentially expressed genes in invasive NFPAs compared with noninvasive PAs. In Fig. 3, the log-transformed FPKM expression of genes is shown. Immune system-related genes, such as immunoglobulin kappa constant (IGKC), complement C1s (C1S), complement C1r (C1R), interferon induced transmembrane protein 1 (IFITM1), and transforming growth factor-β (TGF-β) signaling-related genes, such as TGFRB2 and TGFB, were down-regulated in invasive NFPAs. Due to the low number of up-regulated genes in invasive NFPAs, further analysis was performed using only down-regulated genes in invasive NFPAs.
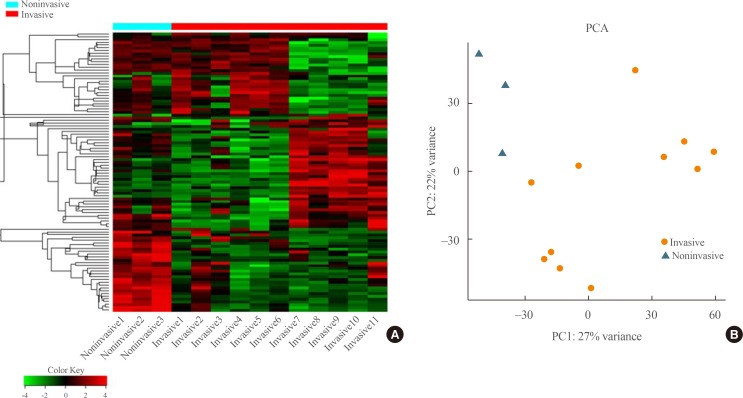
(A) Heatmap showing gene expression profiles by hierarchical clustering. (B) Principal component analysis (PCA) showing the distinction between noninvasive and invasive pituitary adenomas.

(A) A magnitude and abundance (MA) plot and (B) a scatter plot show the different gene expression profiles between the two groups.

The Top 20 Differentially Expressed Genes in Invasive PAs Compared with Noninvasive PAs (|FC|≥2, FDR <0.1)
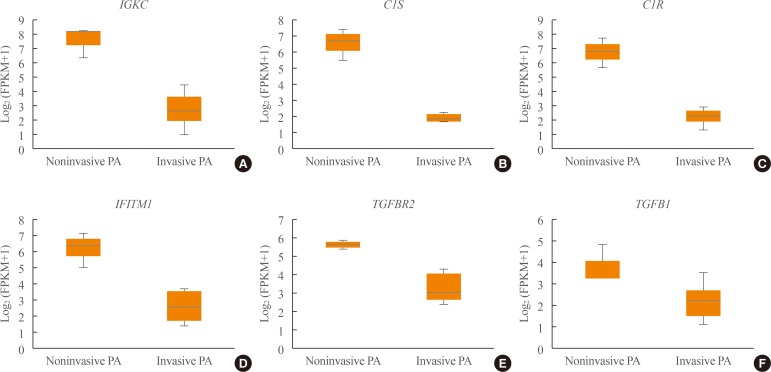
(A–F) Expression of immune response-related genes (immunoglobulin kappa constant [IGKC], complement C1s [C1S], complement C1r [C1R], interferon induced transmembrane protein 1 [IFITM1]) and transforming growth factor-β (TGF-β) signaling-related genes (TGFBR, TGFB1). PA, pituitary adenoma; FPKM, fragments per kilobase per million.
Gene ontology enrichment analysis was performed using the down-regulated genes in invasive NFPAs using enrichR (Table 3). The biological processes of extracellular matrix (ECM) organization, cytokine-mediated signaling, and neutrophil activation involved in the immune response were down-regulated in invasive NFPAs. In terms of molecular function, collagen binding and integrin binding were down-regulated in invasive NFPAs. Within the category of cellular components, focal adhesion and the integral component of the plasma membrane were down-regulated in invasive NFPAs.

Enriched GO Terms of the Down-Regulated Genes in Invasive NFPAs
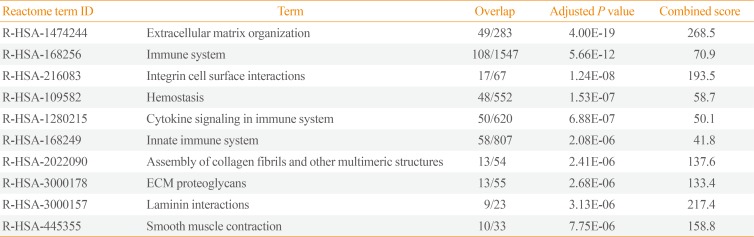
Pathway analysis of the down-regulated genes in invasive NFPAs was conducted using the Reactome 2016 package (Table 4). ECM organization, immune system, integrin cell surface interactions, cytokine signaling in the immune system, innate immune system, assembly of collagen fibrils, and ECM-proteoglycans were down-regulated in invasive NFPAs.

Enriched Pathway Analysis of the Down-Regulated Genes in Invasive PAs Using Reactome 2016
DISCUSSION
In the present study, transcriptome analysis using RNA sequencing revealed that invasive NFPAs expressed different molecular signatures compared with noninvasive NFPAs. In particular, among 700 differentially expressed genes, immune system-related genes were down-regulated in invasive NFPAs.
The down-regulated pathways involved in the immune system, integrin cell surface interactions, cytokine signaling, and innate immune system were the distinctive features of invasive NFPAs. These features of immunosuppression have also been reported in other studies. Richardson et al. showed that silent subtype III PAs may be aggressive due to suppression of the local immune response [11]. The genes arginase-2 (ARG2) and semaphorin 3A (SEMA3A), which are related to T-cell regulation and immunosuppression, were found to be highly expressed in silent subtype III PAs [11]. Through the direct data integration of all published PA-related microarray datasets, Yang et al. [12] discovered that 66 immune-related genes were down-regulated in PAs. They did not investigate the relationship between immune-related genes and invasiveness, but they proposed that immune-related genes may play a role in PA development. Mei et al. [13] directly explored the expression of programmed death ligand 1 in NFPAs, but failed to show any difference in expression according to invasiveness. Yang and Li [5] also suggested that the IP3 pathway and VEGF-induced immune escape might play a role in invasiveness of PAs. Invasive PAs can evade immune surveillance through suppression of the immune response and invade parasellar structures.
We also demonstrated that TGF-β signaling was related with the invasiveness of NFPAs. TGFB1 (TGF-β1) expression was lower in invasive PAs compared with noninvasive PAs in our study (FDR=6.16E-02, log2|FC|=−1.65) (Supplemental Table S1). Zhenye et al. [14] also reported the down-regulation of Smad3, phospho-Smad3, and TGF-β1 expression in invasive PAs [14]. In addition, we demonstrated that the expression of TGFBR2 (TGF-β RII), not TGFBR1, was lower in invasive NFPAs than noninvasive NFPAs (FDR=2.72E-03, log2|FC|=−2.35) (Supplemental Table S1). This finding is compatible with a previous report [15]. TGF-β RII can recruit and phosphorylate TGF-β RI to activate downstream Smad-dependent signaling. Thus, TGF-β RII may play a more pivotal role than TGF-β RI in the development of invasive PAs. Overall, the down-regulation of TGF-β signaling may be involved in the development of invasive NFPAs.
We compared our RNA sequencing analysis results with previous microarray data. Galland et al. [16] suggested that insulin-like growth factor-binding protein 5 (IGFBP5), myosin-Va (MYO5A), FMS-like tyrosine kinase 3 (FLT3), and nuclear factor, erythroid 2 like 1 (NFE2L1) were overexpressed in invasive NFPAs, and that MYO5A was a useful marker of tumor invasiveness. However, there was no significant difference in MYO5A, FLT3, and NFE2L1 expression between the two groups. Instead, IGFBP5 was down-regulated in invasive NFPAs (FDR=0.002, log2|FC|=−3.28) (Supplemental Table S1). IGFBP5 is known to exert anti-cancer activity by inhibiting angiogenesis, which is compatible with our results [17]. Furthermore, drawing on different transcriptome analysis methods, in our study, invasive NFPAs had a higher Ki-67 index than noninvasive NFPAs, whereas in the study of Galland et al. [16], the Ki-67 index was not different between the two groups.
As another microarray-applied study, de Araujo et al. [18] suggested that cyclin D2 (CCND2) and zinc finger protein 676 (ZNF676) were overexpressed, whereas death-associated protein kinase 1 (DAPK1) and tissue inhibitor of metalloproteinase-2 (TIMP2) were down-regulated in invasive corticotropinomas. However, expression of the genes CCND2, ZNF676, and TIMP2 was not significantly different between invasive and noninvasive PAs in our study. Only the gene DAPK1 was down-regulated in invasive PAs (P=0.015, log2|FC|=−1.55, data not shown). DAPK1 codes for death-associated protein kinase 1, which acts as a tumor suppressor, and hypermethylation of the DAPK1 promoter is associated with greater invasiveness in head and neck cancers [19]. Among the inhibitors of the matrix metalloproteinases, tissue inhibitor of metalloproteinase-3 (TIMP3) was down-regulated in invasive NFPAs in our study (FDR=9.39E-03, log2|FC|=−3.00) (Supplemental Table S1). TIMP3 expression in PAs was related with PA fibrosis [20], which may restrain cell proliferation within tumors. Although the subtype of PAs analyzed by de Araujo et al. [18] study was corticotropinomas, invasiveness-related markers can be applied to NFPAs.
Cao et al. [21] also identified dysregulation of leukocyte transendothelial migration and cell adhesion molecules as invasion-related pathways in NFPAs using microarray analyses. The invasion-related genes caludin-7 (CLDN7), contactin associated protein like 2 (CNTNAP2), integrin subunit alpha 6 (ITGA6), junctional adhesion molecule 3 (JAM3), protein tyrosine phosphatase receptor type C (PTPRC), and catenin alpha 1 (CTNNA1) identified by Cao et al. [21] were not validated in our study. Instead, claudin-9 (CLDN9), which is a member of the claudin family, was overexpressed in invasive NFPAs (FDR=4.13E-02, log2|FC|=1.75) (Supplemental Table S1). Higher expression of CLDN9 was also found in invasive pituitary oncocytomas [22]. Claudin-9, which is encoded by CLDN9, may interact with matrix metalloproteinases, weaken the vascular endothelium, and increase paracellular permeability, which results in invasion [22]. The gene JAM2, junctional adhesion molecule 2, was under-expressed in invasive NFPAs (FDR=4.56E-03, log2|FC|=−1.70) (Supplemental Table S1). Down-regulation of JAM2 was correlated with disease progression and metastasis of colorectal cancer [23]. Thus, the overexpression of CLDN9 and the down-regulation of JAM2 may be potential markers of invasive NFPAs.
Transcriptomic research using RNA sequencing to discover markers of invasive NFPAs has scarcely been conducted. Most transcriptome studies of invasive NFPAs have performed microarray analyses. Compared with microarray analyses, RNA-sequencing generates big data regarding the gene expression profile, thereby enabling the discovery of new molecular mechanisms underlying invasiveness in NFPAs. Based on the attenuated local immune response in invasive NFPAs, cancer immunotherapy such as immune checkpoint inhibitors may be another therapeutic option for invasive and unresectable NFPAs.
Several limitations should be mentioned. The sample size was small, especially for noninvasive NFPAs. The unbalanced distribution of the sample size may have led to selection bias. Immunochemistry data were not included. We defined invasive NFPAs in terms of cavernous sinus or sphenoid sinus invasion. However, we could not exclude the possibility of intrinsic invasiveness in tumors that had not yet invaded the cavernous sinus. In addition, we did not validate the significant differentially expressed genes with real-time quantitative reverse transcription polymerase chain reaction or functional studies.
Taken together, invasive NFPAs have different gene expression profiles relative to noninvasive NFPAs. Invasive NFPAs can escape immune attack due to the attenuated local immune response, and express down-regulated TGF-β signaling. However, our findings discovered by RNA-sequencing need to be validated in a large cohort study and with experimental studies.
ACKNOWLEDGMENTS
This study was supported by Hyangseol Young Investigator Award from the Korean Society of Endocrinology, a grant from the Korea Health Industry Development Institute (KHIDI), funded by the Ministry of Health and Welfare (No. HI16C-1111-020016 to Yong Hwy Kim), Republic of Korea and a grant from National Research Foundation of Korea by the Ministry of Science, ICT and Future Planning (MSIP) of Korea (No. NRF-2017R1D1A1B03031879 to Jung Hee Kim).
Notes
CONFLICTS OF INTEREST: No potential conflict of interest relevant to this article was reported.
AUTHOR CONTRIBUTIONS:
Conception or design: Y.H.K., J.H.K.
Acquisition, analysis, or interpretation of data: Y.H.K., J.H.K.
Drafting the work or revising: Y.H.K., J.H.K.
Final approval of the manuscript: Y.H.K., J.H.K.
References
SUPPLEMENTARY MATERIAL
Supplemental Table S1
Differentially Expressed Genes in Invasive NFPAs