
Articles
- Page Path
- HOME > Endocrinol Metab > Volume 34(4); 2019 > Article
-
Original ArticleClinical Study Association between Serum Gamma-Glutamyltransferase and Prevalence of Metabolic Syndrome Using Data from the Korean Genome and Epidemiology Study
-
Mi Young Lee1
 , Dae Sung Hyon2, Ji Hye Huh1, Hae Kyung Kim1, Sul Ki Han1, Jang Young Kim1,3, Sang Baek Koh2,3,4
 -
Endocrinology and Metabolism 2019;34(4):390-397.
DOI: https://doi.org/10.3803/EnM.2019.34.4.390
Published online: December 23, 2019
1Department of Internal Medicine, Yonsei University Wonju College of Medicine, Wonju, Korea.
2Department of Preventive Medicine and Institute of Occupational Medicine, Yonsei University Wonju College of Medicine, Wonju, Korea.
3Institute of Genomic Cohort, Yonsei University Wonju College of Medicine, Wonju, Korea.
4Center for Global Health and Social Medicine, Institute of Poverty Alleviation and International Development, Yonsei University, Seoul, Korea.
- Corresponding author: Sang Baek Koh. Department of Preventive Medicine, Yonsei University Wonju College of Medicine, 20 Ilsan-ro, Wonju 26426, Korea. Tel: +82-33-741-0341, Fax: +82-33-747-0409, kohhj@yonsei.ac.kr
Copyright © 2019 Korean Endocrine Society
This is an Open Access article distributed under the terms of the Creative Commons Attribution Non-Commercial License (http://creativecommons.org/licenses/by-nc/4.0/) which permits unrestricted non-commercial use, distribution, and reproduction in any medium, provided the original work is properly cited.
ABSTRACT
-
Background
- The aim of this study was to determine whether there is a positive correlation between gamma-glutamyltransferase (GGT) levels and the prevalence of metabolic syndrome and whether GGT can be used as an easily checkable metabolic index using data from the large-scale Korean Genome and Epidemiology Study (KoGES).
-
Methods
- We obtained data of 211,725 participants of the KoGES. The collected data included age, sex, height, weight, waist circumference, and various biochemical characteristics, including serum GGT levels. The data of study participants who ingested more than 40 g/day of alcohol and who were diagnosed with metabolic syndrome at baseline was excluded. We analyzed the prevalence of metabolic syndrome according to GGT quartiles in both genders.
-
Results
- The GGT level was significantly higher in subjects with metabolic syndrome compared to normal subjects (37.92±48.20 mg/dL vs. 25.62±33.56 mg/dL). The prevalence of metabolic syndrome showed a stepwise increase with GGT quartiles in both male and female subjects. Compared to the lowest GGT quartile, the odds ratio was 1.534 (95% confidence interval [CI], 1.432 to 1.643), 1.939 (95% CI, 1.811 to 2.076), and 2.754 (95% CI, 2.572 to 2.948) in men and 1.155 (95% CI, 1.094 to 1.218), 1.528 (95% CI, 1.451 to 1.609), and 2.022 (95% CI, 1.921 to 2.218) in women with increasing GGT quartile. The cutoff value of GGT predicting risk of metabolic syndrome was 27 IU/L in men and 17 IU/L in women.
-
Conclusion
- We suggested that GGT could be an easily checkable marker for the prediction of metabolic syndrome.
- Gamma-glutamyltransferase (GGT) is synthesized in the epithelial cells of the intrahepatic bile ducts and is considered an indicator of the degree of liver disease and alcohol consumption [12]. Recently, a number of reports revealed that GGT levels are also associated with diabetes, hypertension, and cardiovascular mortality regardless of liver damage or alcohol consumption [3456]. In addition, the prevalence and incidence of metabolic syndrome were also reported to increase with increasing serum GGT concentration or with longitudinal increasing of GGT levels [789]. The elevated GGT levels in these metabolic disease had been explained that GGT is indirectly reflected the increased oxidative stress and chronic inflammation which is closely related with metabolic disease [10].
- Despite the availability of metabolic markers, such as adiponectin, leptin, and tumor necrosis factor α, clinical professionals and patients require an easily measured and cheaper test [11]. Among the potential markers, we considered GGT a favorable laboratory marker to reflect metabolic syndrome. We previously reported the association between GGT and diabetes mellitus or metabolic syndrome using data from single center study subjects or Korean Rural Genomic Cohort (KRGC) study [7912]. In this study, we investigated the association between GGT and the prevalence of metabolic syndrome using data from the large-scale Korean Genome and Epidemiology Study (KoGES).
INTRODUCTION
- This study was conducted using data from the KoGES. The KoGES is an integrated study of Korean cohort-based surveys conducted in South Korea. The KoGES study is managed by the Korea Centers for Disease Control and Prevension (KCDC) and the design of the KoGES study has been published previously [13]. The KoGES study included a population-based prospective cohort studies such as the KoGES-Ansan and Ansung, KoGES-health examinee (HEXA), and the KoGES-cardiovascular disease association (CAVAS) studies and also gene-environment model studies such as the KoGES-twin and family, KoGES-immigrant, and KoGES-emigrant (Japan and China) studies. We used only data from the population-based KoGES studies and excluded data from the KoGES gene-environment model studies.
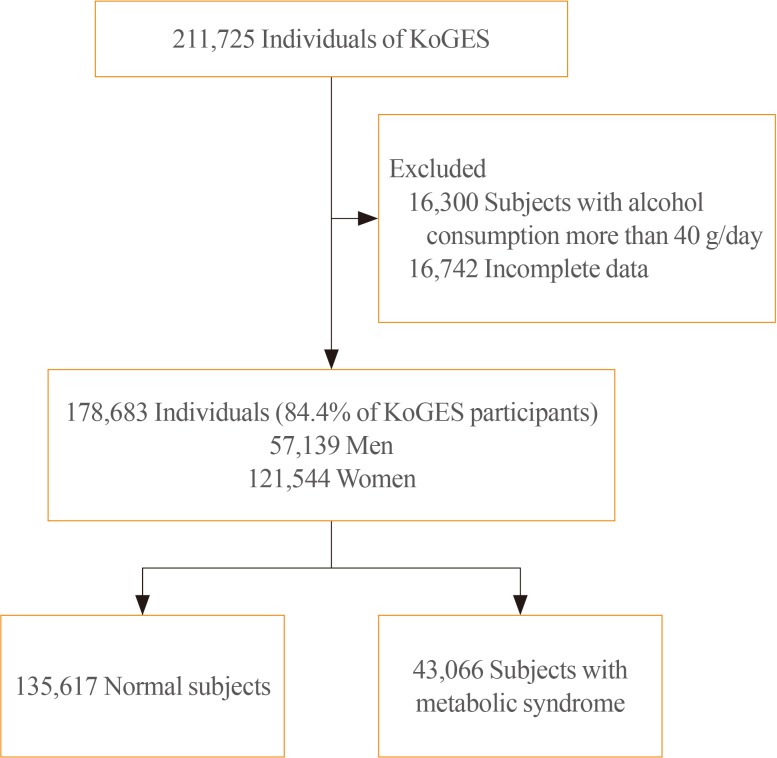
- The baseline data were collected from 10,030 adults included in the KoGES-Ansan and Ansung study, 173,357 adults in the KoGES-HEXA study, and 28,338 adults in the KoGES-CAVAS. We excluded data of study population who consumed more than 40 g of alcohol per day and who were diagnosed with metabolic syndrome at baseline. Thus, 178,683 from a total 211,725 subjects were included in this study (Fig. 1). The study protocol was approved by the Institutional Review Board (IRB; CR317023) of Wonju Severance Christian Hospital. All participants provided written informed consent before the commencement of the study.
- The collected data from the KoGES study included social status (i.e., economic status, educational level, and residence), past medical history (i.e., diabetes mellitus, hypertension, dyslipidemia, chronic kidney disease, cardiovascular disease), family history of medical disease, and lifestyle pattern (i.e., smoking, alcohol consumption, exercise) [13]. Dietary assessment was achieved by a semi-quantitative food frequency questionnaire consisting of 103 items [1415].
- The measured anthropometric data was included height, weight, body mass index (BMI), blood pressure, and waist circumference (WC). The collected biochemical parameters were fasting serum glucose level, total cholesterol, triglyceride (TG), high-density lipoprotein cholesterol (HDL-C), low-density lipoprotein cholesterol, aspartate aminotransferase (AST), alanine aminotransferase (ALT), and GGT levels.
- The definition of metabolic syndrome was conducted by the modified criteria from the National Cholesterol Education Program Adult Treatment Panel III report [161718]. We defined the metabolic syndrome as subjects who had three or more components among abdominal obesity, hypertriglyceridemia, low HDL-C, high blood pressure, and high fasting serum glucose level. WC cutoff points was ≥90 cm for men and ≥85 cm for women according to the abdominal obesity criteria from Korean Society for the Study of Obesity (KSSO) [19]. The definition of hypertriglyceridemia was serum TG concentration of ≥150 mg/dL (1.69 mmol/L). The definition of low HDL-C was serum HDL-C concentration of <40 mg/dL (1.04 mmol/L) for men and <50 mg/dL (1.3 mmol/L) for women. The definition of high blood pressure was ≥130/80 mm Hg or use of antihypertensive medication. The definition of high fasting serum glucose was serum glucose concentration of ≥100 mg/dL (5.6 mmol/L) or use of antidiabetic medication.
- To compare anthropometric and biochemical measurements and metabolic syndrome, we conducted two-sample t and chi-square tests. The prevalence of metabolic syndrome was calculated by categorizing GGT values by quartiles. Because the GGT level was different between men and women, we analyzed the data divided by gender [20]. After stratification by sex, multivariate logistic regression analysis was performed to evaluate the association between GGT and the prevalence of metabolic syndrome. Less than 25% of the GGT values were used as the reference category. The study adjusted for several variables, including age, alcohol, smoking, weight, blood pressure, and fasting plasma glucose level, to determine the independent association between GGT and incident metabolic syndrome. Multivariate logistic regression analysis was conducted to investigate the association of metabolic syndrome prevalence among the subjects who had abnormal findings of each components including WC, blood pressure, TG, glucose, and HDL-C according to GGT quartiles. We analyzed the area under the receiver operating characteristic curve (AUC) for measuring cutoff point of GGT predicting metabolic syndrome in men and women. We considered the data statistically significant as P values of <0.05. The statistical analyses were performed using IBM SPSS Statistics for Windows version 23.0 (IBM Co., Armonk, NY, USA).
METHODS
- This study enrolled a total of 178,683 subjects with a mean age of 53.86±8.76 years (men 57,139, women 121,544). The general characteristics of tudy participants stratified with GGT quartiles and gender are shown in Table 1. Age, WC, BMI, blood pressure, total cholesterol, TG, ALT, AST, fasting glucose, and glycated hemoglobin were increased from 1st GGT quartile to 4th GGT quartiles in both men and women. The prevalence of metabolic syndrome showed a stepwise increase with higher GGT quartiles in both men and women (Table 2). The prevalence of metabolic syndrome in the 1st, 2nd, 3rd, and 4th quartiles were 14.0%, 24.0%, 33.0%, and 43.8%, respectively, in men and 11.4%, 16.0%, 25.3%, and 36.1%, respectively, in women.
- Compared to the lowest GGT quartile, the odds ratios (ORs) of subjects with 2nd, 3rd, and 4th quartiles were 1.534 (95% confidence interval [CI], 1.432 to 1.643), 1.939 (95% CI, 1.811 to 2.076), and 2.754 (95% CI, 2.572 to 2.948) in men and 1.155 (95% CI, 1.094 to 1.218), 1.528 (95% CI, 1.451 to 1.609), and 2.022 (95% CI, 1.921 to 2.218) in women, respectively, after adjusting for age, alcohol intake, smoking, weight, blood pressure, and fasting plasma glucose concentration (Table 2).
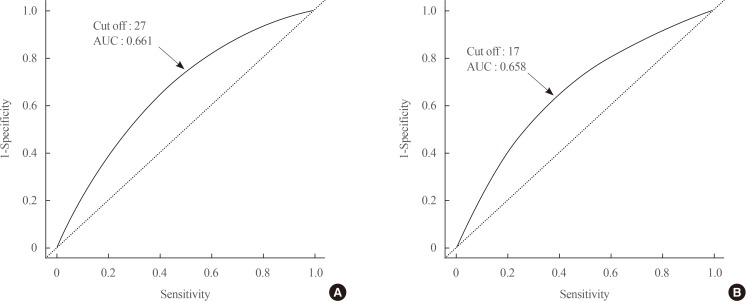
- The prevalence of each component of metabolic syndrome by GGT quartile is shown in Table 3. With increasing GGT quartile, the proportions of subjects with high WC, blood pressure, TG level, and glucose level and low HDL-C level increased. The OR for the prevalence of abnormal metabolic syndrome components also significantly increased according to GGT quartile in both men and women subjects (Table 3). The cutoff value of GGT predicting risk of metabolic syndrome was 27 IU/L in men and 17 IU/L in women (Fig. 2).
RESULTS
- These results suggest that the prevalence of metabolic syndrome increases with increasing GGT levels. These results were significant even after adjusting for alcohol intake. Patients with metabolic syndrome have increased risks for diabetes, cardiovascular disease, and mortality. Therefore, various markers for metabolic syndrome have been proposed to predict and prevent cardiovascular disease [21]. Adiponectin is one of the most commonly used indicators of metabolic syndrome. Adiponectin, which is adipocytes derived from fat, binds to the nuclear receptor and improves the decreased insulin resistance in patients with diabetes mellitus, obesity, and metabolic syndrome [112223]. Adiponectin and other adipocytokines can also be used as indicators of metabolic syndrome. However, they are complex and relatively expensive measurement. But, GGT is one of the easiest markers to measure and generally included in basic blood tests. So, physicians can easily prescribe and interpret the GGT level.
- Since the early 2000s, many studies have assessed the association between GGT and diabetes, metabolic syndrome, and cardiovascular disease [5924252627]. In most cases, these were the results of cohort studies. In addition to basal GGT, changes in GGT are also associated with the development of metabolic syndrome [12]. Meta-analyses have also reported the association between GGT and metabolic syndrome [2829].
- The results of the present study were not significantly different from those of previous studies. However, this study has a power because we used data from the KoGES cohort, part of the largest cohort study in Korea, from nearly 210,000 subjects were analyzed. These analyses showed that the prevalence of metabolic syndrome linearly increased with increasing GGT quartile.
- It is reported that higher GGT concentration predicts an increased risk of metabolic syndrome because GGT is a marker for oxidative stress [303132]. Studies have revealed that oxidative stress is an important marker of pathogenesis in metabolic syndrome [33343536]. Recently, several studies reported that GGT level was related to the iron status. The increased toxic free iron load could cause the GGT elevation [37]. The increased iron and GGT level was associated with metabolic syndrome [37]. In addition, the risk of nonalcoholic fatty liver disease (NAFLD) is increased in patients with metabolic syndrome [3839]. Because GGT level is frequently elevated in patients with NAFLD, patients with metabolic syndrome have higher GGT levels [384041]. Increased GGT level in subjects with metabolic syndrome could be thought due to relationship with oxidative stress, results from NAFLD state, or other pathways, but exact mechanisms were not elucidated.
- Although this study used large-scale data, it was difficult to determine the hazard ratio because only a part of the participants in the KoGES underwent follow-up, so we could perform cross-sectional analysis. This is one limitation of the present study. Second limitation is that we could not clearly defined whether the increase in GGT level was related with liver disease or not. We just excluded the heavy alcohol drinking subjects. The another limitation is that our results showed similar outcomes to other cohort studies. However, this result is first report that showed relationship between GGT levels and metabolic syndrome from data of all subjects included on KoGES study. So the results of the present study emphasize the usefulness of GGT level as a marker for metabolic syndrome, again.
- In conclusion, the analysis using large-scale population cohort data showed that the prevalence of metabolic syndrome increased with increasing GGT. Based on this, it can be concluded that GGT may reflect the risk of metabolic syndrome. We suggest that the easily measured GGT level could be a marker for metabolic syndrome.
DISCUSSION
-
Acknowledgements
- Data in this study were from the Korean Genome and Epidemiology Study (KoGES; 4851-302), National Research Institute of Health, Centers for Disease Control and Prevention, Ministry for Health and Welfare, Republic of Korea.
- This study was supported by the Medical Research Center Program, Ministry of Science, ICT and Future Planning (2017R1A5A2015369).
ACKNOWLEDGMENT
-
CONFLICTS OF INTEREST: No potential conflict of interest relevant to this article was reported.
-
AUTHOR CONTRIBUTIONS:
Article information
- 1. Teschke R, Brand A, Strohmeyer G. Induction of hepatic microsomal gamma-glutamyltransferase activity following chronic alcohol consumption. Biochem Biophys Res Commun 1977;75:718–724. ArticlePubMed
- 2. Sharpe PC, McBride R, Archbold GP. Biochemical markers of alcohol abuse. QJM 1996;89:137–144. ArticlePubMedPDF
- 3. Lee DH, Silventoinen K, Jacobs DR Jr, Jousilahti P, Tuomileto J. Gamma-glutamyltransferase, obesity, and the risk of type 2 diabetes: observational cohort study among 20,158 middle-aged men and women. J Clin Endocrinol Metab 2004;89:5410–5414. ArticlePubMed
- 4. Kim DJ, Noh JH, Cho NH, Lee BW, Choi YH, Jung JH, et al. Serum gamma-glutamyltransferase within its normal concentration range is related to the presence of diabetes and cardiovascular risk factors. Diabet Med 2005;22:1134–1140. ArticlePubMed
- 5. Ndrepepa G, Braun S, Cassese S, Fusaro M, Laugwitz KL, Schunkert H, et al. Relation of gamma-glutamyl transferase to cardiovascular events in patients with acute coronary syndromes. Am J Cardiol 2016;117:1427–1432. ArticlePubMed
- 6. Williams KH, Sullivan DR, Nicholson GC, George J, Jenkins AJ, Januszewski AS, et al. Opposite associations between alanine aminotransferase and γ-glutamyl transferase levels and all-cause mortality in type 2 diabetes: analysis of the Fenofibrate Intervention and Event Lowering in Diabetes (FIELD) study. Metabolism 2016;65:783–793. ArticlePubMed
- 7. Lee MY, Koh SB, Koh JH, Nam SM, Shin JY, Shin YG, et al. Relationship between gamma-glutamyltransferase and metabolic syndrome in a Korean population. Diabet Med 2008;25:469–475. ArticlePubMed
- 8. Andre P, Balkau B, Vol S, Charles MA, Eschwege E. DESIR Study Group. Gamma-glutamyltransferase activity and development of the metabolic syndrome (International Diabetes Federation Definition) in middle-aged men and women: data from the Epidemiological Study on the Insulin Resistance Syndrome (DESIR) cohort. Diabetes Care 2007;30:2355–2361. ArticlePubMed
- 9. Yadav D, Lee MY, Kim JY, Ryu H, Huh JH, Bae KS, et al. Combined effect of initial and longitudinal increases in γ-glutamyltransferase on incident metabolic syndrome: ARIRANG Study. Yonsei Med J 2017;58:763–769. ArticlePubMedPMC
- 10. Bo S, Gambino R, Durazzo M, Guidi S, Tiozzo E, Ghione F, et al. Associations between gamma-glutamyl transferase, metabolic abnormalities and inflammation in healthy subjects from a population-based cohort: a possible implication for oxidative stress. World J Gastroenterol 2005;11:7109–7117. ArticlePubMedPMC
- 11. Lafontan M, Viguerie N. Role of adipokines in the control of energy metabolism: focus on adiponectin. Curr Opin Pharmacol 2006;6:580–585. ArticlePubMed
- 12. Lee MY, Weon CS, Ko CH, Lee BJ, Lee Y, Kim MJ, et al. Relations between serum gamma-glutamyltransferase and prevalence of diabetes mellitus. Korean J Med 2004;67:498–505.
- 13. Kim Y, Han BG. KoGES group. Cohort profile: the Korean Genome and Epidemiology Study (KoGES) consortium. Int J Epidemiol 2017;46:e20. ArticlePubMedPDF
- 14. Kim J, Kim Y, Ahn YO, Paik HY, Ahn Y, Tokudome Y, et al. Development of a food frequency questionnaire in Koreans. Asia Pac J Clin Nutr 2003;12:243–250. PubMed
- 15. Ahn Y, Kwon E, Shim JE, Park MK, Joo Y, Kimm K, et al. Validation and reproducibility of food frequency questionnaire for Korean genome epidemiologic study. Eur J Clin Nutr 2007;61:1435–1441. ArticlePubMedPDF
- 16. Alberti KG, Zimmet P, Shaw J. Metabolic syndrome: a new world-wide definition. A Consensus Statement from the International Diabetes Federation. Diabet Med 2006;23:469–480. ArticlePubMed
- 17. American Heart Association. National Heart, Lung, and Blood Institue. Grundy SM, Cleeman JI, Daniels SR, Donato KA, et al. Diagnosis and management of the metabolic syndrome. An American Heart Association/National Heart, Lung, and Blood Institute Scientific Statement. Executive summary. Cardiol Rev 2005;13:322–327. ArticlePubMed
- 18. Expert Panel on Detection, Evaluation, and Treatment of High Blood Cholesterol in Adults. Executive summary of the third report of the National Cholesterol Education Program (NCEP) expert panel on detection, evaluation, and treatment of high blood cholesterol in adults (Adult Treatment Panel III). JAMA 2001;285:2486–2497. ArticlePubMed
- 19. Yoon YS, Oh SW. Optimal waist circumference cutoff values for the diagnosis of abdominal obesity in Korean adults. Endocrinol Metab (Seoul) 2014;29:418–426. ArticlePubMedPMC
- 20. Breitling LP, Raum E, Muller H, Rothenbacher D, Brenner H. Synergism between smoking and alcohol consumption with respect to serum gamma-glutamyltransferase. Hepatology 2009;49:802–808. ArticlePubMed
- 21. Ferrannini E, Balkau B, Coppack SW, Dekker JM, Mari A, Nolan J, et al. Insulin resistance, insulin response, and obesity as indicators of metabolic risk. J Clin Endocrinol Metab 2007;92:2885–2892. ArticlePubMedPDF
- 22. Arita Y, Kihara S, Ouchi N, Takahashi M, Maeda K, Miyagawa J, et al. Paradoxical decrease of an adipose-specific protein, adiponectin, in obesity. Biochem Biophys Res Commun 1999;257:79–83. ArticlePubMed
- 23. Ouchi N, Kihara S, Arita Y, Okamoto Y, Maeda K, Kuriyama H, et al. Adiponectin, an adipocyte-derived plasma protein, inhibits endothelial NF-kappaB signaling through a cAMP-dependent pathway. Circulation 2000;102:1296–1301. ArticlePubMed
- 24. Nakanishi N, Suzuki K, Tatara K. Serum gamma-glutamyltransferase and risk of metabolic syndrome and type 2 diabetes in middle-aged Japanese men. Diabetes Care 2004;27:1427–1432. ArticlePubMed
- 25. Nannipieri M, Gonzales C, Baldi S, Posadas R, Williams K, Haffner SM, et al. Liver enzymes, the metabolic syndrome, and incident diabetes: the Mexico City diabetes study. Diabetes Care 2005;28:1757–1762. ArticlePubMed
- 26. Lee JH, Um MH, Park YK. The association of metabolic syndrome and serum γ-glutamyl transpeptidase: a 4-year cohort study of 3,698 Korean male workers. Clin Nutr Res 2013;2:67–75. ArticlePubMedPMC
- 27. Ndrepepa G, Kastrati A. Gamma-glutamyl transferase and cardiovascular disease. Ann Transl Med 2016;4:481ArticlePubMedPMC
- 28. Kunutsor SK, Apekey TA, Seddoh D. Gamma glutamyltransferase and metabolic syndrome risk: a systematic review and dose-response meta-analysis. Int J Clin Pract 2015;69:136–144. ArticlePubMed
- 29. Liu CF, Zhou WN, Fang NY. Gamma-glutamyltransferase levels and risk of metabolic syndrome: a meta-analysis of prospective cohort studies. Int J Clin Pract 2012;66:692–698. ArticlePubMed
- 30. Lim JS, Yang JH, Chun BY, Kam S, Jacobs DR Jr, Lee DH. Is serum gamma-glutamyltransferase inversely associated with serum antioxidants as a marker of oxidative stress? Free Radic Biol Med 2004;37:1018–1023. ArticlePubMed
- 31. Roberts CK, Barnard RJ, Sindhu RK, Jurczak M, Ehdaie A, Vaziri ND. Oxidative stress and dysregulation of NAD(P)H oxidase and antioxidant enzymes in diet-induced metabolic syndrome. Metabolism 2006;55:928–934. ArticlePubMed
- 32. Stocker R, Keaney JF Jr. Role of oxidative modifications in atherosclerosis. Physiol Rev 2004;84:1381–1478. ArticlePubMed
- 33. Otani H. Oxidative stress as pathogenesis of cardiovascular risk associated with metabolic syndrome. Antioxid Redox Signal 2011;15:1911–1926. ArticlePubMed
- 34. Cannizzo B, Lujan A, Estrella N, Lembo C, Cruzado M, Castro C. Insulin resistance promotes early atherosclerosis via increased proinflammatory proteins and oxidative stress in fructose-fed ApoE-KO mice. Exp Diabetes Res 2012;2012:941304. ArticlePubMedPMCPDF
- 35. Venturini D, Simao AN, Scripes NA, Bahls LD, Melo PA, Belinetti FM, et al. Evaluation of oxidative stress in overweight subjects with or without metabolic syndrome. Obesity (Silver Spring) 2012;20:2361–2366. ArticlePubMed
- 36. Bonomini F, Rodella LF, Rezzani R. Metabolic syndrome, aging and involvement of oxidative stress. Aging Dis 2015;6:109–120. ArticlePubMedPMC
- 37. Koenig G, Seneff S. Gamma-glutamyltransferase: a predictive biomarker of cellular antioxidant inadequacy and disease risk. Dis Markers 2015;2015:818570. ArticlePubMedPMCPDF
- 38. Ballestri S, Zona S, Targher G, Romagnoli D, Baldelli E, Nascimbeni F, et al. Nonalcoholic fatty liver disease is associated with an almost twofold increased risk of incident type 2 diabetes and metabolic syndrome. Evidence from a systematic review and meta-analysis. J Gastroenterol Hepatol 2016;31:936–944. ArticlePubMed
- 39. Sookoian S, Pirola CJ. NAFLD. Metabolic make-up of NASH: from fat and sugar to amino acids. Nat Rev Gastroenterol Hepatol 2014;11:205–207. ArticlePubMedPDF
- 40. Banderas DZ, Escobedo J, Gonzalez E, Liceaga MG, Ramirez JC, Castro MG. γ-Glutamyl transferase: a marker of nonalcoholic fatty liver disease in patients with the metabolic syndrome. Eur J Gastroenterol Hepatol 2012;24:805–810. ArticlePubMed
- 41. Thamer C, Tschritter O, Haap M, Shirkavand F, Machann J, Fritsche A, et al. Elevated serum GGT concentrations predict reduced insulin sensitivity and increased intrahepatic lipids. Horm Metab Res 2005;37:246–251. ArticlePubMedPDF
References
The cutoff value of gamma-glutamyltransferase predicting the risk of metabolic syndrome. (A) Men. (B) Women. AUC, area under the receiver operating characteristic curve.
Anthropometric and Biochemical Characteristics of Subjects at Baseline and Follow-up
Values are expressed as number (%) or mean±standard deviation.
BMI, body mass index; SBP, systolic blood pressure; DBP, diastolic blood pressure; HDL-C, high-density lipoprotein cholesterol; ALT, alanine aminotransferase; AST, aspartate aminotransferase; HbA1c, glycated hemoglobin.
aModerate physical exercise is defined regular physical exercise performed enough to sweat body.
Prevalence of Metabolic Syndrome in Men and Women According to GGT Quartile
Prevalence of Abnormal Metabolic Syndrome Components in Men and Women According to GGT Quartile
Figure & Data
References
Citations
- Associating Liver Enzymes and Their Interactions with Metabolic Syndrome Prevalence in a Japanese Working Population
Aziz Jamal, Akira Babazono, Ning Liu, Rieko Yamao, Takako Fujita, Sung-a Kim, Yunfei Li
Metabolic Syndrome and Related Disorders.2024; 22(1): 27. CrossRef - Liver fat content assessed by conventional B-mode ultrasound and metabolic profile in non-diabetic patients: Implications for clinical practice
Rosanna Villani, Grazia Pia Magnati, Giulia Tuccari, Moris Sangineto, Antonino Davide Romano, Tommaso Cassano, Gaetano Serviddio
Ultrasound.2023; 31(3): 177. CrossRef - Serum γ-glutamyltransferase level and incidence risk of metabolic syndrome in community dwelling adults: longitudinal findings over 12 years
Jiwon Kwak, In-Ho Seo, Yong-Jae Lee
Diabetology & Metabolic Syndrome.2023;[Epub] CrossRef - Gamma-Glutamyl Transferase as a Diagnostic Marker of Metabolic Syndrome
Bobbili Tarun Kesava Naidu, Kakarlapudi Santosh Raju, Janapareddi V BhaskaraRao, Nallapati Sunil Kumar
Cureus.2023;[Epub] CrossRef - Metabolic syndrome and transaminases: systematic review and meta-analysis
Elena Raya-Cano, Rafael Molina-Luque, Manuel Vaquero-Abellán, Guillermo Molina-Recio, Rocío Jiménez-Mérida, Manuel Romero-Saldaña
Diabetology & Metabolic Syndrome.2023;[Epub] CrossRef - Association between Serum Gamma-glutamyl Transferase and Metabolic Syndrome: A Case–control Study
Akshay Shelar, Nalini Humaney, Akshay Chhajed, Krunal Domki, Ajay Narwade
Journal of Datta Meghe Institute of Medical Sciences University.2023; 18(4): 651. CrossRef - “Big Data” Approaches for Prevention of the Metabolic Syndrome
Xinping Jiang, Zhang Yang, Shuai Wang, Shuanglin Deng
Frontiers in Genetics.2022;[Epub] CrossRef - Can Gamma-glutamyl Transferase Predict Unhealthy Metabolic Phenotypes Among Healthcare Workers in Azar Cohort Study?
Mohammadhossein Somi, Seyed Sina Zakavi, Alireza Ostadrahimi, Negin Frounchi, Neda Gilani, Sarvin Sanaie, Elnaz Faramarzi
Hepatitis Monthly.2022;[Epub] CrossRef - Association between liver enzymes and metabolic syndrome in Canadian adults: results from the Canadian health measures survey - cycles 3 &4
Luan Manh Chu, Chandima Karunanayake, Palok Aich, Markus Hecker, Punam Pahwa
Journal of Diabetes & Metabolic Disorders.2022; 21(2): 1699. CrossRef - Repeatedly elevated γ-glutamyltransferase levels are associated with an increased incidence of digestive cancers: A population-based cohort study
Chang-Hoon Lee, Kyungdo Han, Da Hye Kim, Min-Sun Kwak
World Journal of Gastroenterology.2021; 27(2): 176. CrossRef - Index of Cardiac Age Index and Cardiometabolic Biomarkers in Adults with Metabolic Syndrome
Eun Jung Choi, Sang Yeoup Lee
Metabolic Syndrome and Related Disorders.2021; 19(5): 288. CrossRef - Simple metabolic markers associated with tophaceous gout
Wei Liu, Hui Song, Siliang Man, Hongchao Li, Siming Gao
Clinical Rheumatology.2021; 40(12): 5047. CrossRef - Expression Status and Prognostic Significance of Gamma-Glutamyl Transpeptidase Family Genes in Hepatocellular Carcinoma
Shan Tian, Jiao Li, Yingyun Guo, Weiguo Dong, Xin Zheng
Frontiers in Oncology.2021;[Epub] CrossRef - Nonalcoholic fatty liver disease and the risk of insulin-requiring gestational diabetes
Sang Youn You, Kyungdo Han, Seung-Hawn Lee, Mee Kyoung Kim
Diabetology & Metabolic Syndrome.2021;[Epub] CrossRef
 PubReader
 ePub Link
 Cite
Cite


