Articles
- Page Path
- HOME > Endocrinol Metab > Volume 35(2); 2020 > Article
-
Original ArticleFasting and Postprandial Hyperglycemia: Their Predictors and Contributions to Overall Hyperglycemia in Korean Patients with Type 2 Diabetes
 Audioslide
 -
Jaecheol Moon1*
 , Ji Young Kim1*, Soyeon Yoo1,2, Gwanpyo Koh1,2
 -
Endocrinology and Metabolism 2020;35(2):290-297.
DOI: https://doi.org/10.3803/EnM.2020.35.2.290
Published online: June 30, 2020
1Department of Internal Medicine, Jeju National University Hospital, Jeju, Korea
2Department of Internal Medicine, Jeju National University School of Medicine, Jeju, Korea
- Corresponding author: Gwanpyo Koh. Department of Internal Medicine, Jeju National University School of Medicine, 15 Aran 13-gil, Jeju 63241, Korea, Tel: +82-64-754-8163, Fax: +82-64-717-1131, E-mail: okdom@jejunu.ac.kr
- * These authors contributed equally to this work.
Copyright © 2020 Korean Endocrine Society
This is an Open Access article distributed under the terms of the Creative Commons Attribution Non-Commercial License (https://creativecommons.org/licenses/by-nc/4.0/) which permits unrestricted non-commercial use, distribution, and reproduction in any medium, provided the original work is properly cited.
ABSTRACT
-
Background
- This study aimed to identify factors that affect fasting hyperglycemia (FHG) and postprandial hyperglycemia (PPG) and their contributions to overall hyperglycemia in Korean patients with type 2 diabetes mellitus (T2DM).
-
Methods
- This was a retrospective study conducted on 194 Korean T2DM patients with 7-point self-monitoring blood glucose (SMBG) profiles plotted in 4 days in 3 consecutive months. We calculated the areas corresponding to FHG and PPG (area under the curve [AUC]FHG and AUCPPG) and contributions (%) in the graph of the 7-point SMBG data. The levels of glycated hemoglobin (HbA1c) were categorized by tertiles, and the contributions of FHG and PPG were compared.
-
Results
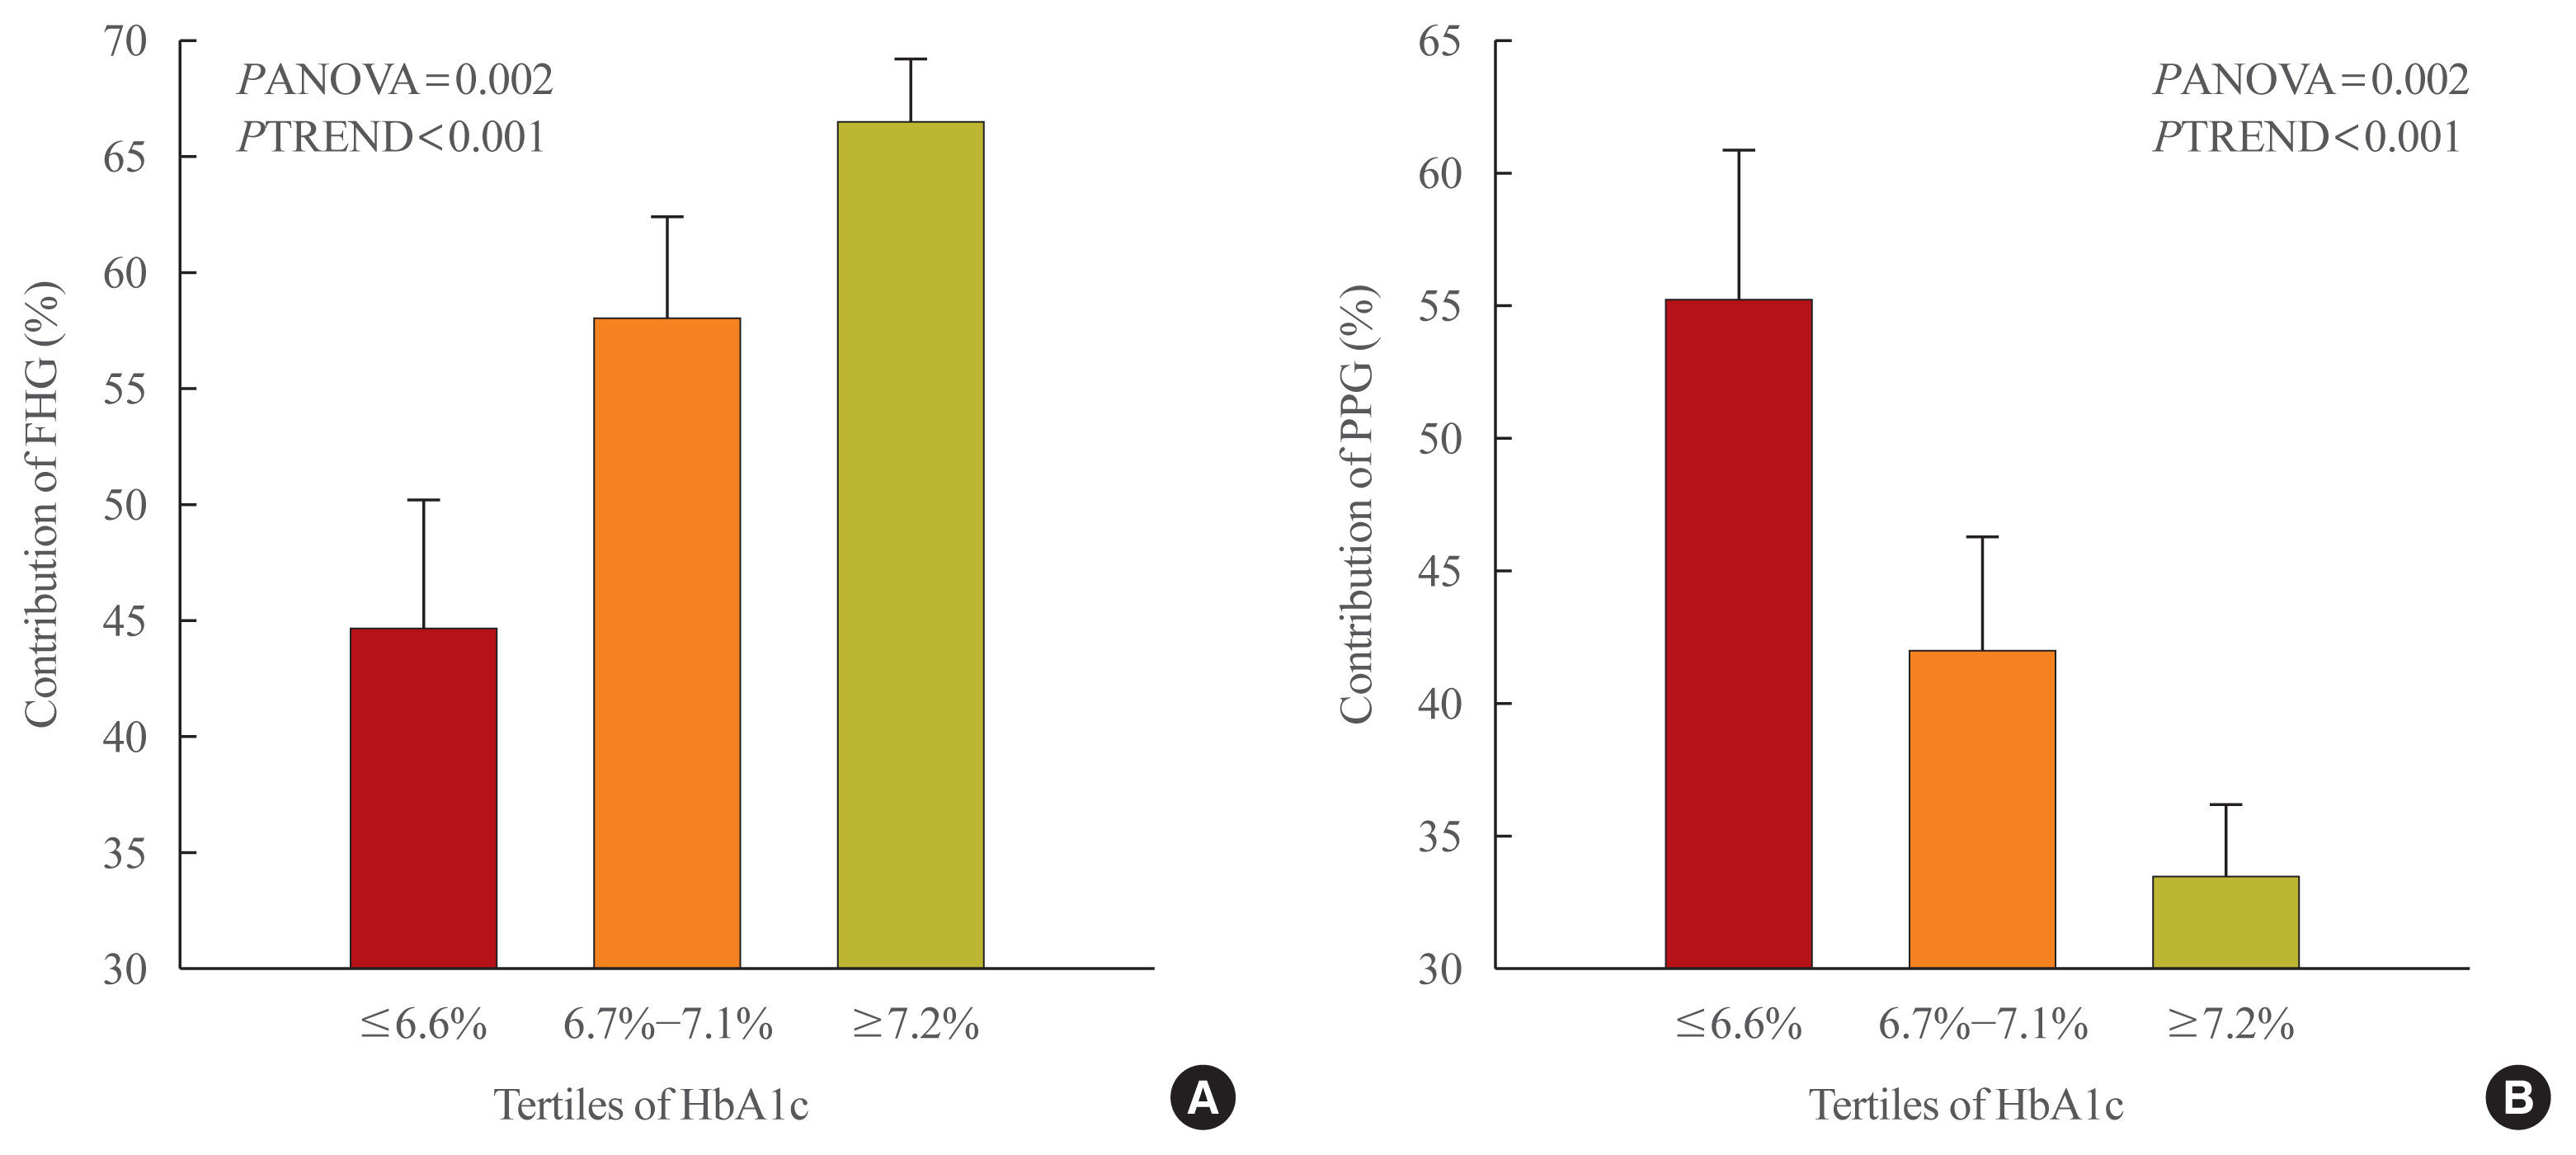
- The relative contribution of FHG increased (44.7%±5.6%, 58.0%±4.4%, 66.5%±2.8%; PANOVA=0.002, PTREND <0.001), while that of PPG decreased (55.3%±5.5%, 42.0%±4.4%, 33.5%±2.8%; PANOVA=0.002, PTREND <0.001) with the elevated HbA1c. Multivariate analysis showed that HbA1c (β=0.615, P<0.001), waist circumference (β=0.216, P=0.042), and triglyceride (β=0.121, P=0.048) had a significant association with AUCFHG. Only HbA1c (β=0.231, P=0.002) and age (β=0.196, P=0.009) was significantly associated with AUCPPG.
-
Conclusion
- The data suggested that in Korean T2DM patients, FHG predominantly contributed to overall hyperglycemia at higher HbA1c levels, whereas it contributed to PPG at lower HbA1c levels. It is recommended that certain factors, namely age, degree of glycemic control, obesity, or triglyceride levels, should be considered when prescribing medications for T2DM patients.
- Various research and debates have been conducted about whether glycated hemoglobin (HbA1c)—an index for the overall hyperglycemia—is more related to fasting hyperglycemia (FHG) or postprandial hyperglycemia (PPG). In 1997, Avignon et al. [1] first measured blood glucose at different times of the day to study the relative effect of FHG and PPG on HbA1c. They found that PPG was a better predictor of overall hyperglycemia than FHG. Analyzing the diabetes control and complication trial (DCCT) data, Rohlfing et al. [2] also showed that PPG had a linear association with HbA1c and had a stronger association with overall hyperglycemia than FHG. In contrast, Bonora et al. [3] reported that FHG had a stronger association with overall hyperglycemia than PPG.
- To re-examine these associations, Monnier et al. [4] had patients with type 2 diabetes mellitus (T2DM) blood glucose measured at four points of time and calculated the area under the blood glucose curve. In their study, the contribution of PPG to overall hyperglycemia was high in the group with relatively good blood glucose control, while that of FHG increased with poorer blood glucose control.
- Following the study by Monnier et al. [4], several other investigations were conducted using the same method. For example, the study by Riddle et al. [5] classified targets according to HbA1c in the same way as Monnier et al. [4] and recognized the contribution of FHG and PPG. The authors also categorized participants by HbA1c into the same groups as in the study by Monnier et al. [4] and examined the contributions of FHG and PPG. They pointed out that the contribution of FHG in all groups was 70% or greater. Furthermore, despite a slight rise in the contribution of FHG as HbA1c increased, no statistically significant difference was observed.
- Previous studies have shown conflicting results despite using the same analysis methods, and only a few studies have been carried out on Asian populations. Therefore, we conducted this study aiming to do the following: (1) examine how the contribution of FHG and PPG changes with HbA1c in Korean T2DM patients and (2) analyze the factors, other than HbA1c, associated with FHG and PPG.
INTRODUCTION
- Participants
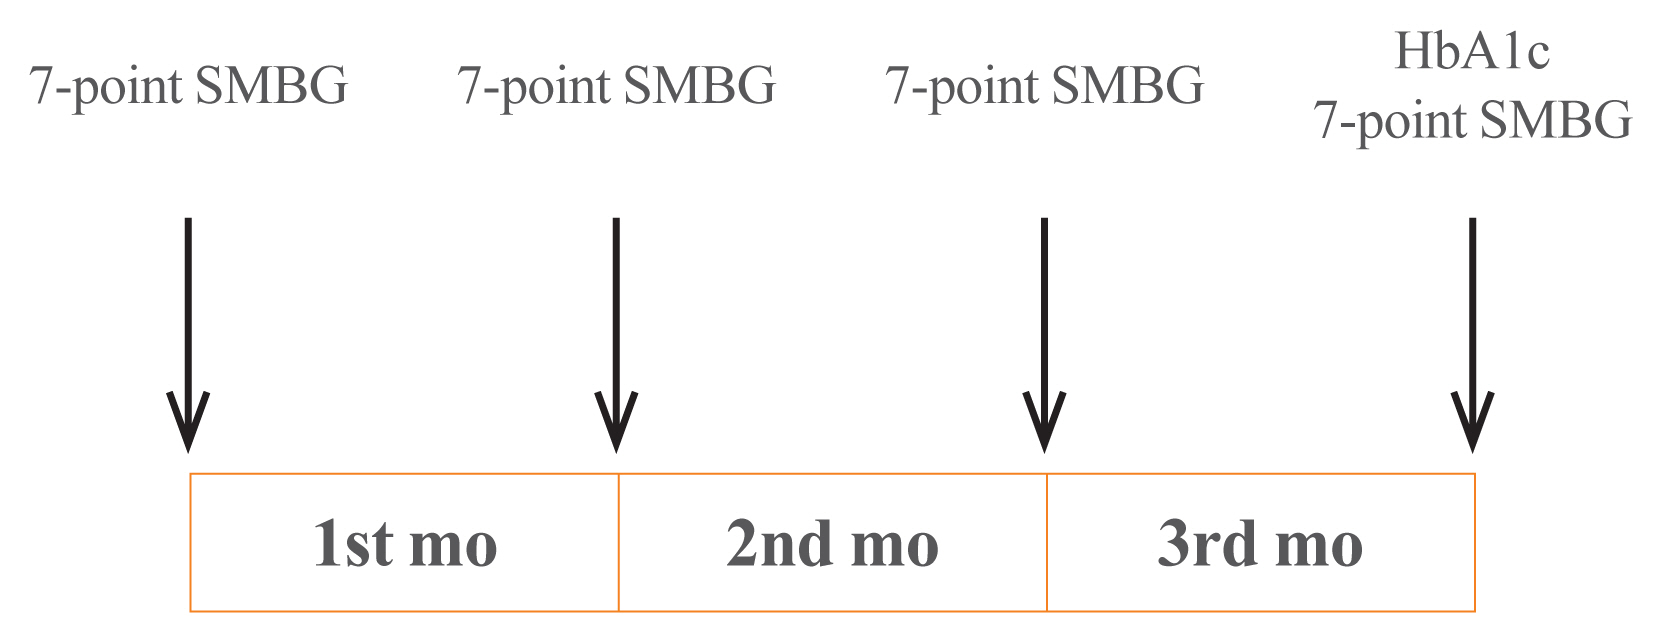
- In this study, we retrospectively collected and analyzed the data of patients visiting the outpatient clinic in the Division of Endocrinology and Metabolism, Department of Internal Medicine, Jeju National University Hospital, from August 2009 to October 2011. The patients must meet the inclusion criteria as follows: (1) they suffered from T2DM; (2) their age range must be between 20 and 80 years old; and (3) they had performed 7-point self-monitoring blood glucose (SMBG), i.e., had recorded their own blood glucose levels seven times a day, for 4 days (sessions) as recommended by a medical professional. Days 1, 2, and 3 were in the beginning of the first, second, and third months, respectively, while day 4 was at the end of the third month (Fig. 1).
- Patients were excluded from the study if (1) they had type 1 diabetes (serum C-peptide <0.6 ng/mL or increased anti-glutamic acid decarboxylase antibody titer, if they received multiple doses of insulin from the time of diagnosis, or if they had a history of diabetic ketoacidosis); and (2) they were administered insulin or α-glucosidase inhibitors. They were excluded because the medications can have certain effects on PPG. After applying the inclusion and exclusion criteria, we had a final sample of 194 patients.
- This study was approved by the Institutional Review Board of the Jeju National University Hospital (IRB File No. JEJUNUH 2015-06-006) and was exempted from informed consent requirements because of its retrospective nature.
- Study procedure
- All participants performed 7-point SMBG immediately before each meal, 2 hours after each meal, and before sleeping. The recording of SMBG was conducted for 4 days (sessions) selected in the 3 consecutive months. In the last session, HbA1c was also measured (Fig. 1).
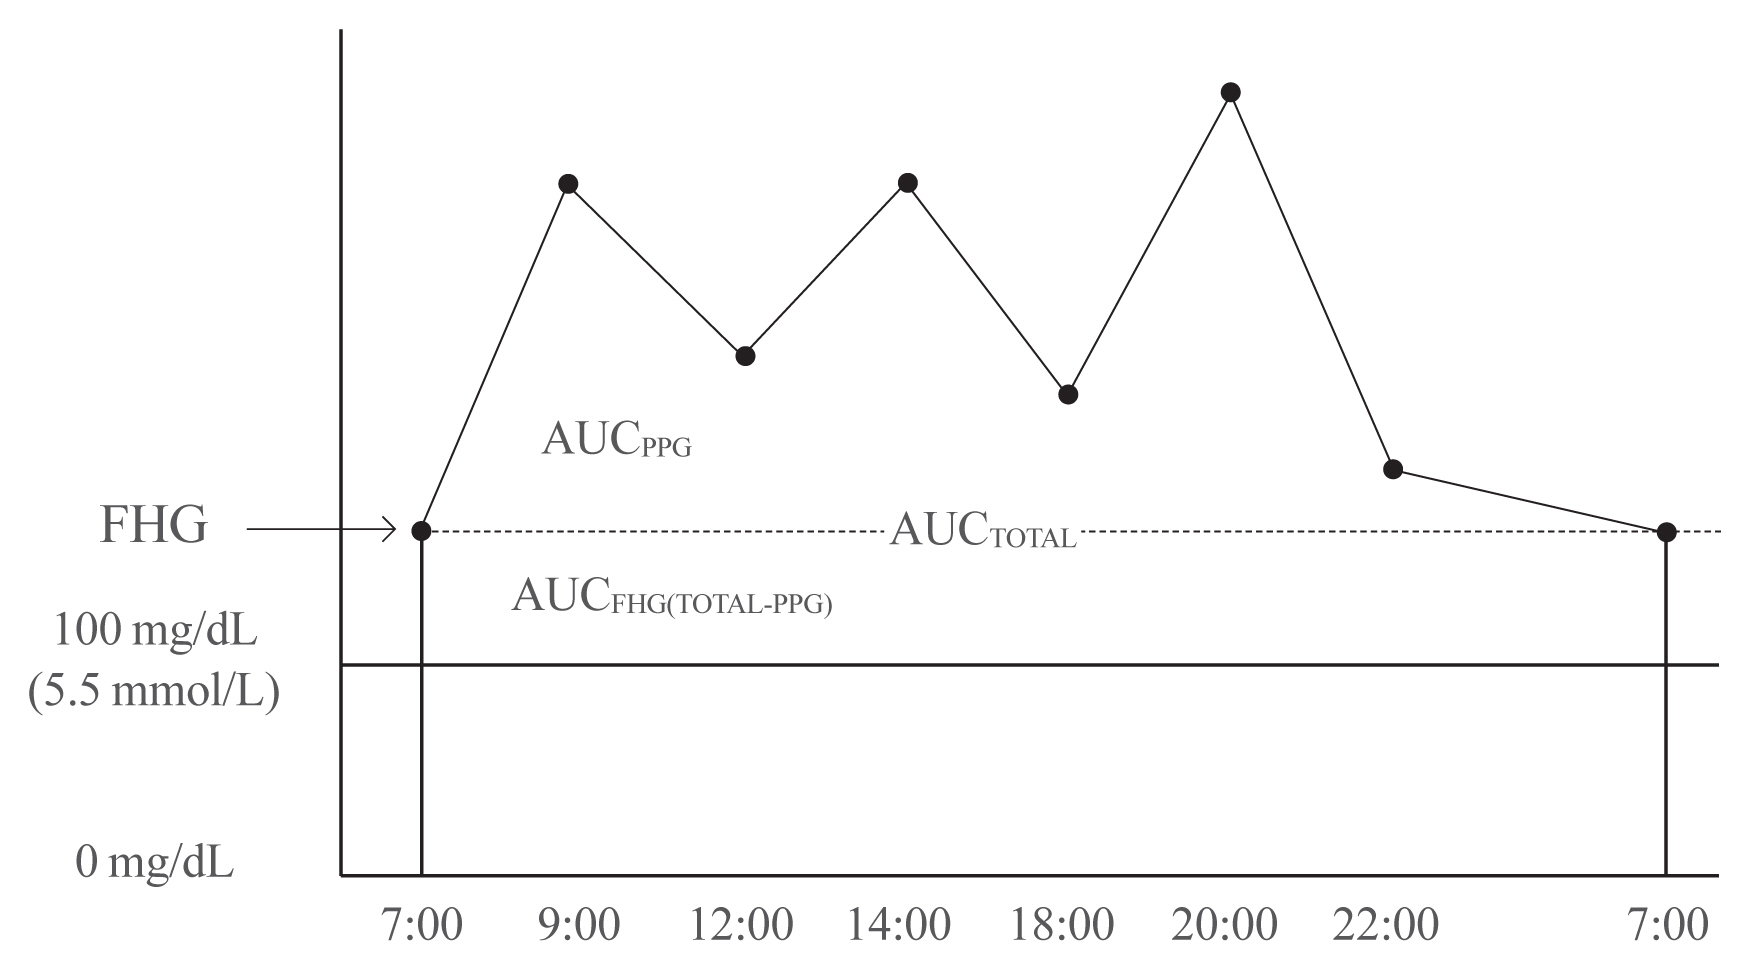
- Using 7-point SMBG profiles, we calculated the area under the curve (AUC). The AUCtotal was defined as the area that corresponds to 5.6 mmol/L (100 mg/dL) or greater. We used 100 mg/dL as the cut-off point because it is defined as the upper limit of normal fasting glucose by the American Diabetes Association [6]. AUCFHG was calculated by AUCtotal-AUCPPG, and the contribution of FHG was AUCFHG/AUCtotal (%). AUCPPG refers to the area above the fasting glucose level in the graph, and the contribution of PPG on the overall hyperglycemia was calculated by AUCPPG/AUCtotal (%) (Fig. 2). We used these calculations (i.e., the mean values of contribution) to identify the association between FHG and PPG with HbA1c. We divided the patients into three groups according to HbA1c tertiles: Group 1 (6.6% or below), Group 2 (6.7% to 7.1%), and Group 3 (7.2% or above). The mean contributions of FHG and PPG were then compared among the three groups.
- Demographic characteristics, medical history, and the history of hypoglycemic agent use were investigated through interviews and electronic medical records, and physical examinations were performed by a physician. Some blood tests were performed after 12 hours of fasting. They included HbA1c, C-peptide, high sensitivity C-reactive protein (hsCRP), total cholesterol, triglyceride (TG), high-density lipoprotein cholesterol, low-density lipoprotein cholesterol, creatinine, aspartate transaminase (AST), and alanine transaminase (ALT).
- Statistical analysis
- The results are presented as mean±standard deviation (SD) for continuous variables and as percentages for categorical variables. Moreover, graphs were plotted with mean±SD. We used analysis of variance (ANOVA) with the linear trend test to examine the difference between the contribution of FHG and that of PPG to overall hyperglycemia by HbA1c tertile, and the change in the contributions. Additionally, to identify the factors affecting the two types of hyperglycemia, we performed a multivariate linear regression model in which AUCPPG and AUCFHG were treated as dependent variables, while independent variables included those significantly associated with AUCPPG and AUCFHG in the simple correlation analysis and Student’s t test. Non-normally distributed variables were logarithmically transformed and analyzed. In this study, we used SPSS version 18.0 (SPSS Inc., Chicago, IL, USA) to analyze data and set the level of significance at P<0.05.
METHODS
- Clinico-biochemical characteristics of patients
- This study included 194 patients with the mean age of 57.6±9.0 years old. Male patients (n=137, 69%) outnumbered female ones (n=57, 31%). Their mean duration of having diabetes was 7.6±6.7 years, and the mean HbA1c as 7.0%±0.9%. Among hypoglycemic agents, sulfonylurea was most commonly taken (81.5%) followed by metformin (57.4%), and dipeptidyl peptidase-4 inhibitor (DPP4i; 11.3%) (Table 1).
- Changes in FHG and PPG, by HbA1c value
- We divided patients into three groups according to HbA1c tertiles. Then, we examined whether the contributions of FHG and PPG changed significantly by HbA1c. The mean percentage of contribution of FHG was 44.7±5.6 in Group 1, compared to 58.0±4.4 in Group 2 and 66.5±2.8 in Group 3. Meanwhile, the figures for PPG were 55.3±5.6 in Group 1, 42.0±4.4 in Group 2, and 33.5±2.8 in Group 3. Here, it can be seen that as HbA1c increased, the mean percentage of contribution of FHG increased (PANOVA=0.002, PTREND <0.001) while that of PPG decreased (PANOVA=0.002, PTREND <0.001) (Table 2, Fig. 3).
- Predictors of FHG and PPG
- To identify predictors of FHG and PPG, we used univariate and multivariate models with sex, age, illness duration, medication, and certain blood test results as independent variables, and AUCFHG and AUCPPG as dependent variables. The correlation analysis and Student’s t test showed significant associations between AUCFHG and several factors, included age, body mass index, waist circumference, HbA1c, C-peptide, ALT, TG, and sulfonylurea use. Meanwhile, factors significantly associated with AUCPPG, including age, systolic blood pressure, and duration of diabetes, HbA1c, C-peptide, hsCRP, sulfonylurea, and DPP4i use (Tables 3, 4). In the multivariate linear regression analysis, we only included factors that were significantly associated with AUCFHG and AUCPPG in the univariate analysis. In this analysis, besides HbA1c (β=0.615, P<0.001), only waist circumference (β=0.216, P=0.042) and TG (β=0.121, P=0.048) were associated with AUCFHG. Apart from HbA1c (β=0.231, P=0.002), only age showed a significant association with AUCPPG (β= 0.196, P=0.009) (Table 5).
RESULTS
- This study assessed not only the contribution of FHG and PPG to overall hyperglycemia but also the factors affecting these two types of hyperglycemia.
- Many studies have been conducted on the contributions of fasting or PPG to overall blood glucose control; nevertheless, their results were found to be inconsistent. Monnier et al. [4] reported that the relative contributions of FHG and PPG differed by the progression of diabetes. To assess these contributions, they categorized patients into different groups based on HbA1c tertiles and calculated the AUC. We based on their methods to analyze data of Korean patients; however, our study differed from theirs in several respects [4]. First, the number of patients in our study was small (n=194); therefore, we divided patients into three groups according to HbA1c tertiles instead of five groups as categorized by Monnier et al. [4]. Second, to have more accurate calculation of the areas and contributions, we selected patients who measured their own blood glucose at 7 points of time during the day (i.e., immediately before each meal, 2 hours after each meal, and before sleeping), compared to 4 points of time as mentioned in the study by Monnier et al. [4]. Third, Monnier et al. [4] calculated AUCtotal with the cut-off point of 6.1 mmol/L (110 mg/dL), compared to 5.5 mmol/L (100 mg/dL) in our present study (To use this cut-off point, we referred to the American Diabetes Association’s upper limit of the normal fasting glucose) [6]. Finally, patients in our present study had better blood glucose control than those in the study by Monnier et al. [4], as the mean HbA1c value in our study was lower (7.0% vs. 8.8%). Despite these differences, both studies shared the same result that the contribution of FHG increased and that of PPG decreased as HbA1c increased. This result was consistent with that of a study by Kikuchi et al. [7] and that of another study by Wang et al. [8]. Kikuchi et al. [7] conducted a study to assess the correlation between AUC and HbA1c in Japanese T2DM patients, but not the contributions of FHG and PPG. Their study results, however, pointed out that postprandial and fasting glucose were significantly associated with HbA1c in groups with better and poorer blood glucose control, respectively. In 2011, Wang et al. [8] categorized participants into five groups by HbA1c in a similar manner as the present study to assess the contributions of FHG and PPG among Asian T2DM patients. Like our study results, theirs also showed that the contribution of PPG tended to increase in the group with low HbA1c and FHG in the group with high HbA1c.
- Unlike previous research, this study also analyzed factors other than HbA1c that might affect FHG and PPG. When controlling for HbA1c and other factors, FHG showed a significant correlation with TG and waist circumference. It has been suggested in previous studies that TG and waist circumference increased fasting glucose by affecting insulin resistance. In 2002, Kametani et al. [9] followed-up patients for 9 years and found that obesity, hypertension, hypertriglyceridemia, and family history of diabetes were significant risk factors of impaired fasting glucose. Furthermore, in 2013, Lin et al. [10] reported that the risk of impaired fasting glucose increased with heightened levels of TG. However, most previous studies showed that obesity and hypertriglyceridemia were factors related to impaired fasting glucose. Unlike our study, they did not thoroughly assess the effects of TG or waist circumference on fasting glucose in patients with diabetes.
- Apart from HbA1c, age was the only factor affecting PPG. The correlation between hyperglycemia and age has been previously reported [11]. In 2013, Munshi et al. [12] analyzed the fasting and postprandial contribution to overall hyperglycemia using the AUC method. They found that in higher age groups, the contribution of postprandial glucose was greater than that of fasting glucose. Chiu et al. [13] explained that as age increases, the functions of beta-cells decrease, resulting in the relative rise in the contribution of postprandial glucose.
- Based on the results of this study, we provided the following recommendations for the treatment of patients with diabetes. First, the contribution of PPG is generally higher in well-controlled patients; therefore, it is difficult to reach the target HbA1c by reducing only fasting glucose levels. In a previous study by Woerle et al. [14], patients who reached the target HbA1c of below 7.0% had a significantly lower postprandial glucose level than that of those who did not. However, the study also showed no differences in the fasting glucose level. As the relative contribution changes with the degree of glycemic control, medications should be prescribed accordingly. Second, medication must be selected considering the age even if the HbA1c is the same, as the relative contribution of PPG increases with age which is typically accompanied by the decreased secretion of insulin. Third, the contribution of FHG is high in patients with obesity or high levels of TG. The use of drug that usually reduces fasting glucose level, such as metformin and thiazolidinedione, should therefore be considered with priority.
- This study encountered some limitations that should be addressed. The first limitation was the retrospective nature of this study. Second, the number of patients (n=194) was relatively small compared to that of the previous study conducted by Monnier et al. [4]. Third, the patients in this present study had relatively good control of their blood glucose, which was reflected in their relatively low HbA1c levels. When using tertiles to categorize the study sample into different groups, the group with the poorest control of blood glucose showed a mean HbA1c of 8%. Therefore, it remains unclear whether the results of our study apply to patients with poor blood glucose control. However, our results of high contribution of fasting glucose in higher HbA1c levels and high contribution of postprandial glucose in lower HbA1c levels are consistent with the results of studies outside Korea that include patients with various levels of blood glucose control [4,5,7,8,14]. Thus, we can predict similar results from Korean patients with poor glucose control. Fourth, our study calculated the contribution of FHG and PPG using 7-point SMBG instead of continuous glucose monitoring (CGM). Most international studies that have shown proportional relationship between contribution of FHG and HbA1c used 4-point or 7-point SMBG [4,5,7,12,14–16]. Thus, we also used the same method and validated that the contribution of FHG is high at higher levels of HbA1c in Korean diabetes patients. However, as measuring blood glucose using CGM can more accurately differentiate fasting and postprandial glucose than using SMBG, detailed studies assessing the contribution of FHG and PPG in Korean patients using CGM are further required. None the less, this present study made certain contributions to the current literature, as it, to our best knowledge, is the first to use 7-point SMBG in Korean T2DM patients to examine the research topic of interest.
- This study assessed the contributions of FHG and PPG in 194 Korean T2DM patients and analyzed data of three HbA1c groups. The contribution of PPG was high in the group with relatively good control of blood glucose, whereas that of FHG gradually increased with elevated HbA1c. Two other factors, namely waist circumference and TG, were also significantly associated with FHG. However, apart from HbA1c, age was the only factor that had a statistically significant association with PPG.
DISCUSSION
-
Acknowledgements
- This research was supported by the 2020 scientific promotion program funded by Jeju National University.
-
CONFLICTS OF INTEREST
No potential conflict of interest relevant to this article was reported.
-
AUTHOR CONTRIBUTIONS
Conception or design: G.K. Acquisition, analysis, or interpretation of data: J.M., J.Y.K., S.Y., G.K. Drafting the work or revising: J.M., J.Y.K. Final approval of the manuscript: G.K.
Article information


Values are expressed as mean±standard deviation or number (%).
BMI, body mass index; WC, waist circumference; BP, blood pressure; DM, diabetes mellitus; HbA1c, glycated hemoglobin; hsCRP, high sensitivity C-reactive protein; ALT, alanine transaminase; AST, aspartate transaminase; TC, total cholesterol; TG, triglyceride; HDL-C, high-density lipoprotein cholesterol; LDL-C, low-density lipoprotein cholesterol; DPP4i, dipeptidyl peptidase-4 inhibitor.
| Tertiles of HbA1c | PANOVA | PTREND | |||
|---|---|---|---|---|---|
| ≤6.6% | 6.7%–7.1% | ≥7.2% | |||
| Contribution of FHG | 44.7±5.55 | 58.0±4.35 | 66.5±2.80 | 0.002 | <0.001 |
| Contribution of PPG | 55.3±5.55 | 42.0±4.35 | 33.5±2.80 | 0.002 | <0.001 |
P values are calculated using the Pearson’s correlation analysis.
AUC, area under the curve; PPG, postprandial hyperglycemia; FHG, fasting hyperglycemia; r, Pearson’s correlation coefficient; BMI, body mass index; BP, blood pressure; HbA1c, glycated hemoglobin; hsCRP, high sensitivity C-reactive protein; ALT, alanine transaminase; AST, aspartate transaminase; HDL-C, high-density lipoprotein cholesterol; LDL-C, low-density lipoprotein cholesterol.
FHG, fasting hyperglycemia; PPG, postprandial hyperglycemia; β, corrected regression coefficient; AUC, area under the curve; HbA1c, glycated hemoglobin; BMI, body mass index; ALT, alanine transaminase; BP, blood pressure; DM, diabetes mellitus; hsCRP, high sensitivity C-reactive protein; DPP4i, dipeptidyl peptidase-4 inhibitor.
- 1. Avignon A, Radauceanu A, Monnier L. Nonfasting plasma glucose is a better marker of diabetic control than fasting plasma glucose in type 2 diabetes. Diabetes Care 1997;20:1822–6.ArticlePubMed
- 2. Rohlfing CL, Wiedmeyer HM, Little RR, England JD, Tennill A, Goldstein DE. Defining the relationship between plasma glucose and HbA(1c): analysis of glucose profiles and HbA(1c) in the Diabetes Control and Complications Trial. Diabetes Care 2002;25:275–8.ArticlePubMed
- 3. Bonora E, Calcaterra F, Lombardi S, Bonfante N, Formentini G, Bonadonna RC, et al. Plasma glucose levels throughout the day and HbA(1c) interrelationships in type 2 diabetes: implications for treatment and monitoring of metabolic control. Diabetes Care 2001;24:2023–9.ArticlePubMed
- 4. Monnier L, Lapinski H, Colette C. Contributions of fasting and postprandial plasma glucose increments to the overall diurnal hyperglycemia of type 2 diabetic patients: variations with increasing levels of HbA(1c). Diabetes Care 2003;26:881–5.ArticlePubMed
- 5. Riddle M, Umpierrez G, DiGenio A, Zhou R, Rosenstock J. Contributions of basal and postprandial hyperglycemia over a wide range of A1C levels before and after treatment intensification in type 2 diabetes. Diabetes Care 2011;34:2508–14.ArticlePubMedPMC
- 6. American Diabetes Association. Standards of medical care in diabetes. Diabetes Care 2004;27(Suppl 1):S15–35.ArticlePubMed
- 7. Kikuchi K, Nezu U, Shirakawa J, Sato K, Togashi Y, Kikuchi T, et al. Correlations of fasting and postprandial blood glucose increments to the overall diurnal hyperglycemic status in type 2 diabetic patients: variations with levels of HbA1c. Endocr J 2010;57:259–66.ArticlePubMed
- 8. Wang JS, Tu ST, Lee IT, Lin SD, Lin SY, Su SL, et al. Contribution of postprandial glucose to excess hyperglycaemia in Asian type 2 diabetic patients using continuous glucose monitoring. Diabetes Metab Res Rev 2011;27:79–84.ArticlePubMed
- 9. Kametani T, Koshida H, Nagaoka T, Miyakoshi H. Hypertriglyceridemia is an independent risk factor for development of impaired fasting glucose and diabetes mellitus: a 9-year longitudinal study in Japanese. Intern Med 2002;41:516–21.ArticlePubMed
- 10. Lin SX, Berlin I, Younge R, Jin Z, Sibley CT, Schreiner P, et al. Does elevated plasma triglyceride level independently predict impaired fasting glucose?: the Multi-Ethnic Study of Atherosclerosis (MESA). Diabetes Care 2013;36:342–7.ArticlePubMedPMC
- 11. Bando Y, Ushiogi Y, Okafuji K, Toya D, Tanaka N, Fujisawa M. The relationship of fasting plasma glucose values and other variables to 2-h postload plasma glucose in Japanese subjects. Diabetes Care 2001;24:1156–60.ArticlePubMed
- 12. Munshi MN, Pandya N, Umpierrez GE, DiGenio A, Zhou R, Riddle MC. Contributions of basal and prandial hyperglycemia to total hyperglycemia in older and younger adults with type 2 diabetes mellitus. J Am Geriatr Soc 2013;61:535–41.ArticlePubMed
- 13. Chiu KC, Lee NP, Cohan P, Chuang LM. Beta cell function declines with age in glucose tolerant Caucasians. Clin Endocrinol (Oxf) 2000;53:569–75.ArticlePubMed
- 14. Woerle HJ, Neumann C, Zschau S, Tenner S, Irsigler A, Schirra J, et al. Impact of fasting and postprandial glycemia on overall glycemic control in type 2 diabetes Importance of postprandial glycemia to achieve target HbA1c levels. Diabetes Res Clin Pract 2007;77:280–5.ArticlePubMed
- 15. Schernthaner G, Guerci B, Gallwitz B, Rose L, Nicolay C, Kraus P, et al. Impact of postprandial and fasting glucose concentrations on HbA1c in patients with type 2 diabetes. Diabetes Metab 2010;36:389–94.ArticlePubMed
- 16. Monnier L, Colette C, Dunseath GJ, Owens DR. The loss of postprandial glycemic control precedes stepwise deterioration of fasting with worsening diabetes. Diabetes Care 2007;30:263–9.ArticlePubMed
References
Figure & Data
References
Citations
- Prospective study of the association between chronotype and cardiometabolic risk among Chinese young adults
Tingting Li, Yang Xie, Shuman Tao, Liwei Zou, Yajuan Yang, Fangbiao Tao, Xiaoyan Wu
BMC Public Health.2023;[Epub] CrossRef - Effects of mulberry twig alkaloids(Sangzhi alkaloids) and metformin on blood glucose fluctuations in combination with premixed insulin-treated patients with type 2 diabetes
Ziyu Meng, Chengye Xu, Haoling Liu, Xinyuan Gao, Xinyu Li, Wenjian Lin, Xuefei Ma, Changwei Yang, Ming Hao, Kangqi Zhao, Yuxin Hu, Yi Wang, Hongyu Kuang
Frontiers in Endocrinology.2023;[Epub] CrossRef - Evaluating Triglyceride and Glucose Index as a Simple and Easy-to-Calculate Marker for All-Cause and Cardiovascular Mortality
Kyung-Soo Kim, Sangmo Hong, You-Cheol Hwang, Hong-Yup Ahn, Cheol-Young Park
Journal of General Internal Medicine.2022; 37(16): 4153. CrossRef - A new approach for investigating the relative contribution of basal glucose and postprandial glucose to HbA1C
Jing Ma, Hua He, Xiaojie Yang, Dawei Chen, Cuixia Tan, Li Zhong, Qiling Du, Xiaohua Wu, Yunyi Gao, Guanjian Liu, Chun Wang, Xingwu Ran
Nutrition & Diabetes.2021;[Epub] CrossRef - The Clinical Characteristics of Gestational Diabetes Mellitus in Korea: A National Health Information Database Study
Kyung-Soo Kim, Sangmo Hong, Kyungdo Han, Cheol-Young Park
Endocrinology and Metabolism.2021; 36(3): 628. CrossRef
 PubReader
 ePub Link
 Cite
Cite