Articles
- Page Path
- HOME > Endocrinol Metab > Volume 36(2); 2021 > Article
-
Original ArticleClinical Study Diagnostic Accuracy of Computed Tomography in Predicting Primary Aldosteronism Subtype According to Age
-
Seung Hun Lee1
 , Jong Woo Kim2, Hyun-Ki Yoon2, Jung-Min Koh1, Chan Soo Shin3, Sang Wan Kim3,4, Jung Hee Kim3
 -
Endocrinology and Metabolism 2021;36(2):401-412.
DOI: https://doi.org/10.3803/EnM.2020.901
Published online: March 31, 2021
1Division of Endocrinology and Metabolism, Department of Medicine, Asan Medical Center, University of Ulsan College of Medicine, Seoul, Korea
2Department of Radiology and Research Institute of Radiology, Asan Medical Center, University of Ulsan College of Medicine, Seoul, Korea
3Department of Internal Medicine, Seoul National University College of Medicine, Seoul, Korea
4Department of Internal Medicine, Seoul Metropolitan Government Seoul National University Boramae Medical Center, Seoul, Korea
- Corresponding author: Jung Hee Kim. Department of Internal Medicine, Seoul National University College of Medicine, 101 Daehak-ro, Jongno-gu, Seoul 03080, Korea, Tel: +82-2-2072-4839, Fax: +82-2-762-9662, E-mail: jhkxingfu@gmail.com
Copyright © 2021 Korean Endocrine Society
This is an Open Access article distributed under the terms of the Creative Commons Attribution Non-Commercial License (https://creativecommons.org/licenses/by-nc/4.0/) which permits unrestricted non-commercial use, distribution, and reproduction in any medium, provided the original work is properly cited.
ABSTRACT
-
Background
- Guidelines by the Endocrine Society Guideline on bypassing adrenal vein sampling (AVS) in patients <35 years old with marked primary aldosteronism (PA) (hypokalemia and elevated plasma aldosterone concentration [PAC]) and a unilateral lesion on computed tomography (CT) are based on limited number of studies. We aimed to determine the accuracy of CT in PA patients according to age.
-
Methods
- In this retrospective study, we investigated the concordance between CT and AVS in 466 PA patients from two tertiary centers who successfully underwent AVS.
-
Results
- CT had an overall accuracy of 64.4% (300/466). In the group with unilateral lesion, patients with hypokalemia had higher concordance than those without hypokalemia (85.0% vs. 43.6%, P<0.001). In the group with marked PA (hypokalemia and PAC >15.9 ng/dL) and unilateral lesion, accuracy of CT was 84.6% (11/13) in patients aged <35 years; 100.0% (20/20), aged 35 to 39 years; 89.4% (59/66), aged 40 to 49 years; and 79.8% (79/99), aged ≥50 years. Cut-off age and PAC for concordance was <50 years and >29.6 ng/dL, respectively. The significant difference in accuracy of CT in 198 patients with marked PA and a unilateral lesion between the <50-year age group and ≥50-year age group (90.9% vs. 79.8%, P=0.044) disappeared in 139 of 198 patients with PAC > 30.0 ng/dL (91.9% vs. 87.7%, P=0.590).
-
Conclusion
- Patients with hypokalemia, PAC >30.0 ng/dL, and unilateral lesion were at high risk of unilateral PA regardless of age.
- Primary aldosteronism (PA) is the most common cause of secondary hypertension (HTN), affecting 5% to 10% of hypertensive patients [1], increasing various cardiovascular complications [2–4]. Accurate diagnosis of PA subtype is important because unilateral types (unilateral aldosterone-producing adenoma [APA] or unilateral adrenal hyperplasia) can be treated with adrenalectomy, while bilateral types (bilateral adrenal hyperplasia or bilateral APA) are treated with mineralocorticoid receptor antagonists [1]. Adrenal venous sampling (AVS) is the standard procedure for diagnosing PA subtype [1,5]. However, its use is limited due to its invasive nature, high cost, and the need for technical expertise [5]. Thus, indications for AVS must be optimized by predicting the subtype using an alternative procedure.
- Although diagnostic accuracy of adrenal computed tomography (CT) for subtype diagnosis is inadequate [6–11], adrenal CT is widely available and less expensive than AVS. Furthermore, score-based algorithms combining CT findings with clinical and biochemical parameters such as age, sex, serum potassium, plasma aldosterone concentration (PAC), PAC to plasma renin activity (PRA) ratio (aldosterone-to-renin ratio [ARR]), estimated glomerular filtration rate (eGFR), and the results of confirmatory tests have been developed to predict the PA subtype [8,12–19]. The 2016 Endocrine Society clinical practice guidelines published recommended use of adrenal CT as initial work up to determine PA subtype and exclude adrenal carcinomas [1]. Moreover, patients aged <35 years with marked PA (spontaneous hypokalemia and markedly elevated PAC) and unilateral lesion on CT scan may not require AVS before proceeding to adrenalectomy [1]. This suggestion is based on data from one published report: a case series of all six patients aged <35 years with spontaneous hypokalemia, PAC >30 ng/dL, and unilateral lesion on CT showed complete concordance between CT and AVS [8]. Only one published study reported that patients with unilateral lesion on CT who had hypokalemia or high eGFR could avoid AVS when the cut-off age was 40 years because of the complete concordance between CT and AVS findings in these 28 patients [12] by validation of the clinical prediction score proposed by Kuper et al. [14]. The Japan Primary Aldosteronism Study (JPAS) validated the suggestion from the Endocrine Society guideline [1] on bypassing AVS in a subgroup with a cut-off value for age of <35 years because of the accurate diagnosis of unilateral PA in 30 patients with hypokalemia, PAC >15.9 ng/dL, and unilateral lesion on CT [10]. However, accurate diagnosis by CT in 34 of 39 (87.2%) patients aged 35 to 40 years with hypokalemia, PAC >15.9 ng/dL, and unilateral lesion on CT in the study of JPAS could not lead to the conclusion that AVS can be avoided in these patients. Therefore, JPAS suggested further validation was needed in the subgroup of patients aged 35 to 40 years [10].
- We aimed to investigate the accuracy of adrenal CT in determining PA subtype and validate it in patients with marked PA and unilateral lesion on CT according to age to search the subgroup of PA patients for bypassing AVS.
INTRODUCTION
- Subjects
- This retrospective study enrolled 676 PA patients in two centers in Korea; one center from 2000 to 2018 (n=363) [20], and the other from 2007 to 2016 (n=313) [21] using the de-identified clinical database [22]. The present study was approved by the Institutional Review Board of Seoul National University Hospital and Asan Medical Center (no. H-1801-010-911, and no. 2016-0254), and was conducted observing guidelines from the Declaration of Helsinki. The requirement for obtaining an informed consent was waived due to the retrospective nature of the study.
- Assessment of anthropometric and biochemical parameters
- Data regarding age, sex, body mass index (BMI), blood pressure (BP), PRA, PAC, serum potassium and creatinine levels, and eGFR (calculated using the Modification of Diet in Renal Disease equation) [23] were collected. Dose of antihypertensive medications was expressed as defined daily dose (DDD), which is the assumed average maintenance dose per day for a drug used for its main indication in adults, according to World Health Organization Anatomical Therapeutic Chemical (ATC)/DDD Index 2019 [24].
- PRA was measured by radioimmunoassay (RIA) using either Renin RIA beads (TFB Inc., Tokyo, Japan) at Seoul National University Hospital (SNUH) before 2011 or a PRA RIA kit (TFB Inc.) at SNUH after 2011 and at Asan Medical Center. PAC was determined by RIA using the SPAC-S Aldosterone kit (TFB Inc.). Intra-and inter-assay coefficients of variation for all assays were 5% and 10%, respectively.
- Serum potassium concentration was measured using a Roche ISE Standard Low/High (Roche Diagnostics, Mannheim, Germany) ion selective electrode (ISE) and a Cobas 8000 ISE analyzer (Roche Diagnostics) in both center. The intra-assay and inter-assay coefficients of variation were 0.5% and 1.6%.
- Diagnosis of PA
- Confirmatory testing was performed in patients with HTN with high ARR ≥20 and a PAC of >15 ng/dL. PA was confirmed using saline infusion test [1]. Treatment with diuretics and mineralocorticoid receptor antagonists was discontinued >6 weeks prior to confirming the diagnosis, while treatment with beta-adrenergic receptor blockers was discontinued >2 weeks prior. After shifting from these drugs to calcium channel blockers or alpha-adrenergic receptor blockers, BP monitoring was performed. If BP was unsatisfactorily controlled with the previous two classes of drug, the addition of angiotensin II receptor blockers and angiotensin-converting enzyme inhibitors was considered.
- Definition of hypokalemia, marked PA, and adrenal lesion on CT
- Hypokalemia was defined as a serum potassium level of <3.5 mEq/L, which was minimal level in available potassium data. Elevated aldosterone level was defined as PAC of >15.9 ng/dL and was suggested as the upper limit of normal by the JPAS [10]. Hypokalemia and PAC >15.9 ng/dL indicated marked PA. All patients underwent thin-slice (1 to 3 mm thick) adrenal CT. The findings were evaluated by radiologists in each institution who classified them into unilateral lesion, bilaterally normal, and bilateral lesions. Adrenal lesion of CT was defined as a nodule or hyperplasia if adrenal gland thickness measured ≥7 mm in diameter [25]. Appearance was considered normal if nodule size or adrenal gland thickness was <7 mm. CT was conducted before AVS in routine clinical practice and was carried out in patients with a clinical diagnosis of or with suspected PA but in the absence of AVS data.
- AVS and definition of an accurate diagnosis on CT
- The subtype of PA was determined based on the AVS results under adrenocorticotropic hormone stimulation [1,5]. Successful adrenal vein cannulation was defined as a selectivity index (SI, i.e., the ratio of cortisol concentration in the adrenal vein and to that in the inferior vena cava) of ≥3. To determine the PA subtype, we used the lateralization index (LI), which was calculated by dividing aldosterone to cortisol ratio on the dominant side by that on the non-dominant side. Patients with unilateral PA had a LI of >4, while those with bilateral PA had a LI of <3. LI with intermediate values (3≤ LI ≤4) indicated a gray zone between the two conditions.
- The CT diagnosis was considered accurate when the CT findings are concordant with the AVS findings.
- Statistical analysis
- Data were expressed as the median (interquartile range [IQR]) or number (percentage), unless stated otherwise. Clinical characteristics were compared among patients with unilateral lesion, bilateral normal results, and bilateral lesion on CT. Clinical characteristics according to CT findings were compared using Mann-Whitney U test for continuous variables and Fisher’s exact test for categorical variables. Analysis of group difference was performed using the two afore mentioned tests with post hoc Bonferroni correction; α<0.017 was considered significant after correction for multiple testing (α=0.05/3=0.017).
- We compared diagnostic concordance rate between CT and AVS findings in PA patients according to potassium status (normokalemia vs. hypokalemia).
- Using the variables that were different or tended to be different between the concordance and discordance groups, a univariate logistic regression analysis was performed to find the variables associated with the concordance between CT and AVS findings. Multivariate logistic regression analysis was then used to identify independent predictors of concordance among the variables were significant in the univariate analysis.
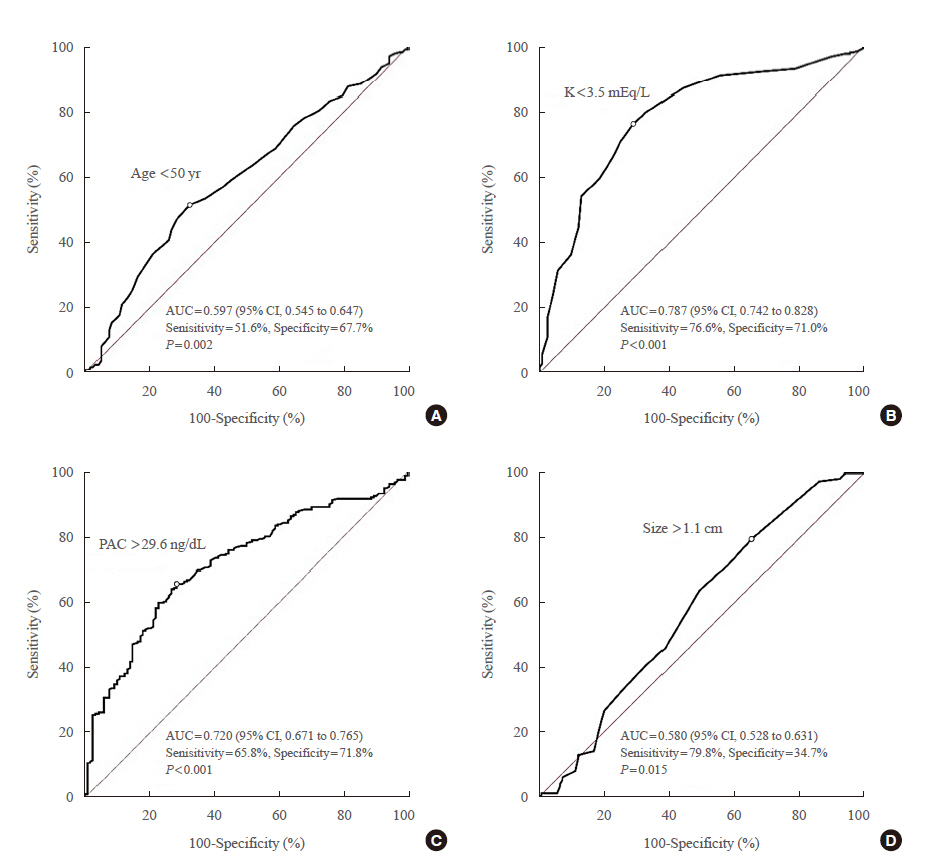
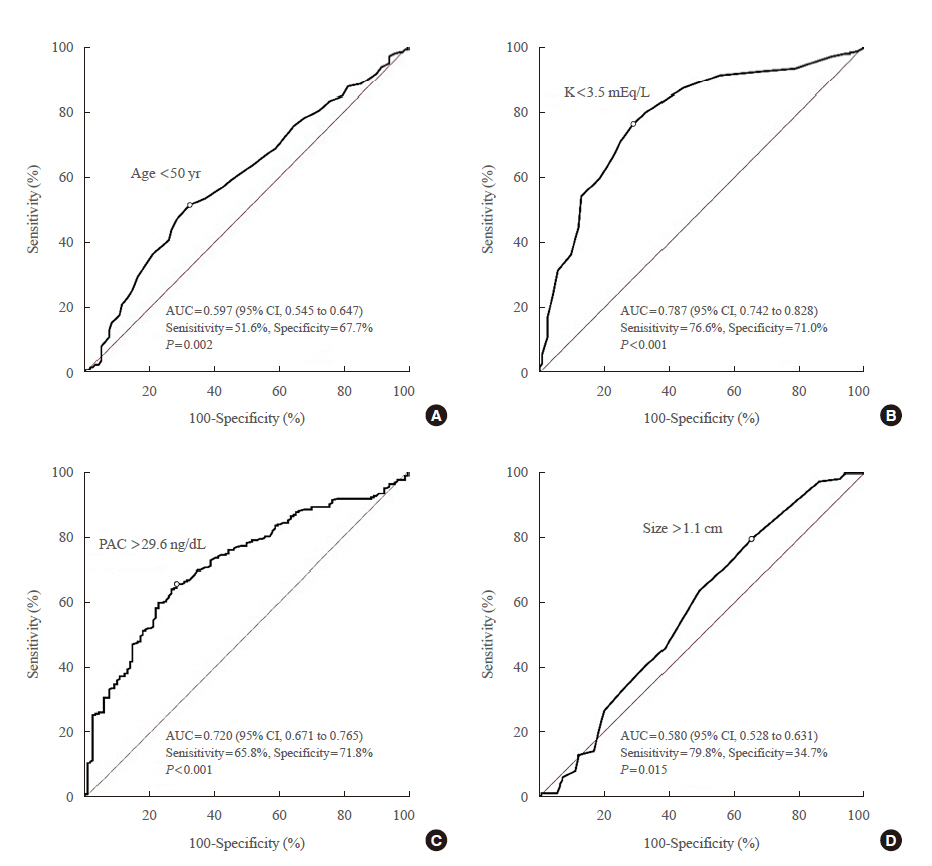
- To evaluate the ability of age, serum potassium, PAC, and nodule size predictive of concordance of diagnosis between CT and AVS findings for PA patients with marked PA and unilateral lesion on CT, receiver-operating characteristics (ROC) curve analysis with the area under the ROC curve (AUC) was performed. The cut-off values for age, serum potassium, PAC, and nodule size predictive of concordance were calculated using Youden’s index [26]. Additionally, we compared diagnostic accuracy of CT in patients with marked PA and unilateral lesion on CT stratified by age (< 35, 35–39, 40–49, and ≥50 years).
- We also compared diagnostic accuracy of CT in patients with hypokalemia, PAC >30.0 ng/dL, and unilateral lesion on CT by age (<35, 35–39, 40–49, and ≥50 years).
- Then, we compared clinical characteristics of patients with marked PA and those with unilateral lesion on CT by age: <40, 40–49, and ≥50 years; <50 and ≥50 years; <35 and 35–39 years; and <40 and 40–49 years. Statistical analyses were performed using SPSS version 18.0 (IBM Inc., Armonk, NY, USA). A P value of <0.05 was considered significant.
METHODS
- Among 676 eligible PA patients, 466 successfully underwent AVS and had complete data including clinical characteristics and laboratory and CT findings. In total, 210 patients with no data on AVS (n=80), unsuccessful cannulation by SI (n=93), and intermediate LI values on AVS (n=37) were excluded (Supplemental Fig. S1). Considering 37 patients with intermediate LI values (3≤ LI ≤4) on AVS as bilateral PA, diagnostic accuracy of CT was 18.9% (7/37; three patients with bilateral lesion and four patients with bilateral normal results on CT).
- Patients’ clinical characteristics are shown in Table 1. Median age was 51 years. Approximately 51.1% (228/466) of patients had hypokalemia; 79.8% (372/466) had unilateral lesion on CT, while 11.8% (55/466) had bilateral normal results on CT. Significant differences were observed in age (P=0.003), DDD of antihypertensive drugs (P=0.039), serum potassium levels (P< 0.001), prevalence of hypokalemia (P<0.001), PAC (P=0.001), and ARR (P=0.012) among patients with unilateral lesion, bilateral normal results, and bilateral lesions on CT.
- Overall prevalence of unilateral PA on AVS was 66.3% (309/466 patients) (Table 2). When including only PA patients with SI >5, diagnostic accuracy of CT was 63.7% (279/438), so there was no significant difference in diagnostic accuracy of CT between SI >3 and SI >5 (P=0.851). Prevalence of unilateral PA by AVS was higher in patients with unilateral lesion (71.8%, 267/372) than in those with bilateral normal results on CT (34.5%, 19/55, P<0.001) (Table 2). Although CT findings were significantly associated with diagnosis of PA subtype by AVS, overall diagnostic accuracy of CT was 64.4% (300/466) (Table 2). Approximately 5.1% (19/372) of patients with unilateral lesion on CT showed unilateral PA on AVS on the contralateral adrenal gland (Table 2). Clinical characteristics of 19 PA patients with unilateral PA showing discordant lateralization to contralateral adrenal gland on AVS and unilateral lesion on CT are shown in Supplemental Methods and Supplemental Table S1.
- Diagnostic accuracy of CT was higher in patients with hypokalemia than in those with normokalemia (79.0% vs. 49.1%, respectively; P<0.001) (Supplemental Table S2) as well as in patients with hypokalemia and unilateral disease on CT than in those with normokalemia and unilateral disease on CT (85.0% vs. 43.6%, respectively; P<0.001).
- PA patients with unilateral lesion on CT who were accurately diagnosed on CT had younger age, lower weight, lower BMI, higher diastolic BP, lower serum potassium levels, higher prevalence of hypokalemia, higher PAC, lower PRA, higher ARR, and larger nodule than those without concordance (Table 3). PA patients with concordance were mostly women and having more DDD of antihypertensive drugs. Among the variables that were different or tended to be different between the concordance and discordance groups, significant variables in the univariate logistic regression analysis were age, sex, BMI, serum potassium level, hypokalemia status, PAC, and ARR (Table 3). A multivariate logistic regression analysis revealed that age, BMI, serum potassium levels, and ARR were significant independent predictors of concordance (Table 3).
- We identified 198 patients with marked PA and unilateral lesion on CT. Of them, 13 were aged <35 years; 20, aged 35–39 years; 66, aged 40–49 years; and 99, aged ≥50 years. In patients with marked PA and unilateral lesion on CT, diagnostic accuracy rates of CT were 84.6% (11/13) in those aged <35 years; 100.0% (20/20), aged 35–39 years; 89.4% (59/66), aged 40–49 years; and 79.8% (79/99), aged ≥50 years (Table 4). Clinical characteristics of two PA patients aged <35 years with discordance between CT and AVS among 198 those with marked PA and unilateral lesion on CT are shown in Supplemental Table S3. Although previous study from JPAS showed the significant difference in diagnostic accuracy of CT, which was determined by AVS findings and/or surgical outcomes, in patients with marked PA and unilateral lesion on CT between those aged <35 years and 35 to 39 years (100.0%, 30/30 vs. 87.2%, 34/39; P=0.042) [10], present study showed no significant difference in diagnostic accuracy of CT, which was determined by AVS findings, in those with marked PA and unilateral lesion on CT between those aged <35 and 35 to 39 years (P=0.148). There was also no significant difference in diagnostic accuracy of CT in those between those aged <40 and 40 to 49 years (93.9%, 31/33 vs. 89.4%, 59/66; P=0.714).
- Optimal age cut-off value, Youden’s index [26], for concordant diagnosis between CT and AVS was <50 years. The AUC of age <50 years was 0.597 (95% confidence interval [CI], 0.545 to 0.647) with a sensitivity of 51.6%% and a specificity of 67.7% (Fig. 1). Diagnostic accuracy of CT was higher in patients with marked PA and unilateral lesion on CT aged <50 years (90.9%, 90/99) than in those ≥50 years (79.8%, 79/99, P=0.044) (Table 4). Optimal PAC cut-off value for concordant diagnosis between CT and AVS was >29.6 ng/dL, similar to that in a previous study (>30.0 ng/dL) [8]. The AUC of PAC >29.6 ng/dL was 0.720 (95% CI, 0.671 to 0.765) with a sensitivity of 65.8%% and a specificity of 71.8% (Fig. 1). We identified 139 PA patients with hypokalemia, PAC >30.0 ng/dL, and unilateral lesion on CT (Table 5). In this group, no significant difference was found in diagnostic accuracy of CT between patients aged <50 and ≥50 years (91.9%, 68/74; 87.7%, 57/65, respectively; P=0.590). There was also no significant difference in diagnostic accuracy of CT in patients according to age: 81.8% (9/11), patients aged <35; 100.0% (12/12), 35 to 39 years; 92.2% (47/51), 40 to 49 years; and 87.7% (57/65), aged ≥50 years (P=0.419). Clinical characteristics of 14 PA patients with discordance of CT and AVS among 139 those with hypokalemia, PAC >30.0 ng/dL, and unilateral lesion on CT are shown in Supplemental Table S4. Only four of 14 patients underwent surgery and three of four patients showed surgical benefit. The reason for the unavailability of outcome data of one patient was loss of follow-up. The AUC of K <3.5 mEq/L was 0.787 (95% CI, 0.742 to 0.828) with a sensitivity of 76.6% and a specificity of 71.0% (Fig. 1). The AUC of tumor size >1.1 cm was 0.580 (95% CI, 0.528 to 0.631) with a sensitivity of 79.8% and a specificity of 34.7%.
- In the group with marked PA (e.g., hypokalemia and PAC>15.9 ng/dL) and unilateral lesion on CT, significant differences in height, diastolic BP, DDD of antihypertensive drugs, eGFR, PAC, and nodule size were found between patients aged <50 and ≥50 years (Table 6). Moreover, there were significant differences in weight (P=0.049) and serum potassium levels (P=0.021), but not in PAC (P=0.181), between patients aged <35 and 35 to 39 years. Meanwhile, significant differences were found in nodule size (P=0.009), but not in serum potassium level (P=0.149) and PAC (P=0.841), between patients aged <40 and 40 to 49 years.
RESULTS
- Overall diagnostic accuracy of CT was 64.4% (300/466) and was higher in patients with hypokalemia and unilateral disease on CT than in those with normokalemia and unilateral disease on CT (85.0% vs. 43.6%). Patients with PA with unilateral lesion on CT and who were accurately diagnosed on CT had lower serum potassium levels, higher prevalence of hypokalemia, and higher PAC than those without concordance. In the group with hypokalemia, PAC >15.9 ng/dL, and unilateral lesion on CT, diagnostic accuracy rates of CT were 84.6% (11/13) in patients aged <35 and 100.0% (20/20) in those aged 35 to 39 years. Age and PAC cut-off value for accurate diagnosis of CT were <50 years and >29.6 ng/dL, respectively. In 198 patients with hypokalemia, PAC >15.9 ng/dL, and unilateral lesion on CT, the diagnostic accuracy of CT was higher in those aged <50 than in those ≥50 years (90.9% vs. 79.8%, respectively). However, diagnostic accuracy of CT was not statistically significant in 139 PA patients with hypokalemia, PAC >30.0 ng/dL, and unilateral lesion on CT (91.9% vs. 87.7%); suggesting that these patients hypokalemia, PAC >30.0 ng/dL, and unilateral lesion on CT had a higher risk of unilateral PA, regardless of age. Using the criteria of hypokalemia, PAC >30 ng/dL, and unilateral lesion at CT, 125 of 139 (89.9%) AVS could be spared. CT findings alone misclassified unilateral 42 of 94 PA patients (44.7%) as bilateral PA, so they would result missing the chance of surgery and the possibility of a cure. By CT findings, 105 of 372 (28.2%) bilateral PA would be operated inappropriately by misclassification as unilateral PA. CT findings alone would result in adrenalectomies on the wrong side in 19 of 372 PA patients (5.1%) by showing unilateral hyperaldosteronism by AVS finding on the contralateral adrenal gland. Further validation is needed to provide conclusive evidence to support the recent suggestion from the Endocrine Society guidelines on the age cut-off value of <35 years in this subgroup who did not require AVS [1].
- With regard to cut-off value of age for avoiding AVS, Lim et al. [8] reported that all six PA patients with spontaneous hypokalemia, PAC >30 ng/dL, and unilateral lesion on CT aged <35 years were accurately diagnosed on CT. Based on this report, the 2016 Endocrine Society clinical practice guidelines suggested that AVS could been omitted in this subgroup [1]. Umakoshi et al. [10] also showed that CT findings accurately diagnose unilateral form in 100.0% (30/30) of PA patients with hypokalemia, PAC >15.9 ng/dL, and unilateral lesion on CT aged <35 years. However, the present study showed that diagnostic accuracy of CT in those aged <35 years was 84.6% (11/13). We cannot determine the exact reason for the difference in diagnostic accuracy of CT in patients aged <35 years between the two previous studies [8,10] and the present study. However, only 90.0% (27/30) of PA patients with hypokalemia, PAC >15.9 ng/dL, and unilateral lesion on CT aged <35 years showed a concordance between CT and AVS in the study conducted by Umakoshi et al. [10]. Approximately 10.0% (3/30) of PA patients with discordance in the previous study who had an LI of 3–4 and contralateral aldosterone suppression on the AVS benefited from surgical management. In contrast, 15.4% (2/13) of PA patients with discordance in the present study had an LI 1.3–2.0 on AVS. In the present study, optimal cut-off value for age for concordant diagnosis between CT and AVS in patients with marked PA and unilateral lesion on CT was <50 years. Patients with the same findings but aged <50 years (90.9%) had higher diagnostic accuracy of CT than those aged ≥50 years (79.8%). As diagnostic concordance rate between CT and AVS findings was 11 of 13 (84.6%) PA patients with hypokalemia, PAC >15.9 ng/dL, and unilateral lesion on CT aged <35 years, our results could not lead to the conclusion that the cut-off value for age to bypass AVS before proceeding to unilateral adrenalectomy was <35 years, suggested by 2016 Endocrine Society clinical practice guideline [1] and validated by JPAS [10] .
- Interestingly, optimal cut-off value of PAC for concordant diagnosis between CT and AVS in patients with marked PA and unilateral lesion on CT was 29.6 ng/dL, similar to >30.0 ng/dL in the previous study by Lim et al. [8] Furthermore, there was no significant difference in the diagnostic accuracy of CT in patients with hypokalemia, PAC >30.0 ng/dL, and unilateral lesion on CT according to age (<35, 35–39, 40–49, and ≥50 years). In the PA group with hypokalemia, PAC >15.9 ng/dL, and unilateral lesion on CT, there was also a significant difference in diagnostic accuracy of CT in patients aged 35 to 39 years between our study (100.0%, 22/22) and a previous one by Umakoshi et al. [10] (79.5%, 31/39, P=0.024). We cannot determine the exact reason for difference in the diagnostic accuracy of CT in these PA patients 35 to 39 years, PAC was significantly higher in patients with PA aged <35 years (median, 41.5 ng/dL; IQR, 28.3 to 62.1) than in those aged 35 to 39 years (median, 27.7 ng/dL; IQR, 20.7 to 39.3) in the previous study [10] but not in the present study. This finding might be subsidiary reasons. These results suggest that markedly elevated PAC (>30.0 ng/dL), besides hypokalemia and unilateral lesion on CT, could be useful for predicting the subtype of PA, regardless of age. Despite PAC >30.0 ng/dL, hypokalemia, and unilateral lesion on CT as useful predictors for subtype of PA, diagnostic concordance rate between CT and AVS findings of 68 of 74 (91.9%) in these patients lead to the need of further multicenter study to investigate the combination of clinical predictors for bypassing AVS using surgical outcome data.
- Overall diagnostic concordance rate between CT and AVS was 64.4%. This finding was in line with the previous result of 62.2% reported in a systematic review (n=951) [6] and 68.1% reported in JPAS (n=1,591) [10]. Percentages of unilateral PA on AVS were higher in patients with unilateral lesion than in those with bilateral normal results on CT (267/372, 71.8% vs. 19/55, 34.5%, respectively; P<0.001). Patients with unilateral lesion and hypokalemia also had higher prevalence of unilateral PA on AVS than those with unilateral lesion on CT and normokalemia (182/207, 87.9% vs. 85/165, 51.5%, respectively; P<0.001). This finding is in the line with previous results from JPAS. Our study indicated that the prevalence of unilateral PA on AVS was higher in patients with unilateral disease than in those with bilateral normal results on CT (50.8% vs. 14.6%, respectively; P<0.001). Moreover, prevalence of unilateral PA on AVS was higher in those with unilateral lesion on CT and hypokalemia than in those with the CT findings and normokalemia (70.6% vs. 23.8%, respectively; P<0.001) [27]. However, there was a difference between the results of our study and the previous report [27] in terms of diagnostic accuracy of CT in patients with unilateral lesion on CT (71.8% vs. 50.8%, P<0.001) and in patients with the same lesion and hypokalemia (87.9% vs. 70.6%, respectively; P<0.001). This finding can be attributed to the different definitions of abnormal findings on CT as well as to differences in cut-off values and methodology of AVS between studies [28–30].
- Age, sex, BMI, serum potassium level, PAC, and ARR in univariate regression analysis and age, BMI, serum potassium level, and ARR in univariate regression analysis were associated with the unilateral PA in patients with unilateral lesion on CT. This finding was in line with the previous studies of association of age, sex, serum potassium, PAC, ARR, and CT imaging with PA subtype [8–10,12–19].
- Our study has several limitations. First, we analyzed diagnostic concordance between CT and AVS, but not surgical outcomes data using clinical and biochemical outcomes by the Primary Aldosteronism Surgical Outcome (PASO) consensus [31]. Williams et al. [11] showed inadequate diagnostic accuracy of CT for subtype diagnosis by the lower likelihood of complete biochemical success with CT-based surgery relative to AVS-based surgery. Considering that an outcome of partial or absent biochemical success after surgery indicates the preoperative misdiagnosis of bilateral PA as unilateral PA, further studies are therefore needed to analysis the diagnostic concordance between CT and surgical outcomes data. We used the surgical outcome data in PA patients with discordance of CT and AVS in those with hypokalemia, PAC>30.0 ng/dL, and unilateral lesion on CT and in PA patients with unilateral lesion on CT showed unilateral hyperaldosteronism by AVS finding on the contralateral adrenal gland. Although surgical outcomes could be a better indicator of the correct diagnosis of unilateral PA than AVS findings, the surgical indications of our patients who underwent unilateral adrenalectomy were heterogeneous, which is the nature of a retrospective multicenter study. An LI of >4 has a high specificity for diagnosis of unilateral PA as described in the clinical practice guidelines [1,5]; therefore, we believed that diagnostic concordance between CT and AVS could be applied in clinical practice. Second, it was a retrospective and observational study, which is well-associated with a risk of bias from residual confounders. Third, we excluded cases with intermediate LI values (3≤ LI ≤4) despite the use of more permissive LI values ranging from 2 to 4 in approximately one-half of the reference centers in the Adrenal Vein Sampling International Study [32].
- In conclusion, PA patients with hypokalemia, PAC >30.0 ng/dL, and unilateral lesion on CT had the possibility of having unilateral PA, regardless of age. However, further validation is needed to provide conclusive evidence to support the recent suggestion from the Endocrine Society guideline on the age cut-off value of <35 years in this subgroup to avoid AVS.
DISCUSSION
Supplementary Information
-
Acknowledgements
- This study was funded by the Asan Institute for Life Sciences, Seoul, Republic of Korea (project no. 2019IP0862) and the National Research Foundation of Korea by the Ministry of Science, ICT and Future Planning of Korea (NRF-2020R1C1-C1010723).
-
CONFLICTS OF INTEREST
No potential conflict of interest relevant to this article was reported.
-
AUTHOR CONTRIBUTIONS
Conception or design: S.H.L., J.H.K. Acquisition, analysis, or interpretation of data: S.H.L., J.W.K., H.K.Y., J.M.K., C.S.S., S.W.K., J.H.K. Drafting the work or revising: S.H.L. Final approval of the manuscript: S.H.L., J.W.K., H.K.Y., J.M.K., C.S.S., S.W.K., J.H.K.
Article information
| Variable | Total (n=466) | Unilateral lesion (n=372) | Bilateral normal (n=55) | Bilateral lesion (n=39) | P value |
|---|---|---|---|---|---|
| Age, yr | 51.0 (43.0–59.0) | 51.0 (43.5–59.0) | 47.0 (36.0–60.5) | 58.0 (51.0–64.0)b,c | 0.003 |
| Female sex | 231 (49.6) | 189 (50.8) | 28 (50.9) | 14 (35.9) | 0.204 |
| Height, cm | 163.7 (157.6–170.0) | 163.3 (157.4–169.8) | 163.3 (156.2–170.9) | 167.6 (160.2–172.4) | 0.145 |
| Weight, kg | 67.4 (57.9–76.5) | 67.1 (57.3–76.1) | 66.0 (57.2–75.8) | 71.5 (64.5–80.1) | 0.077 |
| BMI, kg/m2 | 25.2 (22.7–27.3) | 25.2 (22.6–27.2) | 24.6 (22.3–26.7) | 25.9 (24.1–28.0) | 0.122 |
| Systolic BP, mm Hg | 142.0 (131.0–156.0) | 142.0 (132.0–155.0) | 150.0 (131.5–160.0) | 135.0 (125.5–153.5) | 0.082 |
| Diastolic BP, mm Hg | 90.0 (81.0–98.0) | 90.0 (81.0–97.0) | 91.0 (81.0–100.0) | 87.0 (77.5–97.0) | 0.262 |
| Antihypertensive drug, DDD | 2.0 (1.0–3.4) | 2.0 (1.0–3.5) | 1.0 (0.0–2.7)a | 2.0 (1.0–3.5) | 0.039 |
| eGFR, mL/min/1.73 m2 | 88.3 (75.2–104.5) | 88.0 (75.8–103.5) | 90.1 (74.8–107.3) | 84.7 (73.5–110.2) | 0.838 |
| Serum potassium, mEq/L | 3.4 (3.0–4.0) | 3.3 (2.9–3.9) | 3.9 (3.5–4.2)a | 3.6 (3.0; 4.2) | <0.001 |
| Hypokalemia | 228 (51.1) | 207 (55.6) | 12 (21.8)a | 19 (48.7)c | <0.001 |
| PAC, ng/dL | 30.5 (23.4–45.2) | 31.3 (24.1–47.2) | 26.3 (19.7–34.0)a | 28.9 (21.9;41.9) | 0.001 |
| PRA, ng/mL/hr | 0.2 (0.1–0.4) | 0.2 (0.1–0.4) | 0.2 (0.1–0.5) | 0.2 (0.2–0.3) | 0.321 |
| ARR, ng/dL per ng/mL/hr | 146.5 (75.3–300.0) | 163.0 (76.2–320.5) | 96.0 (57.9–192.6)a | 130.0 (91.0–239.2) | 0.012 |
| Nodule size on CT, cm | 1.5 (1.1–1.8) | 1.5 (1.1–1.8) | NA | 1.5 (1.1–1.8) | 0.182 |
Values are expressed as median (interquartile range) or number (%). α<0.017 was considered to be statistically significant after post hoc Bonferroni correction for multiple testing (α=0.05/3=0.0167).
a α<0.017 unilateral lesion vs. bilateral normal;
b α<0.017 unilateral lesion vs. bilateral lesion;
c α<0.017 bilateral normal vs. bilateral lesion.
CT, computed tomography; BMI, body mass index; BP, blood pressure; DDD, defined daily dose; eGFR, estimated glomerular filtration rate; PAC, plasma aldosterone concentration; PRA, plasma renin activity; ARR, aldosterone-to-renin ratio; NA, not applicable.
Values are expressed as median (interquartile range) or number (%).
CT, computed tomography; OR, odds ratio; CI, confidence interval; NA, not applicable; BMI, body mass index; BP, blood pressure; DDD, defined daily dose; eGFR, estimated glomerular filtration rate; PAC, plasma aldosterone concentration; PRA, plasma renin activity; ARR, aldosterone-to-renin ratio.
| Variable | Age, yr (<35, 35–39, 40–49, ≥50) | Age, yr (<50, ≥50) | ||||||
|---|---|---|---|---|---|---|---|---|
|
|
|
|||||||
| <35 (n=13) | 35–39 (n=20) | 40–49 (n=66) | ≥50 (n=99) | P value | <50 (n=99) | ≥50 (n=99) | P value | |
| Age, yr | 33.0 (31.0–33.0) | 38.0a (36.5–39.0) | 45.0 (43.0–47.0) | 58.0b (53.0–63.0) | <0.001 | 43.0 (38.0–46.0) | 58.0 (53.0–63.0) | <0.001 |
|
|
||||||||
| Female sex | 10 (76.9) | 8 (40.0) | 33 (50.0) | 52 (52.5) | 0.212 | 51 (51.5) | 52 (52.5) | >0.999 |
|
|
||||||||
| Height, cm | 166.7 (163.0–169.0) | 168.1 (164.0–172.9) | 165.2 (159.6–172.0) | 161.0 (154.3–165.5) | <0.001 | 166.7 (161.0–171.1) | 161.0 (154.3–165.5) | <0.001 |
|
|
||||||||
| Weight, kg | 58.0 (53.4–65.4) | 68.5a (58.5–77.3) | 66.2 (57.6–74.8) | 65.3 (56.3–73.1) | 0.152 | 66.0 (57.5–74.8) | 65.3 (56.3–73.1) | 0.294 |
|
|
||||||||
| BMI, kg/m2 | 21.2 (19.7–25.9) | 23.6 (22.3–27.5) | 24.5 (21.9–25.8) | 24.5 (22.7–26.8) | 0.129 | 24.0 (21.7–26.1) | 24.5 (22.7–26.8) | 0.191 |
|
|
||||||||
| Systolic BP, mm Hg | 142.0 (123.0–146.0) | 150.0 (131.0–162.5) | 146.0 (139.0–160.0) | 140.0 (130.5–155.0) | 0.055 | 145.0 (137.5–160.0) | 140.0 (130.5–155.0) | 0.033 |
|
|
||||||||
| Diastolic BP, mm Hg | 93.0 (84.0–108.0) | 98.0 (82.5–109.5) | 95.5 (90.0–101.0) | 89.0 (80.0–95.0) | <0.001 | 95.0 (89.0–104.5) | 89.0 (80.0–95.0) | <0.001 |
|
|
||||||||
| Anti-hypertensive drugs, DDD | 1.0 (0.0–3.0) | 2.0 (1.2–3.1) | 2.3 (1.0–3.5) | 3.0 (1.7–4.0) | 0.043 | 2.0 (1.0–3.3) | 3.0 (1.7–4.0) | 0.009 |
|
|
||||||||
| eGFR, mL/min/1.73 m2 | 94.4 (90.1–103.2) | 93.0 (76.5–116.0) | 91.4 (77.5–110.2) | 81.5 (66.1–95.4) | 0.005 | 92.4 (77.7–111.2) | 81.5 (66.1–95.4) | <0.001 |
|
|
||||||||
| Serum potassium, mEq/L | 2.8 (2.6–3.0) | 3.1a (2.8–3.3) | 2.9 (2.7–3.1) | 3.0 (2.7–3.2) | 0.074 | 2.9 (2.7–3.1) | 3.0 (2.7–3.2) | 0.465 |
|
|
||||||||
| PAC, ng/dL | 51.2 (40.5–76.4) | 48.1 (23.6–58.5) | 46.8 (31.4–69.9) | 37.5 (28.1–48.8) | 0.009 | 48.5 (30.5–68.0) | 37.5 (28.1–48.8) | 0.003 |
|
|
||||||||
| PRA, ng/mL/hr | 0.3 (0.1–0.3) | 0.1 (0.1–0.3) | 0.2 (0.1–0.3) | 0.1 (0.1–0.2) | 0.305 | 0.2 (0.1–0.3) | 0.1 (0.1–0.2) | 0.153 |
|
|
||||||||
| ARR, ng/dL per ng/mL/hr | 238.8 (135.0–447.5) | 272.5 (99.2–576.0) | 268.5 (129.2–519.0) | 236.0 (141.3–395.5) | 0.736 | 267.0 (126.7–515.5) | 236.0 (141.3–395.5) | 0.261 |
|
|
||||||||
| Nodule size on CT, cm | 1.5 (1.3–1.6) | 1.5 (1.0–2.0) | 1.8 (1.4–2.3) | 1.5b (1.1–1.8) | 0..001 | 1.6 (1.3–2.0) | 1.5 (1.1–1.8) | 0.001 |
Values are expressed as median (interquartile range) or number (%).
PA, primary aldosteronism; PAC, plasma aldosterone concentration; CT, computed tomography; BMI, body mass index; BP, blood pressure; DDD, defined daily dose; eGFR, estimated glomerular filtration rate; PRA, plasma renin activity; ARR, aldosterone-to-renin ratio.
a P<0.05, PA patients between ages <35 and 35–39 years with marked PA (e.g., hypokalemia and PAC >15.9 ng/dL) and unilateral adrenal lesion on CT;
b P<0.05, PA patients between ages <40 and 40–49 years with marked PA (e.g., hypokalemia and PAC >15.9 ng/dL) and unilateral adrenal lesion on CT.
- 1. Funder JW, Carey RM, Mantero F, Murad MH, Reincke M, Shibata H, et al. The management of primary aldosteronism: case detection, diagnosis, and treatment: an endocrine society clinical practice guideline. J Clin Endocrinol Metab 2016;101:1889–916.ArticlePubMed
- 2. Mulatero P, Monticone S, Bertello C, Viola A, Tizzani D, Iannaccone A, et al. Long-term cardio- and cerebrovascular events in patients with primary aldosteronism. J Clin Endocrinol Metab 2013;98:4826–33.ArticlePubMed
- 3. Reincke M, Fischer E, Gerum S, Merkle K, Schulz S, Pallauf A, et al. Observational study mortality in treated primary aldosteronism: the German Conn’s registry. Hypertension 2012;60:618–24.ArticlePubMed
- 4. Savard S, Amar L, Plouin PF, Steichen O. Cardiovascular complications associated with primary aldosteronism: a controlled cross-sectional study. Hypertension 2013;62:331–6.ArticlePubMed
- 5. Monticone S, Viola A, Rossato D, Veglio F, Reincke M, Gomez-Sanchez C, et al. Adrenal vein sampling in primary aldosteronism: towards a standardised protocol. Lancet Diabetes Endocrinol 2015;3:296–303.ArticlePubMed
- 6. Kempers MJ, Lenders JW, van Outheusden L, van der Wilt GJ, Schultze Kool LJ, Hermus AR, et al. Systematic review: diagnostic procedures to differentiate unilateral from bilateral adrenal abnormality in primary aldosteronism. Ann Intern Med 2009;151:329–37.ArticlePubMed
- 7. Ladurner R, Sommerey S, Buechner S, Dietz A, Degenhart C, Hallfeldt K, et al. Accuracy of adrenal imaging and adrenal venous sampling in diagnosing unilateral primary aldosteronism. Eur J Clin Invest 2017;47:372–7.ArticlePubMed
- 8. Lim V, Guo Q, Grant CS, Thompson GB, Richards ML, Farley DR, et al. Accuracy of adrenal imaging and adrenal venous sampling in predicting surgical cure of primary aldosteronism. J Clin Endocrinol Metab 2014;99:2712–9.ArticlePubMed
- 9. Mulatero P, Bertello C, Rossato D, Mengozzi G, Milan A, Garrone C, et al. Roles of clinical criteria, computed tomography scan, and adrenal vein sampling in differential diagnosis of primary aldosteronism subtypes. J Clin Endocrinol Metab 2008;93:1366–71.ArticlePubMed
- 10. Umakoshi H, Ogasawara T, Takeda Y, Kurihara I, Itoh H, Katabami T, et al. Accuracy of adrenal computed tomography in predicting the unilateral subtype in young patients with hypokalaemia and elevation of aldosterone in primary aldosteronism. Clin Endocrinol (Oxf) 2018;88:645–51.ArticlePubMed
- 11. Williams TA, Burrello J, Sechi LA, Fardella CE, Matrozova J, Adolf C, et al. Computed tomography and adrenal venous sampling in the diagnosis of unilateral primary aldosteronism. Hypertension 2018;72:641–9.ArticlePubMed
- 12. Riester A, Fischer E, Degenhart C, Reiser MF, Bidlingmaier M, Beuschlein F, et al. Age below 40 or a recently proposed clinical prediction score cannot bypass adrenal venous sampling in primary aldosteronism. J Clin Endocrinol Metab 2014;99:E1035–9.ArticlePubMed
- 13. Nanba K, Tsuiki M, Nakao K, Nanba A, Usui T, Tagami T, et al. A subtype prediction score for primary aldosteronism. J Hum Hypertens 2014;28:716–20.ArticlePubMed
- 14. Kupers EM, Amar L, Raynaud A, Plouin PF, Steichen O. A clinical prediction score to diagnose unilateral primary aldosteronism. J Clin Endocrinol Metab 2012;97:3530–7.ArticlePubMed
- 15. Kocjan T, Janez A, Stankovic M, Vidmar G, Jensterle M. A new clinical prediction criterion accurately determines a subset of patients with bilateral primary aldosteronism before adrenal venous sampling. Endocr Pract 2016;22:587–94.ArticlePubMed
- 16. Kobayashi H, Haketa A, Ueno T, Ikeda Y, Hatanaka Y, Tanaka S, et al. Scoring system for the diagnosis of bilateral primary aldosteronism in the outpatient setting before adrenal venous sampling. Clin Endocrinol (Oxf) 2017;86:467–72.ArticlePubMed
- 17. Kobayashi H, Abe M, Soma M, Takeda Y, Kurihara I, Itoh H, et al. Development and validation of subtype prediction scores for the workup of primary aldosteronism. J Hypertens 2018;36:2269–76.ArticlePubMed
- 18. Kamemura K, Wada N, Ichijo T, Matsuda Y, Fujii Y, Kai T, et al. Significance of adrenal computed tomography in predicting laterality and indicating adrenal vein sampling in primary aldosteronism. J Hum Hypertens 2017;31:195–9.ArticlePubMed
- 19. Burrello J, Burrello A, Pieroni J, Sconfienza E, Forestiero V, Rabbia P, et al. Development and validation of prediction models for subtype diagnosis of patients with primary aldosteronism. J Clin Endocrinol Metab 2020;105:dgaa379.ArticlePubMed
- 20. Park KS, Kim JH, Yang YS, Hong AR, Lee DH, Moon MK, et al. Outcomes analysis of surgical and medical treatments for patients with primary aldosteronism. Endocr J 2017;64:623–32.ArticlePubMed
- 21. Kim BJ, Kwak MK, Ahn SH, Kim H, Lee SH, Koh JM. Lower trabecular bone score in patients with primary aldosteronism: human skeletal deterioration by aldosterone excess. J Clin Endocrinol Metab 2018;103:615–21.ArticlePubMed
- 22. Shin SY, Park YR, Shin Y, Choi HJ, Park J, Lyu Y, et al. A de-identification method for bilingual clinical texts of various note types. J Korean Med Sci 2015;30:7–15.ArticlePubMed
- 23. Levey AS, Bosch JP, Lewis JB, Greene T, Rogers N, Roth D. A more accurate method to estimate glomerular filtration rate from serum creatinine: a new prediction equation. Modification of Diet in Renal Disease Study Group. Ann Intern Med 1999;130:461–70.ArticlePubMed
- 24. WHO Collaborating Centre for Drug Statistics Methodology, Norwegian Institute of Public Health, World Health Organization. ATC/DDD index 2021. [Internet] Oslo: World Health Organization Collaborating Centre for Drug Statistics Methodology; 2020 [cited 2021 Feb 1]. Available from: https://www.whocc.no/atc_ddd_index/ .
- 25. Vincent JM, Morrison ID, Armstrong P, Reznek RH. The size of normal adrenal glands on computed tomography. Clin Radiol 1994;49:453–5.ArticlePubMed
- 26. Perkins NJ, Schisterman EF. The Youden index and the optimal cut-point corrected for measurement error. Biom J 2005;47:428–41.ArticlePubMed
- 27. Umakoshi H, Tsuiki M, Takeda Y, Kurihara I, Itoh H, Katabami T, et al. Significance of computed tomography and serum potassium in predicting subtype diagnosis of primary aldosteronism. J Clin Endocrinol Metab 2018;103:900–8.ArticlePubMed
- 28. Omura M, Sasano H, Saito J, Yamaguchi K, Kakuta Y, Nishikawa T. Clinical characteristics of aldosterone-producing microadenoma, macroadenoma, and idiopathic hyperaldosteronism in 93 patients with primary aldosteronism. Hypertens Res 2006;29:883–9.ArticlePubMed
- 29. Satoh F, Abe T, Tanemoto M, Nakamura M, Abe M, Uruno A, et al. Localization of aldosterone-producing adrenocortical adenomas: significance of adrenal venous sampling. Hypertens Res 2007;30:1083–95.ArticlePubMed
- 30. Young WF, Stanson AW, Thompson GB, Grant CS, Farley DR, van Heerden JA. Role for adrenal venous sampling in primary aldosteronism. Surgery 2004;136:1227–35.ArticlePubMed
- 31. Williams TA, Lenders JWM, Mulatero P, Burrello J, Rottenkolber M, Adolf C, et al. Outcomes after adrenalectomy for unilateral primary aldosteronism: an international consensus on outcome measures and analysis of remission rates in an international cohort. Lancet Diabetes Endocrinol 2017;5:689–99.ArticlePubMedPMC
- 32. Rossi GP, Barisa M, Allolio B, Auchus RJ, Amar L, Cohen D, et al. The Adrenal Vein Sampling International Study (AVIS) for identifying the major subtypes of primary aldosteronism. J Clin Endocrinol Metab 2012;97:1606–14.ArticlePubMed
References
Figure & Data
References
Citations
- Predicting Bilateral Subtypes of Primary Aldosteronism Without Adrenal Vein Sampling: A Systematic Review and Meta-analysis
Elisabeth Ng, Stella May Gwini, Winston Zheng, Peter J Fuller, Jun Yang
The Journal of Clinical Endocrinology & Metabolism.2024; 109(2): e837. CrossRef - Subtype-specific Body Composition and Metabolic Risk in Patients With Primary Aldosteronism
Seung Shin Park, Chang Ho Ahn, Sang Wan Kim, Ji Won Yoon, Jung Hee Kim
The Journal of Clinical Endocrinology & Metabolism.2024; 109(2): e788. CrossRef - Imaging Concordance With Vein Sampling for Primary Aldosteronism: A Cohort Study and Literature Review
Sara Cartwright, MaKayla Gordon, Jessica Shank, Abbey Fingeret
Journal of Surgical Research.2024; 296: 1. CrossRef - Best Practices: Indications and Procedural Controversies of Adrenal Vein Sampling for Primary Aldosteronism
Keith B. Quencer, Abhilasha Singh, Anu Sharma
American Journal of Roentgenology.2023; 220(2): 190. CrossRef - Accuracy of Gallium-68 Pentixafor Positron Emission Tomography–Computed Tomography for Subtyping Diagnosis of Primary Aldosteronism
Jinbo Hu, Tingting Xu, Hang Shen, Ying Song, Jun Yang, Aipin Zhang, Haoyuan Ding, Naiguo Xing, Zhuoyuan Li, Lin Qiu, Linqiang Ma, Yi Yang, Zhengping Feng, Zhipeng Du, Wenwen He, Yue Sun, Jun Cai, Qifu Li, Yue Chen, Shumin Yang, Mei Mei, Suxin Luo, Kangla
JAMA Network Open.2023; 6(2): e2255609. CrossRef - Adrenal Vein Sampling in the Young – Necessary or
Not?
Eleftheria Gkaniatsa, Oskar Ragnarsson
Experimental and Clinical Endocrinology & Diabetes.2023; 131(07/08): 435. CrossRef - 2023 Korean Endocrine Society Consensus Guidelines for the Diagnosis and Management of Primary Aldosteronism
Jeonghoon Ha, Jung Hwan Park, Kyoung Jin Kim, Jung Hee Kim, Kyong Yeun Jung, Jeongmin Lee, Jong Han Choi, Seung Hun Lee, Namki Hong, Jung Soo Lim, Byung Kwan Park, Jung-Han Kim, Kyeong Cheon Jung, Jooyoung Cho, Mi-kyung Kim, Choon Hee Chung
Endocrinology and Metabolism.2023; 38(6): 597. CrossRef - Correlation of Histopathologic Subtypes of Primary Aldosteronism with Clinical Phenotypes and Postsurgical Outcomes
Chang Ho Ahn, You-Bin Lee, Jae Hyeon Kim, Young Lyun Oh, Jung Hee Kim, Kyeong Cheon Jung
The Journal of Clinical Endocrinology & Metabolism.2023;[Epub] CrossRef - Indices of ACTH‐stimulated adrenal venous sampling as predictors of postsurgical outcomes in primary aldosteronism
Seung Hun Lee, Jong Woo Kim, Hyun‐Ki Yoon, Sang Wan Kim, Su Jin Kim, Kyu Eun Lee, Yu‐Mi Lee, Tae‐Yon Sung, Suck Joon Hong, Chan Soo Shin, Jung‐Min Koh, Jung Hee Kim
Clinical Endocrinology.2022; 96(4): 521. CrossRef - Expression of CYP11B1 and CYP11B2 in adrenal adenoma correlates with clinical characteristics of primary aldosteronism
Chang Ho Ahn, Hee Young Na, So Yeon Park, Hyeong Won Yu, Su‐Jin Kim, June Young Choi, Kyu Eun Lee, Sang Wan Kim, Kyeong Cheon Jung, Jung Hee Kim
Clinical Endocrinology.2022; 96(1): 30. CrossRef - Letter to the Editor From Singhania et al: “Increasing Incidence of Primary Aldosteronism in Western Sweden During 3 Decades—Yet an Underdiagnosed Disorder”
Pankaj Singhania, Rana Bhattacharjee
The Journal of Clinical Endocrinology & Metabolism.2022; 107(3): e1315. CrossRef - Development and validation of model for sparing adrenal venous sampling in diagnosing unilateral primary aldosteronism
Ying Song, Jun Yang, Hang Shen, Elisabeth Ng, Peter J. Fuller, Zhengping Feng, Jinbo Hu, Linqiang Ma, Yi Yang, Zhipeng Du, Yue Wang, Ting Luo, Wenwen He, Qifu Li, Fei-Fei Wu, Shumin Yang
Journal of Hypertension.2022; 40(9): 1692. CrossRef - Validation of Existing Clinical Prediction Tools for Primary Aldosteronism Subtyping
Barbora Kološová, Petr Waldauf, Dan Wichterle, Jan Kvasnička, Tomáš Zelinka, Ondřej Petrák, Zuzana Krátká, Lubomíra Forejtová, Jan Kaván, Jiří Widimský, Robert Holaj
Diagnostics.2022; 12(11): 2806. CrossRef - Fully automatic volume measurement of the adrenal gland on CT using deep learning to classify adrenal hyperplasia
Taek Min Kim, Seung Jae Choi, Ji Yeon Ko, Sungwan Kim, Chang Wook Jeong, Jeong Yeon Cho, Sang Youn Kim, Young-Gon Kim
European Radiology.2022; 33(6): 4292. CrossRef - Diagnostic Accuracy of Computed Tomography in Predicting Primary Aldosteronism Subtype According to Age (Endocrinol Metab 2021;36:401-12, Seung Hun Lee et al.)
Seung Hun Lee, Jong Woo Kim, Hyun-Ki Yoon, Jung-Min Koh, Chan Soo Shin, Sang Wan Kim, Jung Hee Kim
Endocrinology and Metabolism.2021; 36(4): 914. CrossRef - Diagnostic Accuracy of Computed Tomography in Predicting Primary Aldosteronism Subtype According to Age (Endocrinol Metab 2021;36:401-12, Seung Hun Lee et al.)
Pankaj Singhania
Endocrinology and Metabolism.2021; 36(4): 912. CrossRef
 PubReader
 ePub Link
 Cite
Cite