Articles
- Page Path
- HOME > Endocrinol Metab > Volume 36(5); 2021 > Article
-
Original ArticleDiabetes, Obesity and Metabolism Changes in Insulin Resistance Index and the Risk of Liver Fibrosis in Patients with Nonalcoholic Fatty Liver Disease without Diabetes: Kangbuk Samsung Health Study
-
Dae-Jeong Koo1
 , Mi Yeon Lee2, Inha Jung3, Sun Joon Moon3, Hyemi Kwon3, Se Eun Park3, Eun-Jung Rhee3, Won-Young Lee3
 -
Endocrinology and Metabolism 2021;36(5):1016-1028.
DOI: https://doi.org/10.3803/EnM.2021.1110
Published online: October 21, 2021
1Division of Endocrinology and Metabolism, Department of Internal Medicine, Changwon Fatima Hospital, Changwon, Korea
2Division of Biostatistics, Department of R&D Management, Kangbuk Samsung Hospital, Sungkyunkwan University School of Medicine, Seoul, Korea
3Division of Endocrinology and Metabolism, Department of Internal Medicine, Kangbuk Samsung Hospital, Sungkyunkwan University School of Medicine, Seoul, Korea
- Corresponding authors: Eun-Jung Rhee. Division of Endocrinology and Metabolism, Department of Internal Medicine, Kangbuk Samsung Hospital, Sungkyunkwan University School of Medicine, 29 Saemunan-ro, Jongno-gu, Seoul 03181, Korea, Tel: +82-2-2001-2485, Fax: +82-2-2001-2049, E-mail: hongsiri@hanmail.net.
- Won-Young Lee. Division of Endocrinology and Metabolism, Department of Internal Medicine, Kangbuk Samsung Hospital, Sungkyunkwan University School of Medicine, 29 Saemunan-ro, Jongno-gu, Seoul 03181, Korea, Tel: +82-2-2001-2795, Fax: +82-2-2001-2049, E-mail: drlwy@hanmail.net
Copyright © 2021 Korean Endocrine Society
This is an Open Access article distributed under the terms of the Creative Commons Attribution Non-Commercial License (https://creativecommons.org/licenses/by-nc/4.0/) which permits unrestricted non-commercial use, distribution, and reproduction in any medium, provided the original work is properly cited.
ABSTRACT
-
Background
- Fibrosis is the most important prognostic factor for nonalcoholic fatty liver disease (NAFLD). Insulin resistance plays a key role of fibrosis progression. We evaluated the association between changes in homeostasis model assessment of insulin resistance (HOMA-IR) values and changes in fibrosis status in NAFLD.
-
Methods
- We analyzed the data of 15,728 participants with NAFLD (86% men, mean age 40.5 years) who had no diabetes at baseline and visited our centers for health check-ups both in 2012 and 2016. The participants were classified into four groups according to the degree of change in HOMA-IR values from baseline to the end of follow-up: G1 (<0), G2 (0–0.50), G3 (0.51–1.00), and G4 (>1.00). NAFLD was assessed by ultrasonography, and fibrosis status was evaluated by the NAFLD fibrosis score (NFS) and the aspartate aminotransferase to platelet ratio index (APRI).
-
Results
- After the 4-year follow-up, the multivariable-adjusted odds ratio (OR) for progression of fibrosis probability increased with increasing HOMA-IR values (OR, 2.25; 95% confidence interval [CI], 1.87 to 2.71 for NFS; and OR, 2.55; 95% CI, 2.05 to 3.18 for APRI, G4). This tendency remained consistent throughout the subgroup analyses, except in those for female sex and a body mass index <25 kg/m2. The OR for regression of fibrosis probability decreased with increasing HOMA-IR values (OR, 0.33; 95% CI, 0.25 to 0.43 for NFS, G4).
-
Conclusion
- Changes in HOMA-IR values were associated with changes in fibrosis status in patients with NAFLD without diabetes, which underscores the role of insulin resistance in liver fibrosis.
- Nonalcoholic fatty liver disease (NAFLD) is a disease that shows evidence of hepatic steatosis on imaging or biopsy studies, without significant liver disease caused by alcohol intake, use of drugs, or monogenic hereditary disorders, and it is the most common liver disease worldwide [1]. NAFLD is associated with increased mortality [2] and has clinical significance as an independent risk factor of cardiovascular disease as well as liver-related mortality [3–5]. Insulin resistance (IR) and inflammation play key roles in the development of NAFLD and the progression of fibrosis [6–9].
- The search for an optimal non-invasive surrogate marker to predict the progression or regression of liver fibrosis in patients with NAFLD among various biomarkers or metabolic parameters is attracting clinical interest. Clinical studies on the direct relationship between the homeostasis model assessment of insulin resistance (HOMA-IR) and fibrosis progression in patients with NAFLD have been carried out recently [10–14]. These studies usually evaluated the status of IR based on the HOMA-IR value at a specific time point, and the risk of liver fibrosis in patients with NAFLD was evaluated according to a fixed HOMA-IR value.
- However, NAFLD is not a simple disease confined to a specific condition, but comprises a spectrum of progressive liver conditions including steatosis, nonalcoholic steatohepatitis (NASH), fibrosis, and cirrhosis [15]. Patients with NAFLD show changes in physical conditions due to lifestyle modifications or weight changes in various environments during the disease period, resulting in changes in metabolic characteristics, such as changes in IR.
- Unlike previous studies, changes in HOMA-IR values during the follow-up period were measured, and participants were classified according to the degree of change. Then, the relative risk of fibrosis progression was analyzed using non-invasive fibrosis indices, such as the NAFLD fibrosis score (NFS) and aspartate aminotransferase to platelet ratio index (APRI), comparing changes from baseline values. In addition, it is well known that weight change and IR are closely related [16]. So, we performed a comparative study of the quantitative influence and qualitative validity of predicting changes in the status of liver fibrosis between the standardized quartile of changes in HOMA-IR and the standardized quartile of changes in body mass index (BMI).
INTRODUCTION
- Study population and design
- This cohort study included adult subjects aged over 20 years who visited the Total Healthcare Center of Kangbuk Samsung Hospital in Seoul and Suwon, South Korea, for regular health examinations between January 3, 2012, and December 31, 2016.
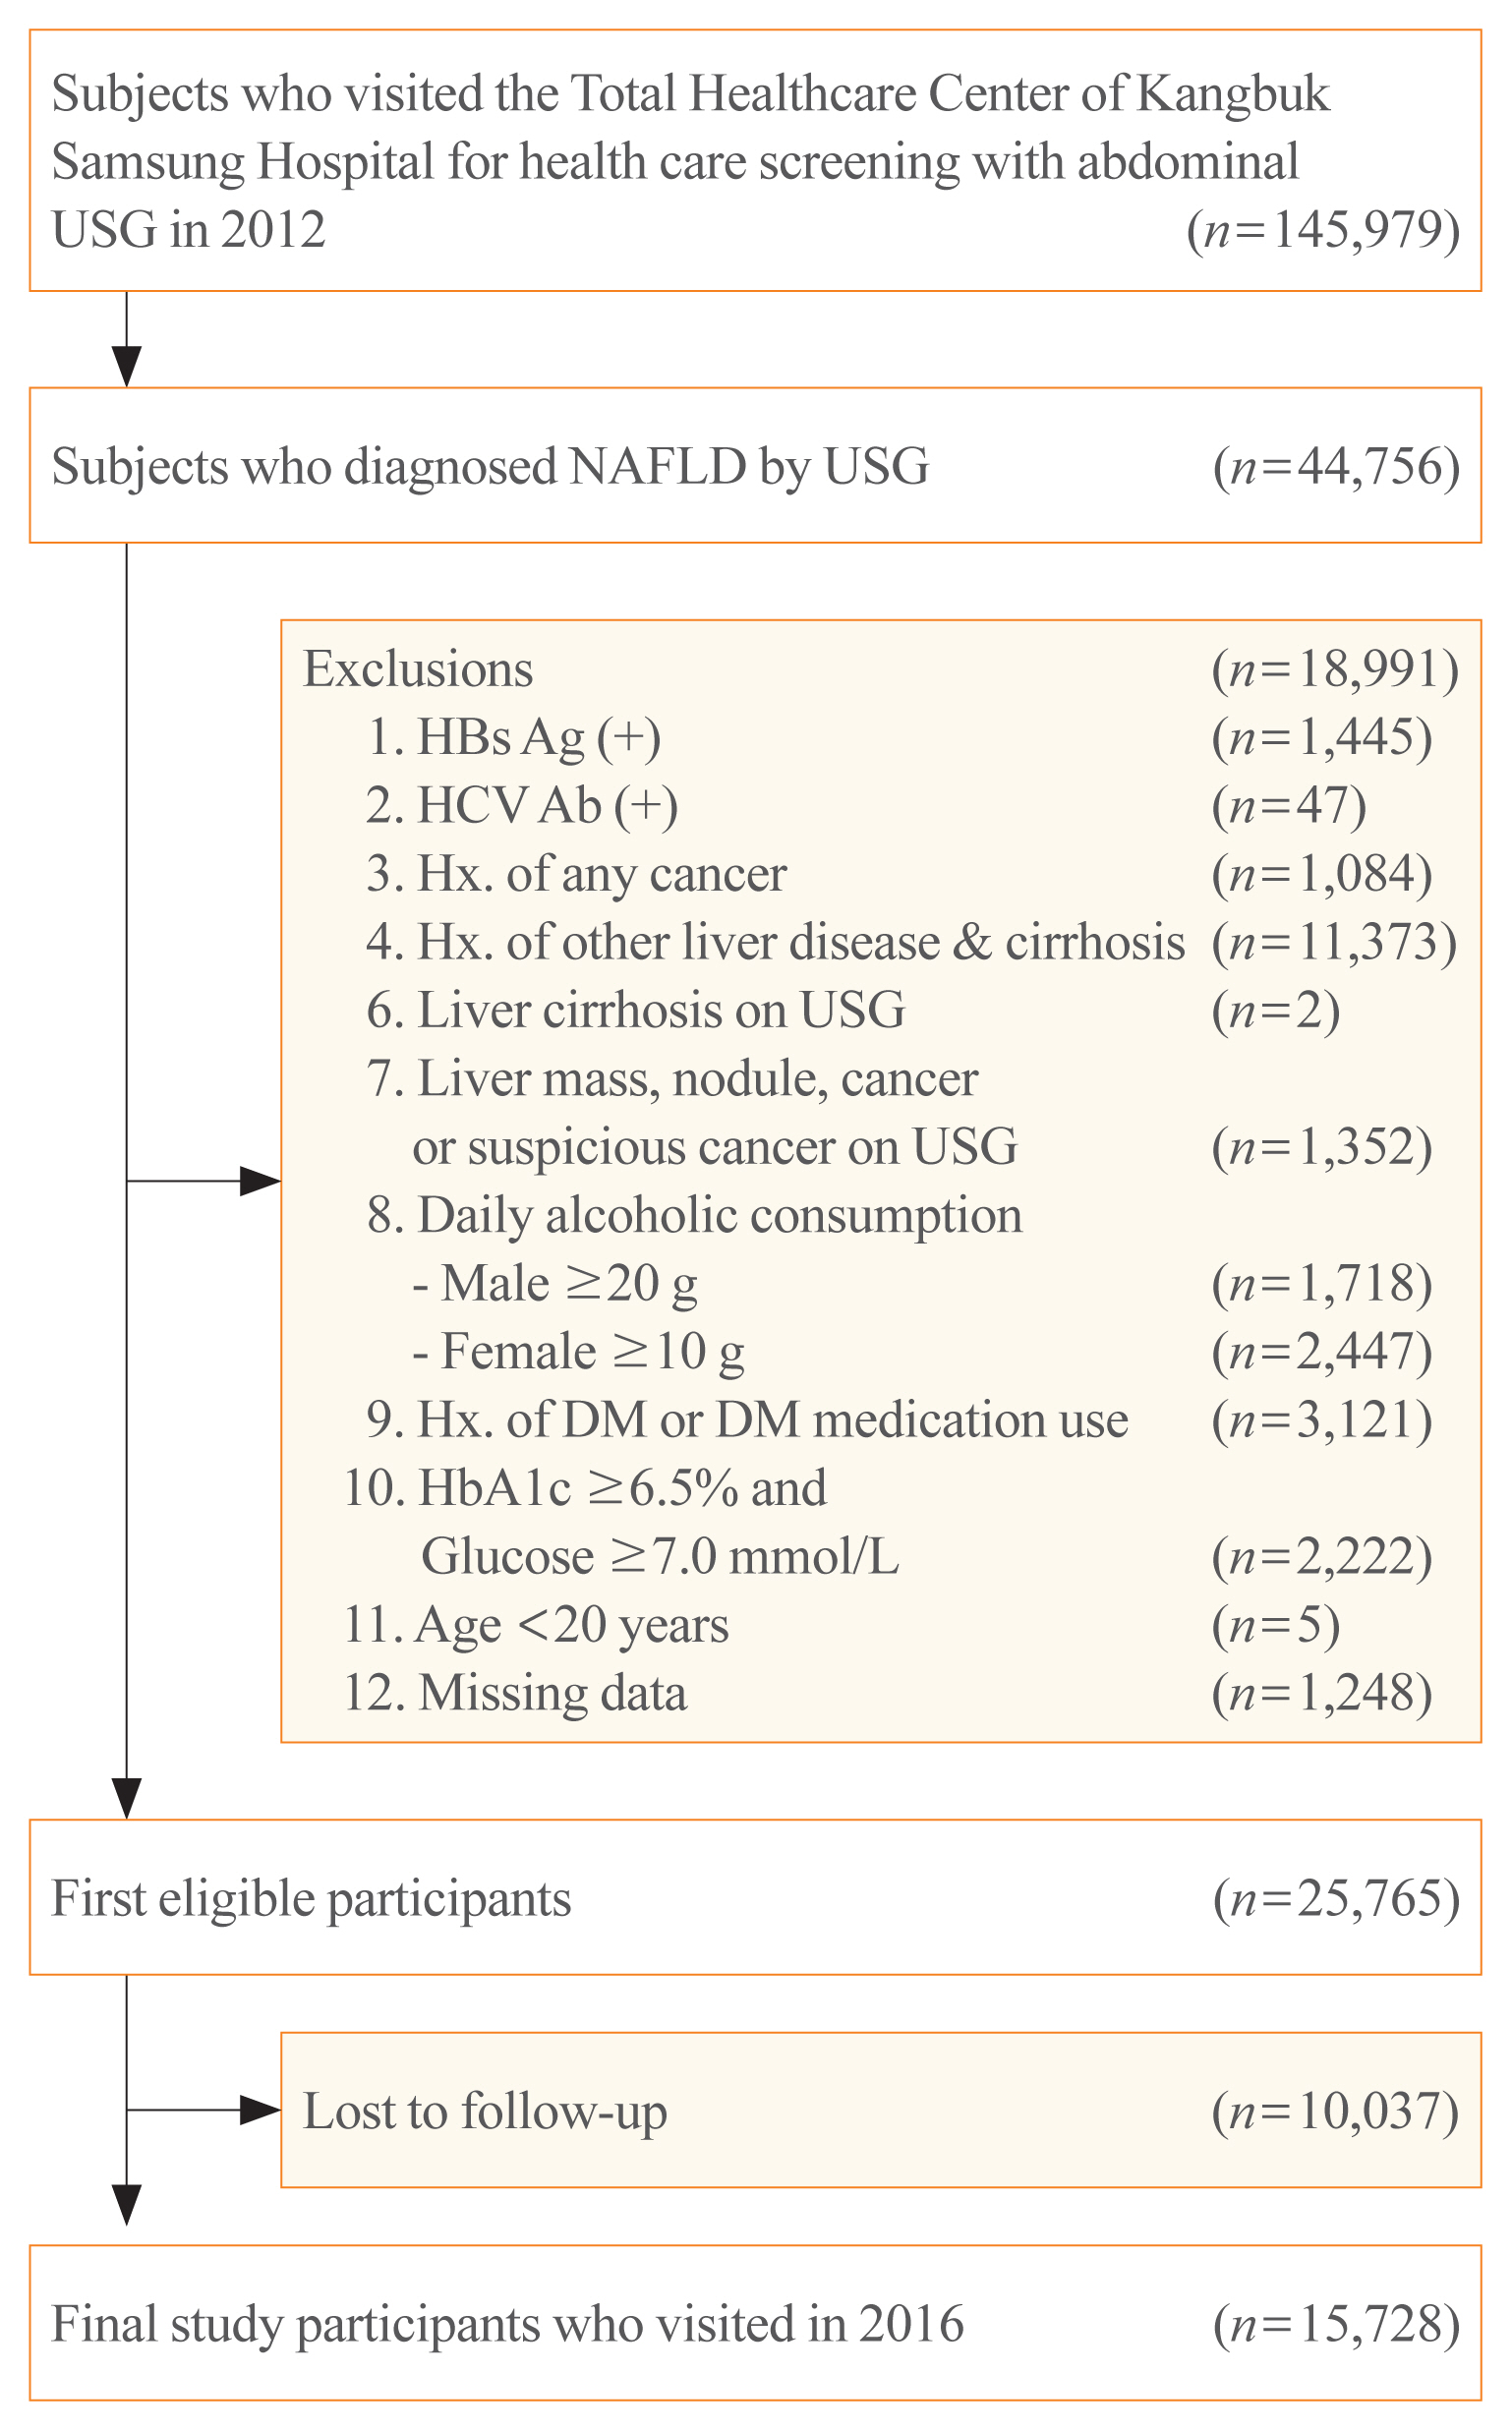
- In 2012, 145,979 subjects visited our center for health care screening and underwent abdominal ultrasonography (USG). Among them, 44,756 subjects were diagnosed with NAFLD by abdominal USG. Subjects who met any of the following criteria were excluded: positive findings for serologic markers of hepatitis B (n=1,445) or hepatitis C virus infection (n=47); history of cancer (n=1,084); history of other liver diseases and liver cirrhosis (n=11,373); liver cirrhosis on abdominal USG (n=2); liver mass, nodule, cancer, or suspicious cancer lesions on abdominal USG (n=1,352); daily alcohol intake of ≥20 g/day for men (n=1,718) and ≥10 g/day for women (n=2,447); history of diabetes or use of anti-diabetic medications (n=3,121); hemoglobin A1c (HbA1c) levels ≥6.5% and fasting glucose levels ≥7.0 mmol/L (126 mg/dL) (n=2,222); age <20 years (n=5); and missing data on components of NFS or APRI, HOMA-IR, or BMI (n=1,248). After the 4-year follow-up period, 10,037 subjects were lost. Finally, a total of 15,728 (men, 13,531) participants were selected for our study (Fig. 1). This study was approved by the Institutional Review Board of Kangbuk Samsung Hospital (KBSMC 202006110001), which waived the requirement for informed consent because we retrospectively accessed data from a de-identified database for our analysis.
- Anthropometric and laboratory measurements
- Information on medical history, alcohol consumption, smoking status, and exercise status was acquired through a self-administered questionnaire. The questionnaire was based on the 4th National Health and Nutrition Survey [17] and the Korean version of the International Physical Activity Questionnaire short form [18]. Alcohol intake was determined based on the average number of drinks per week, and the current smoking status was based on the response “yes” or “no.” Regular exercise was defined as moderate or high-intensity exercise performed more than three times a week. All biochemical tests and anthropometric measurements were performed by well-trained staff. For body weight measurements, the patients wore a thin gown, and BMI was calculated by dividing body weight (kg) by the square of height (m2). Blood pressure (BP) was measured on both arms at an interval of 1 minute or more in a sitting position using a standard sphygmomanometer in a stable state after sufficient rest, and the higher of the two values was determined as BP. If the systolic blood pressure (SBP) or diastolic blood pressure exceeded 140 or 90 mm Hg, respectively, the measurement was repeated after 5 minutes and the results were averaged. All blood samples were collected from the patients after an overnight fast of ≥12 hours. To assess fasting blood glucose and insulin levels, the hexokinase method (Modular D2400, Hitachi, Tokyo, Japan) and electrochemiluminescence immunoassay method were used (Modular E170, Hitachi), respectively. For the measurement of total cholesterol and triglyceride levels, the enzymatic colorimetric method was used. High-density lipoprotein cholesterol levels were measured by a selective inhibition method, and low-density lipoprotein cholesterol (LDL-C) levels were measured by the homogeneous enzymatic colorimetric test. An immunoturbidimetric assay (Cobra Integra 800 automatic analyzer, Roche Diagnostics, Basel, Switzerland) was conducted for measuring HbA1c levels. Aspartate transaminase (AST) and alanine aminotransferase (ALT) levels were measured using Bayer Reagent Packs on an automated chemistry analyzer (Advia 1650 autoanalyzer, Bayer Diagnostics, Leverkusen, Germany), and a nephelometric assay (BNII nephelometer, Dade Behring, Deerfield, IL, USA) carried out to measure high-sensitivity C-reactive protein (hs-CRP) levels. To determine IR, we used the HOMA-IR formula: HOMA-IR=[fasting insulin (μIU/mL)×fasting blood glucose (mmol/L)/22.5] [19].
- Diagnosis of NAFLD and advanced liver fibrosis
- Fatty liver was defined as a condition with evidence of hepatic steatosis on sonographic imaging, such as liver echogenicity higher than that of the renal cortex and spleen, attenuation of the ultrasound wave, loss of definition of the diaphragm, and poor delineation of the intrahepatic architecture [20]. An experienced radiologist who blinded to the purpose of this study evaluated fatty liver based on abdominal USG images (Logic Q700 MR, GE, Milwaukee, WI, USA). NAFLD was defined as fatty liver without other etiologies of hepatic steatosis described in the exclusion criteria [1].
- To assess the degree of liver fibrosis in participants with NAFLD, non-invasive predictive models such as the NFS [21] and APRI [22] were applied. The NFS and APRI were calculated using the following formulas: NFS=−1.675+0.037×age (years)+0.094×BMI (kg/m2)+1.13×impaired fasting glucose (IFG) or diabetes (yes=1, no=0)+0.99×AST/ALT–0.013×platelet (109/L)–0.66×albumin (g/dL); and APRI=[(AST/upper limit of normal)/platelet (109/L)]×100. The following cutoff values were used to determine the NFS category of advanced liver fibrosis: <−1.455 for low fibrosis probability, −1.455 to 0.676 for intermediate fibrosis probability, and >0.676 for high fibrosis probability [23,24]. The following cutoff values were applied to determine APRI category of advanced liver fibrosis: <0.5 for low fibrosis probability, 0.5 to 1.5 for intermediate fibrosis probability, and >1.5 for high fibrosis probability [24]. According to the non-invasive fibrosis indices, the case where the category of advanced liver fibrosis increases from baseline to follow-up was defined as ‘progression,’ and the opposite condition was defined as ‘regression.’
- Statistical analysis
- Metabolic characteristics of study participants were investigated according to groups based on the degree of HOMA-IR change: G1 (<0), G2 (0 to 0.50), G3 (0.51 to 1.00), and G4 (>1.00). To test for linear trends, category numbers were used as continuous variables in the regression analysis models.
- To estimate the odds ratio (OR) for the change (i.e., progression or regression) of fibrosis probability according to the degree of HOMA-IR change, multinomial logistic regression models were used. Confounders associated with development or progression of NAFLD were applied to the adjusted estimation [1,25–27]. Multivariable models were adjusted for age, sex, and center (Seoul or Suwon) (Model 1), followed by adjustment for SBP, regular exercise (≥3 times/week, <times/week, or unknown), current alcohol consumption (daily alcohol consumption ≥median value (12 g/day for men and 2 g/day for women), daily alcohol consumption <median value, or unknown), and smoking status (never, ex-, current, or unknown) (Model 2). Model 3 was additionally adjusted for BMI; waist circumference; and HbA1c, hs-CRP, LDL-C, and triglyceride levels. We applied further adjustment for new-onset diabetes as a time-varying covariate (Model 4) and baseline HOMA-IR (Model 5).
- We performed predefined subgroup analyses as follows: gender (male vs. female); BMI status (<25 kg/m2 vs. ≥25 kg/m2); exercise status (<3 times/week vs. ≥3 times/week); alcohol consumption (<median value vs. ≥median value of daily alcohol consumption for each gender); and lipid profile (normal vs. dyslipidemia). Likelihood ratio tests were applied for interactions between HOMA-IR change groups and characteristics of predefined subgroup.
- We also evaluated the OR for the change of fibrosis probability according to the standardized quartile of changes in HOMA-IR and the standardized quartile of changes in BMI to compare the OR per standard deviation (SD). A multivariate adjustment model was also implemented using the variables described above. To estimate the qualitative validity of predictive ability for changes in fibrosis probability, we calculated the Akaike information criterion (AIC).
- All reported two-tailed P values of <0.05 were considered statistically significant. All statistics were performed based on STATA version 16.1 (StataCorp., College Station, TX, USA).
METHODS
- General characteristics of study participants
- During the 4 years of follow-up, a total of 15,728 participants were analyzed in our study (mean age, 40.5±6.5 years; men, 86%). The baseline characteristics of the participants according to changes in HOMA-IR values are shown in Table 1. All groups had a higher proportion of men than women. More than half of the study participants had obesity as per the Asia-Pacific obesity criteria (BMI ≥25 kg/m2). In particular, the group with the largest increase in HOMA-IR values (G4) had the highest prevalence of obesity at baseline. The values of most metabolic parameters increased from G1 to G4. There were no significant differences in NFS and APRI among the HOMA-IR change groups at baseline. The highest baseline HOMA-IR was observed in the HOMA-IR reduction group (G1).
- Except for baseline NFS, there was little difference in overall metabolic parameters between the progression group and the regression group in NFS-based analysis. The median baseline NFS value of the NFS-progressed group was lower than that of the NFS-regressed group (−2.17±0.55 for progression, −1.12±0.35 for regression). Interestingly, the proportion of participants who exercised regularly in the NFS-progressed group was higher than in the NFS-regressed group. However, the proportion of smokers was higher in the NFS-progressed group (Supplemental Table S1). In APRI-based analysis, there were no significant differences in metabolic parameters between the two groups, except for AST, ALT, APRI, and HOMA-IR, but, contrary to expectations, those parameters were significantly higher in the APRI-regressed group. This is consistent with the fact that the baseline proportion of obese participants and the mean waist circumference were higher in the APRI-regressed group. There was no difference in regular exercise between the two groups, but the proportion of smokers in the APRI-progressed group was also higher (Supplemental Table S2).
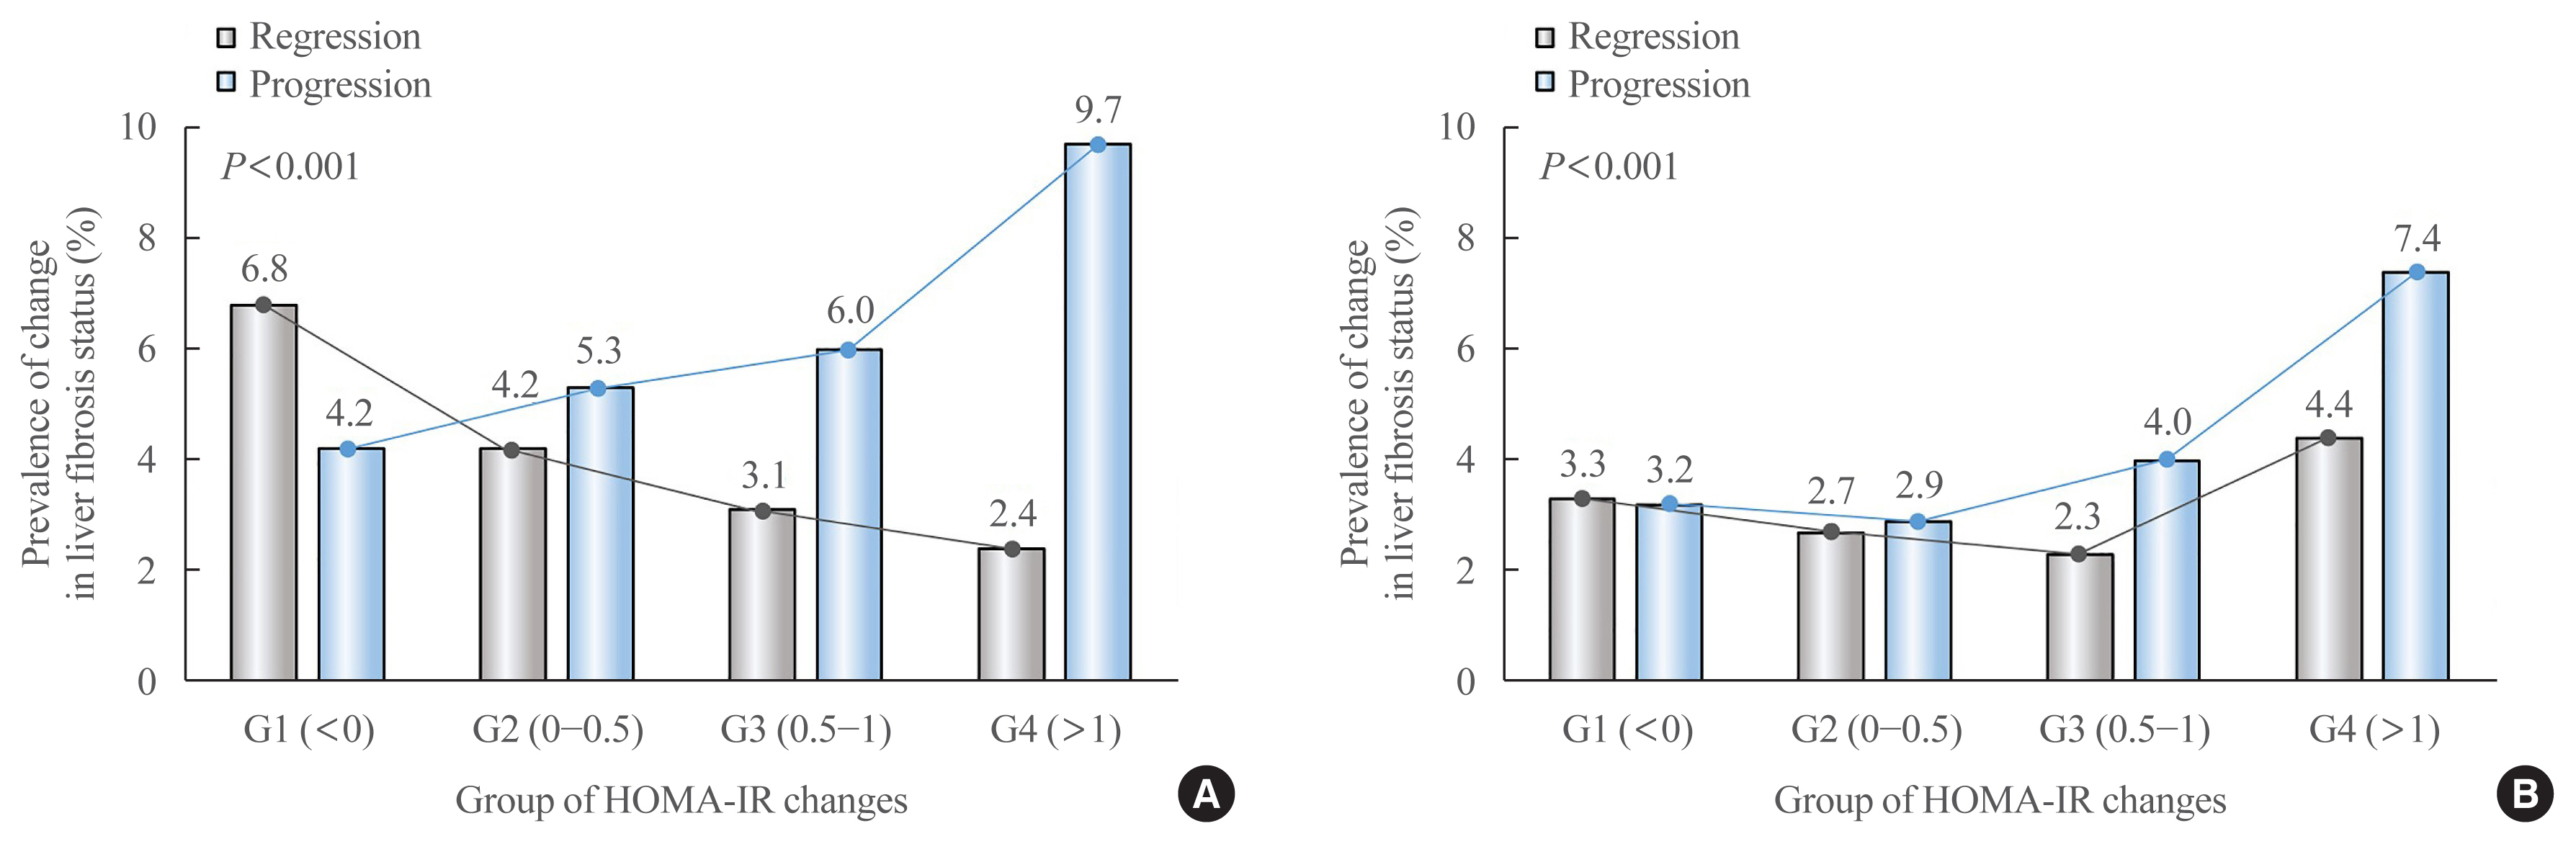
- Relationship between the degree of change in HOMA-IR and the change in fibrosis probability
- Prevalence and OR for changes in fibrosis probability were compared and analyzed according to the degree of HOMA-IR change in each participant showing progression or regression of fibrosis when evaluated based on NFS and APRI (Table 2, Fig. 2). In NFS-based analysis, fibrosis progressed in 949 participants and fibrosis regressed in 720 participants, and the OR for progression increased as the degree of HOMA-IR change increased. Notably, participants with increased HOMA-IR values greater than 1 (G4) had more than twice the risk of fibrosis progression than participants with decreased HOMA-IR values (G1, reference) (OR, 2.34; 95% confidence interval [CI], 1.98 to 2.76 for Model 1). As the degree of HOMA-IR change increased, the probability of fibrosis regression decreased. The OR for regression in group G4 was 2.8 times lower than in group G1 (OR, 0.35; 95% CI, 0.28 to 0.44 for Model 1). These results remained consistent in multivariate adjusted model (Model 3), especially after further adjustments to new onset diabetes (Model 4) and baseline HOMA-IR (Model 5).
- In APRI-based analysis, fibrosis progressed in 669 participants and fibrosis regressed in 515 participants. After adjusting for confounding factors, the risk of fibrosis progression was more than two-fold higher in group G4 than in group G1 (OR, 2.31; 95% CI, 1.88 to 2.84 for Model 3). However, the risk slightly decreased after adjusting for new-onset diabetes (OR, 2.08; 95% CI, 1.69 to 2.57 for Model 4). When the baseline HOMA-IR was adjusted, the association between changes in HOMA-IR and APRI progression was further enhanced (OR, 2.55; 95% CI, 2.05 to 3.18 for Model 5). In the evaluation of fibrosis regression, overall statistical significance was relatively low, and contrary to expectations, group G4 showed the highest regression probability (OR, 1.39; 95% CI, 1.10 to 1.77 for Model 5).
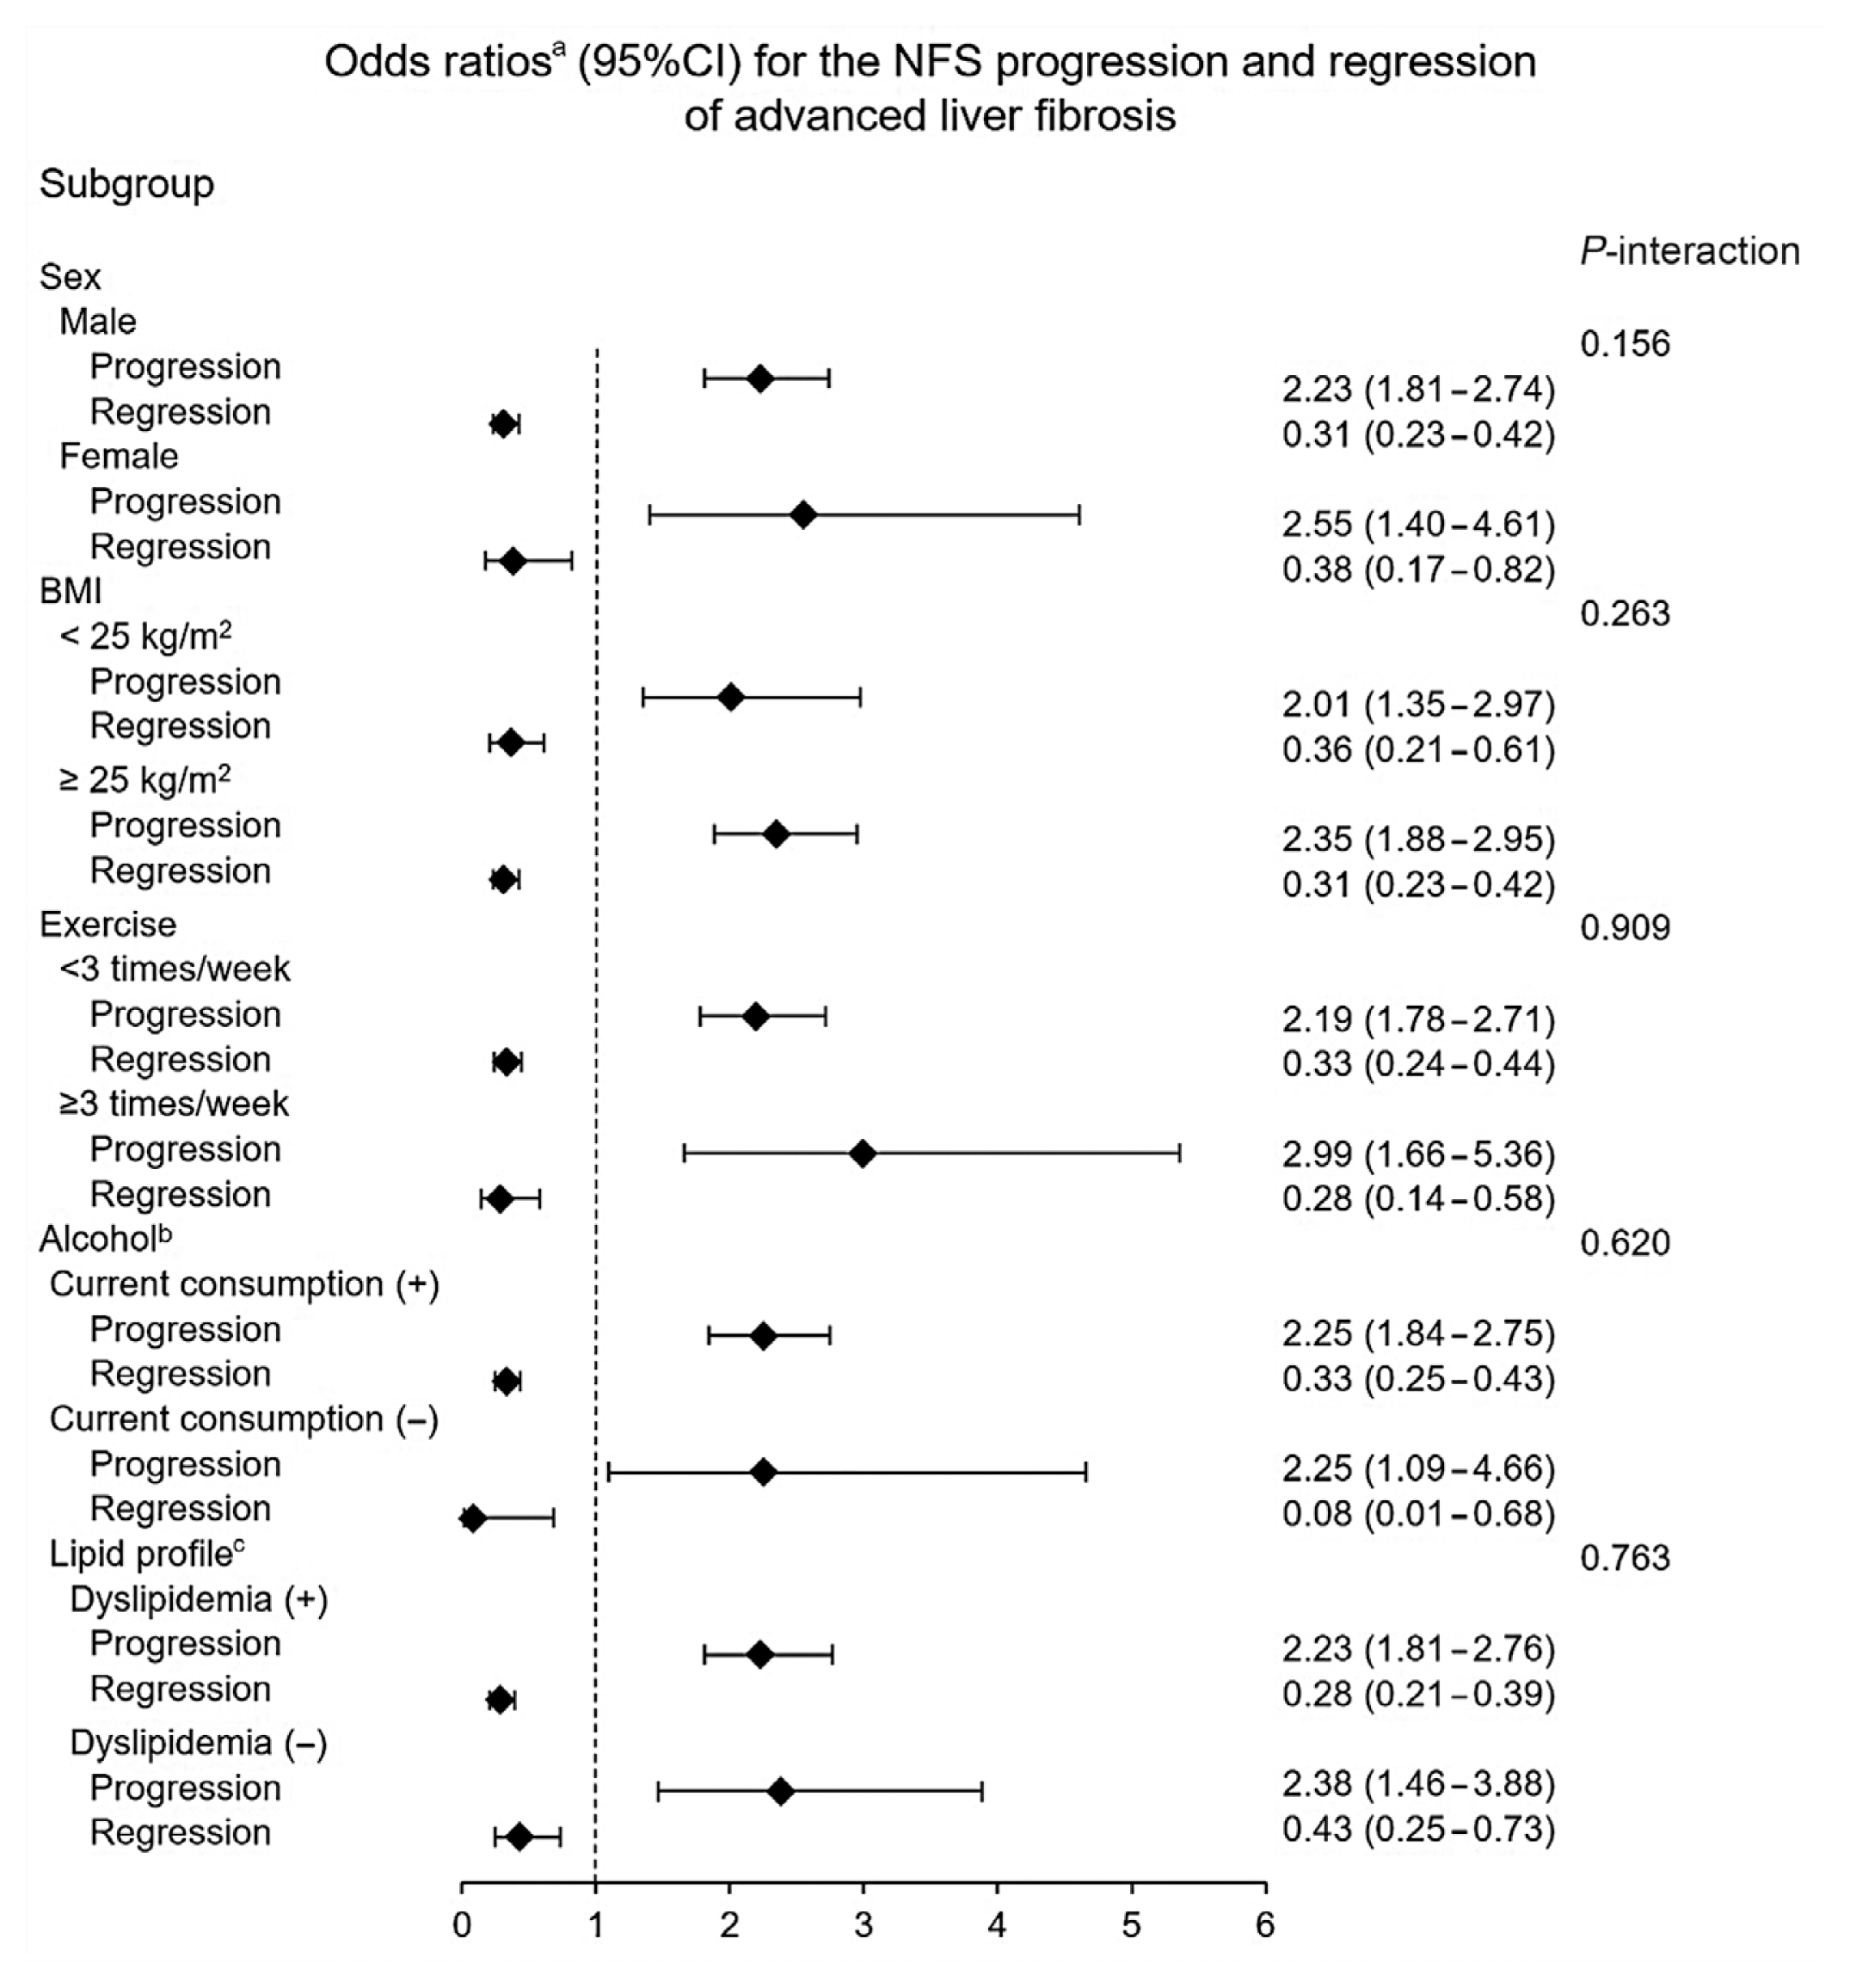
- Subgroup analysis
- Subgroup analyses of OR for changes in fibrosis status by degree of HOMA-IR change are shown in Fig. 3 (NFS) and Supplemental Table S3 (APRI), respectively. We applied a multivariate adjusted model including confounders such as exercise status, alcohol consumption, smoking status, BMI, waist circumference, HbA1c and hs-CRP levels, lipid profiles, and new-onset diabetes.
- When NFS criteria were applied, group G4 had a two-fold higher risk of progression than group G1 in all subgroup analyses. As the HOMA-IR change increased, the trend of increasing OR for progression was maintained except for women and participants with a BMI less than 25 kg/m2. The OR for regression decreased as the HOMA-IR change increased in all subgroup analyses except for participants without dyslipidemia.
- According to APRI criteria, group G4 had at least twice the risk of progression than group G1 in all subgroup analyzes except for participants with a BMI of less than 25 kg/m2 and no current alcohol consumption. With the exception of women and participants without current alcohol consumption, the trend of increasing OR for progression with increasing HOMA-IR changes was similar to the NFS-based analysis. However, there was no statistically significant association between the fibrosis regression and the degree of HOMA-IR change.
- Comparison of changes in HOMA-IR and BMI values with respect to the prediction of change in fibrosis status
- In NFS-based analysis, changes in HOMA-IR were more associated with changes in fibrosis status than changes in BMI: the change in OR per SD of standardized quartile of HOMA-IR change was 1.33 (95% CI, 1.25 to 1.42) for progression and 0.66 (95% CI, 0.59 to 0.74) for regression, whereas the change in OR per SD of standardized quartile of BMI change was 1.16 (95% CI, 1.07 to 1.24) for progression and 0.85 (95% CI, 0.78 to 0.92) for regression. Furthermore, the HOMA-IR change model showed a smaller AIC value than the BMI change model (10,248.33 vs. 10,368.57) (Table 3).
- In contrast, in APRI-based analysis, changes in BMI were more association with fibrosis progression than changes in HOMA-IR: the increase in OR per SD of standardized quartile of BMI change was 2.08 (95% CI, 1.90 to 2.28), but the increase in OR per SD of standardized quartile of HOMA-IR change was 1.38 (95% CI, 1.29 to 1.48). The BMI change model showed a smaller AIC value than the HOMA-IR change model (8,149.91 vs. 8,333.05). In the evaluation of fibrosis regression, changes in BMI showed similar results to the NFS-based analysis, but changes in HOMA-IR had the highest regression probability in group G4, unlike the NFS-based analysis (Table 3). This result is consistent with Table 2.
RESULTS
- In this study using data analysis of 15,728 adult participants and the non-invasive fibrosis index, we found a meaningful association between changes in HOMA-IR and changes in fibrosis status in patients with NAFLD. The greater the HOMA-IR increase, the greater the OR for progression in both NFS-based and APRI-based analyses. In contrast, the OR for fibrosis regression decreased in the same conditions except for the APRI-based analysis.
- The parameters included in the calculation of each non-invasive fibrosis index were different, and therefore each index has different sensitivity and specificity in predicting fibrosis in patients with NAFLD [28,29]. In the same context, in the evaluation of association between various metabolic or biological factors and fibrosis of NAFLD using the non-invasive fibrosis index, the risk interpretation may be different depending on each index applied. The prevalence of fibrosis progression in the unadjusted model and the risk of fibrosis progression in Model 1 adjusted for age, sex, and center (Seoul or Suwon) differed between the NFS-based and APRI-based analysis. In multivariate adjusted Models 2 and 3, there was little difference in the OR for progression between the two indices, especially as the degree of HOMA-IR change increased (group G3 and G4). However, new onset diabetes and baseline HOMA-IR showed different effects depending on the two index-based analyses. Especially, when the baseline HOMA-IR was adjusted, there was little change in NFS-based analysis, but the OR for APRI progression increased significantly. Interestingly, the baseline HOMA-IR median in group G4 was 1.64, while the baseline HOMA-IR median in reference group G1 was the highest at 2.15. This result may suggest that the baseline HOMA-IR was positively associated with APRI progression, which is consistent with our previous findings on the relationship between baseline HOMA-IR and fibrosis progression in patients with NAFLD [30]. With a few exceptions, the trend toward greater OR for fibrosis progression with greater degree of HOMA-IR change was maintained across subgroup analyses. In particular, the results with the largest OR for progression in group G4 were consistent in all subgroup analyses.
- In our study, results were inconsistent between NFS-based and APRI-based evaluations of fibrosis probability. In the case of regression, the possibility of fibrosis regression paradoxically increased even with an increase in HOMA-IR in the APRI-based evaluation. This may be due to the diversity of baseline characteristics including lifestyle, the unique statistical diagnostic ability of each index, and differences in factors included in the calculation of each index. NFS has relatively higher diagnostic reliability for advanced fibrosis probability than APRI (area under the receiver operating characteristic curve [AUROC], 0.84 for NFS vs. 0.77 for APRI) [28]. However, APRI is more powerful than NFS in distinguishing none/early (F0/F1) from significant/advanced (F2/F3) fibrosis in patients with NAFLD (AUROC, 0.86 for APRI vs. 0.68 for NFS) [29]. NFS includes age and BMI as calculation factors, but APRI contains only AST, ALT, and platelets [21,22]. So, when NFS is applied, we excluded age and BMI in multivariable adjusted models. At present, NFS is generally recommended as a non-invasive diagnostic index for fibrosis probability at a fixed time point in patient with NAFLD [1,31]. We also consider NFS to be a more reliable tool for evaluating the association of changes in IR and changes in fibrosis status between two specific time points.
- IR has previously been used as a predictive and diagnostic tool for NAFLD in clinical settings. Fasting hyperinsulinemia, which reflects IR, is an independent predictor of NAFLD in adults without diabetes [32]. In particular, one study explored the possibility of diagnosing NAFLD and metabolic syndrome by applying different cutoff values of HOMA-IR in men and women [33]. In adults without diabetes, if the HOMA-IR value is higher than or equal to 2.0 (for the best sensitivity [85%]) or 2.5 (for the best specificity [94%]), the risk of NAFLD is considered to be high [34].
- IR and inflammation are core pathophysiologies of liver fibrosis in patients with NAFLD [8,9]. IR can aggravate inflammation, and these two metabolic conditions form a vicious cycle [35]. However, NAFLD is not a major causal factor for IR, and various factors play a role in the development of IR [9,36]. Hyperinsulinemia; hyperglycemia; high levels of fatty acids/fatty acid metabolites; oxidative stress leading to the induction of a stress response via the c-Jun-N-terminal kinase (JNK) and nuclear factor-kappa B pathways; endoplasmic reticulum stress activating the JNK and inhibitory kappa B kinase beta pathways; and over-production of adipocytokines such as adiponectin, tumor necrosis factor-α, interleukin-6, and leptin are considered to induce IR [37].
- According to these pathophysiological mechanisms, the development of NAFLD or fibrosis progression can be suppressed by improving IR. It has been found that improvement in hyperinsulinemia, reflecting an improvement in IR, is related to the prevention and alleviation of NAFLD [32]. In addition, studies on insulin sensitizers such as thiazolidinediones have shown histological improvement in patients with NAFLD and NASH [38,39]. In the liver and peripheral tissues, the identification of IR using a hyperinsulinemic-euglycemic clamp combined with 0.2 g/kg of oral glucose load could be a useful clinical indicator of the early metabolic state of liver fibrosis [40]. In both prospective and retrospective studies based on histological validation, baseline HOMA-IR value was found to be independent predictor of fibrosis progression [10,11]. Recent studies showed that HOMA-IR values at the time of evaluation were closely related to the advanced liver fibrosis in patients with NAFLD confirmed by biopsy [12–14]. Additionally, HOMA-IR value was also associated with liver fibrosis in patients with chronic liver diseases such as chronic hepatitis C [41]. Although the previous studies have the advantage of histological verification of NAFLD, the prediction of fibrosis progression and the evaluation of fibrosis stage were determined according to the HOMA-IR values at a specific time point. However, NAFLD is a progressive disease with a wide spectrum and is affected by various factors during the disease course [15]. Therefore, we focused on the changes of HOMA-IR value regardless of the baseline value, and tried to find the relationship between the changes of HOMA-IR value and the fibrosis progression.
- In addition, one of our concerns is that weight change is very important as one of the interventions affecting changes in IR [16]. It was confirmed that, through a randomized controlled trial, the histological improvement of liver in patients with NASH can be achieved by weight loss [42]. A large scaled cohort study showed that weight changes and obesity were closely associated with fibrosis status evaluated by APRI value in patients with NAFLD [43]. In the comparison between the standardized quartile of HOMA-IR change and the standardized quartile of BMI change in predicting the change in fibrosis probability, there were differences in quantitative influence. When the NFS criteria were applied to the evaluation of advanced liver fibrosis, HOMA-IR change was more associated with change in fibrosis probability than BMI change. However, in APRI-based analysis, the results were reversed. Moreover, based on AIC calculation, HOMA-IR change model was superior to BMI change model to predict an NFS progression, but the BMI change model was superior to HOMA-IR change model to predict an APRI progression.
- This study has several limitations. First, the diagnoses of NAFLD and advanced liver fibrosis were not histologically confirmed. To date, the most reliable method for diagnosing liver fibrosis is biopsy study. However, biopsy study has many practical limitations in large-scale cohort studies, e.g., invasiveness, sampling issues, and cost [44]. Furthermore, non-invasive fibrosis scoring systems can be used as useful tools for predicting liver fibrosis [21,22,31]. Second, this study was retrospective in nature. Hence, the effect of selection bias cannot be excluded. Third, among the cohort data used in our study, alcohol consumption, exercise status, and medication history were dependent on information provided by the participants without verification procedures, and the effects of other dietary supplements were not excluded. Fourth, NFS includes the presence of diabetes or IFG as a calculation factor. And changes in HOMA-IR may reflect changes in fasting blood glucose levels. These implies that the two indices are likely to be originally related to each other. However, we tried to rule out the effects of new-onset diabetes that emerged during follow-up. In addition, in our study, only simple changes in NFS values were not considered linearly as changes in fibrosis, but only when they were outside the range of cut-off values were considered to be changes in fibrosis. These may attenuate the original relationship between the two indices. Nevertheless, there may be an original relationship between the two indices, which is a limitation that requires caution in the interpretation of our study. Finally, the results obtained in this study cannot be generalized because most of the participants included in this study were Korean middle-aged men, mainly office workers who participated in regular health check-ups and actively cared for their health.
- Nevertheless, the clinical importance of this study is noteworthy in terms of the elaborate analysis based on highly reliable data from a relatively large-scale study population, providing an advantage in terms of statistical reliability. First of all, we pioneered a study to evaluate the risk of fibrosis progression according to the degree of HOMA-IR change in relatively healthy adults with NAFLD, especially in clinical settings where liver biopsies cannot be performed routinely.
- In conclusion, this study demonstrates that changes in HOMA-IR reflect the progression or regression of fibrosis probability in patients with NAFLD without diabetes, which underscores the role of IR in liver fibrosis. In addition to this study, a long-term longitudinal study of the development of advanced liver fibrosis according to baseline HOMA-IR values in a large general population will also contribute to the clinical use of HOMA-IR.
DISCUSSION
-
Acknowledgements
- The authors acknowledge the efforts of the Department of R&D Management at Kangbuk Samsung Hospital, Korea for editing the figures and tables.
SUPPLEMENTARY INFORMATION
Supplemental Table S1.
Supplemental Table S2.
Supplemental Table S3.
-
CONFLICTS OF INTEREST
No potential conflict of interest relevant to this article was reported.
-
AUTHOR CONTRIBUTIONS
Conception or design: D.J.K. Acquisition, analysis, or interpretation of data: D.J.K., M.Y.L., I.J., S.J.M., H.K., S.E.P. Drafting the work or revising: D.J.K., E.J.R., W.Y.L. Final approval of the manuscript: D.J.K., E.J.R., W.Y.L.
Article information


| Characteristic | Overall | HOMA-IR change groups | P value | |||
|---|---|---|---|---|---|---|
|
|
||||||
| G1 (<0) | G2 (0–0.50) | G3 (0.51–1.00) | G4 (>1.00) | |||
| No. of participants (%) | 15,728 | 6,010 (38.2) | 3,512 (22.3) | 2,587 (16.4) | 3,619 (23.0) | |
|
|
||||||
| Male sex | 13,531 (86.0) | 5,140 (85.5) | 3,085 (87.8) | 2,240 (86.5) | 3,066 (84.7) | 0.001 |
|
|
||||||
| Age, yr | 40.5±6.5 | 40.7±6.4 | 40.9±6.7 | 40.5±6.4 | 39.6±6.4 | <0.001 |
|
|
||||||
| BMI, kg/m2 | 25.8±2.8 | 25.9±2.8 | 25.2±2.6 | 25.5±2.6 | 26.4±2.9 | <0.001 |
|
|
||||||
| Obesitya | 9,260 (58.8) | 3,618 (60.2) | 1,823 (51.9) | 1,435 (55.4) | 2,384 (65.8) | <0.001 |
|
|
||||||
| Waist circumference, cm | 89.2±7.3 | 89.3±7.4 | 87.9±6.9 | 88.5±6.8 | 90.7±7.8 | <0.001 |
|
|
||||||
| Fasting blood glucose, mmol/L | 5.42±0.50 | 5.53±0.52 | 5.36±0.47 | 5.33±0.48 | 5.35±0.50 | <0.001 |
|
|
||||||
| Hemoglobin A1c, % | 5.6±0.2 | 5.6±0.2 | 5.6±0.2 | 5.6±0.2 | 5.7±0.31 | <0.001 |
|
|
||||||
| SBP, mm Hg | 113.5±12.0 | 113.94±11.9 | 112.55±11.6 | 112.64±11.7 | 114.62±12.5 | <0.001 |
|
|
||||||
| AST, U/L | 22 (18–28) | 22 (18–27) | 21 (18–27) | 22 (18–27) | 24 (19–31) | <0.001 |
|
|
||||||
| ALT, U/L | 28 (20–40) | 27 (20–40) | 25 (19–37) | 26 (20–38) | 31 (22–46) | <0.001 |
|
|
||||||
| Platelets, ×103/mm3 | 241 (212–274) | 241 (212–274) | 240 (211–272) | 242 (213–273) | 242 (212–276) | 0.056 |
|
|
||||||
| Albumin, g/dL | 4.63±0.23 | 4.62±0.23 | 4.62±0.23 | 4.63±0.24 | 4.64±0.24 | <0.001 |
|
|
||||||
| Total cholesterol, mmol/L | 5.38±0.89 | 5.38±0.9 | 5.35±0.88 | 5.36±0.87 | 5.4±0.91 | 0.103 |
|
|
||||||
| Triglyceride, mmol/L | 1.57 (1.14–2.18) | 1.66 (1.20–2.28) | 1.49 (1.08–2.07) | 1.50 (1.08–2.10) | 1.56 (1.13–2.18) | <0.001 |
|
|
||||||
| LDL-C, mmol/L | 3.52±0.81 | 3.49±0.82 | 3.51±0.79 | 3.54±0.79 | 3.57±0.83 | <0.001 |
|
|
||||||
| HDL-C, mmol/L | 1.26±0.29 | 1.26±0.29 | 1.28±0.28 | 1.27±0.28 | 1.23±0.28 | <0.001 |
|
|
||||||
| hs-CRP, mmol/L | 0.07 (0.04–0.13) | 0.07 (0.04–0.13) | 0.06 (0.04–0.12) | 0.07 (0.04–0.12) | 0.08 (0.04–0.15) | <0.001 |
|
|
||||||
| Current alcohol useb | 8,219 (52.2) | 3,167 (52.7) | 1,808 (51.4) | 1,326 (51.2) | 1,918 (53.0) | 0.370 |
| Male | 6,823 (50.4) | 2,618 (50.9) | 1,537 (49.8) | 1,104 (49.2) | 1,564 (51.0) | 0.463 |
| Female | 1,396 (63.5) | 549 (63.1) | 271 (63.4) | 222 (63.9) | 354 (64.0) | 0.985 |
|
|
||||||
| Smoking status | <0.001 | |||||
| Never smoker | 3,839 (24.4) | 1,490 (24.7) | 838 (23.8) | 619 (23.9) | 892 (24.6) | |
| Ex-smoker | 5,810 (36.9) | 2,329 (38.7) | 1,341 (38.1) | 919 (35.5) | 1,221 (33.7) | |
| Current smoker | 5,189 (32.9) | 1,857 (30.9) | 1,135 (32.3) | 903 (34.9) | 1,294 (35.7) | |
|
|
||||||
| Regular exercise | 0.231 | |||||
| ≥3 times/week | 1,783 (11.3) | 660 (10.9) | 434 (12.3) | 309 (11.9) | 380 (10.5) | |
| <3 times/week | 13,541 (86.0) | 5,192 (86.3) | 2,990 (85.1) | 2,215 (85.6) | 3,144 (86.8) | |
|
|
||||||
| NFS | −2.74±1.00 | −2.63±1.02 | −2.77±0.99 | −2.84±0.98 | −2.83±0.99 | <0.001 |
|
|
||||||
| APRI | 0.24 (0.19–0.31) | 0.24 (0.19–0.31) | 0.23 (0.19–0.30) | 0.24 (0.19–0.30) | 0.26 (0.20–0.34) | <0.001 |
|
|
||||||
| HOMA-IR | 1.72 (1.19–2.43) | 2.15 (1.57–2.94) | 1.44 (1.02–1.98) | 1.41 (0.98–1.95) | 1.64 (1.12–2.30) | <0.001 |
Values are expressed as number (%), mean±standard deviation, or median (interquartile range).
HOMA-IR, homeostatic model assessment of insulin resistance; BMI, body mass index; SBP, systolic blood pressure; AST, aspartate aminotransferase; ALT, alanine aminotransferase; LDL-C, low-density lipoprotein cholesterol; HDL-C, high-density lipoprotein cholesterol; hs-CRP, high-sensitivity C-reactive protein; NFS, nonalcoholic fatty liver disease (NAFLD) fibrosis score; APRI, aspartate aminotransferase to platelet ratio index.
a Obesity was defined as the BMI of ≥25 kg/m2;
b Participants with daily alcohol consumption above the median value (12 g/day for men and 2 g/day for women).
| HOMA-IR change | Case (%) | Multivariate-adjusted OR (95% CI) | ||||
|---|---|---|---|---|---|---|
|
|
||||||
| Model 1 | Model 2 | Model 3 | Model 4 | Model 5 | ||
| Progression (NFSa) | ||||||
| G1 (<0) | 254 (4.2) | 1 (reference) | 1 (reference) | 1 (reference) | 1 (reference) | 1 (reference) |
| G2 (0–0.50) | 187 (5.3) | 1.23 (1.01–1.49) | 1.24 (1.02–1.5) | 1.31 (1.05–1.63) | 1.31 (1.05–1.63) | 1.33 (1.07–1.65) |
| G3 (0.51–1.00) | 156 (6.0) | 1.39 (1.13–1.71) | 1.39 (1.13–1.71) | 1.45 (1.15–1.82) | 1.44 (1.15–1.82) | 1.46 (1.16–1.83) |
| G4 (>1.00) | 352 (9.7) | 2.34 (1.98–2.76) | 2.31 (1.96–2.74) | 2.26 (1.87–2.72) | 2.23 (1.85–2.69) | 2.25 (1.87–2.71) |
| P for trend | <0.001 | <0.001 | <0.001 | <0.001 | <0.001 | |
|
|
||||||
| Regression (NFSa) | ||||||
| G1 (<0) | 409 (6.8) | 1 (reference) | 1 (reference) | 1 (reference) | 1 (reference) | 1 (reference) |
| G2 (0–0.50) | 146 (4.2) | 0.60 (0.49–0.73) | 0.60 (0.5–0.73) | 0.52 (0.41–0.65) | 0.52 (0.41–0.65) | 0.53 (0.42–0.67) |
| G3 (0.51–1.00) | 80 (3.1) | 0.44 (0.35–0.57) | 0.45 (0.35–0.58) | 0.43 (0.33–0.57) | 0.43 (0.33–0.57) | 0.44 (0.33–0.58) |
| G4 (>1.00) | 85 (2.4) | 0.35 (0.28–0.44) | 0.35 (0.27–0.44) | 0.33 (0.26–0.43) | 0.33 (0.25–0.43) | 0.33 (0.25–0.43) |
| P for trend | <0.001 | <0.001 | <0.001 | <0.001 | <0.001 | |
|
|
||||||
| Progression (APRI) | ||||||
| G1 (<0) | 194 (3.2) | 1 (reference) | 1 (reference) | 1 (reference) | 1 (reference) | 1 (reference) |
| G2 (0–0.50) | 103 (2.9) | 0.80 (0.62–1.02) | 0.92 (0.72–1.17) | 0.99 (0.76–1.29) | 0.97 (0.75–1.27) | 1.14 (0.87–1.50) |
| G3 (0.51–1.00) | 103 (4.0) | 0.67 (0.50–0.90) | 1.24 (0.97–1.58) | 1.29 (0.99–1.68) | 1.26 (0.97–1.65) | 1.50 (1.14–1.98) |
| G4 (>1.00) | 269 (7.4) | 1.36 (1.10–1.69) | 2.39 (1.97–2.89) | 2.31 (1.88–2.84) | 2.08 (1.69–2.57) | 2.55 (2.05–3.18) |
| P for trend | <0.001 | <0.001 | <0.001 | <0.001 | <0.001 | |
|
|
||||||
| Regression (APRI) | ||||||
| G1 (<0) | 201 (3.3) | 1 (reference) | 1 (reference) | 1 (reference) | 1 (reference) | 1 (reference) |
| G2 (0–0.50) | 95 (2.7) | 0.90 (0.71–1.15) | 0.82 (0.64–1.06) | 0.92 (0.70–1.20) | 0.91 (0.69–1.19) | 1.04 (0.79–1.37) |
| G3 (0.51–1.00) | 59 (2.3) | 1.23 (0.96–1.57) | 0.69 (0.51–0.93) | 0.78 (0.57–1.07) | 0.77 (0.57–1.05) | 0.92 (0.67–1.26) |
| G4 (>1.00) | 160 (4.4) | 2.42 (2.00–2.93) | 1.34 (1.09–1.66) | 1.23 (0.98–1.54) | 1.14 (0.91–1.14) | 1.39 (1.10–1.77) |
| P for trend | 0.016 | 0.019 | 0.104 | 0.411 | 0.022 | |
Model 1, adjusted for age, sex, and center (Seoul or Suwon); Model 2, additionally adjusted for systolic blood pressure, regular exercise, current alcohol consumption, and smoking status; Model 3, additionally adjusted for body mass index (BMI), waist circumference, and hemoglobin A1c, high-sensitivity C-reactive protein, low-density lipoprotein cholesterol, and triglyceride levels; Model 4, additionally adjusted for development of new-onset diabetes; Model 5, additionally adjusted for baseline HOMA-IR.
HOMA-IR, homeostatic model assessment of insulin resistance; OR, odds ratio; CI, confidence interval; NFS, nonalcoholic fatty liver disease (NAFLD) fibrosis score; APRI, aspartate aminotransferase to platelet ratio index.
a For the NFS analyses, the models were not adjusted for age and BMI as these factors were included in the calculation of the NFS.
| Standardized quartilea | Multivariate-adjusted OR (95% CI) | |||
|---|---|---|---|---|
|
|
||||
| NFSb | APRIc | |||
|
|
|
|||
| HOMA-IR change | BMI change | HOMA-IR change | BMI change | |
| Progression | ||||
| Q1 | 1 (reference) | 1 (reference) | 1 (reference) | 1 (reference) |
| Q2 | 1.16 (0.84–1.60) | 1.21 (0.93–1.56) | 1.58 (1.09–2.29) | 1.51 (0.99–2.31) |
| Q3 | 1.64 (1.19–2.28) | 1.28 (0.99–1.65) | 2.32 (1.58–3.39) | 2.78 (1.86–4.16) |
| Q4 | 2.76 (1.96–3.88) | 1.56 (1.17–2.09) | 4.24 (2.86–6.29) | 8.01 (5.32–12.04) |
| P for trend | <0.001 | 0.003 | <0.001 | <0.001 |
| Per 1 SD increase | 1.33 (1.25–1.42) | 1.16 (1.07–1.24) | 1.38 (1.29–1.48) | 2.08 (1.90–2.28) |
|
|
||||
| Regression | ||||
| Q1 | 1 (reference) | 1 (reference) | 1 (reference) | 1 (reference) |
| Q2 | 0.88 (0.66–1.16) | 0.9 (0.70–1.16) | 0.93 (0.67–1.28) | 0.78 (0.60–1.01) |
| Q3 | 0.42 (0.30–0.57) | 0.68 (0.52–0.87) | 1.001 (0.71–1.41) | 0.56 (0.43–0.73) |
| Q4 | 0.31 (0.20–0.48) | 0.52 (0.36–0.74) | 1.43 (0.99–2.07) | 0.41 (0.28–0.61) |
| P for trend | <0.001 | <0.001 | 0.027 | <0.001 |
| Per 1 SD increase | 0.66 (0.59–0.74) | 0.85 (0.78–0.92) | 1.10 (1.02–1.18) | 0.83 (0.76–0.90) |
| AIC | 10,248.33 | 10,368.57 | 8,333.05 | 8,149.91 |
HOMA-IR, homeostatic model assessment of insulin resistance; BMI, body mass index; NAFLD, nonalcoholic fatty liver disease; OR, odds ratio; CI, confidence interval; NFS, NAFLD fibrosis score; APRI, aspartate aminotransferase to platelet ratio index; SD, standard deviation; AIC, Akaike information criterion.
a Standardized quartile range of HOMA-IR change: Q1, −18.71 to −1.00 (n=1,523); Q2, −1.00 to 0.36 (n=7,046); Q3, 0.36 to 1.72 (n=5,525); Q4, 1.72 to 14.16 (n=1,634). Standardized quartile range of BMI change: Q1, −8.72 to −0.95 (n=1,916); Q2, −0.95 to −0.36 (n=5,636); Q3, 0.36 to 1.66 (n=6,236); Q4, 1.67 to 9.56 (n=1,940);
b Adjused for sex, center (Seoul or Suwon), systolic blood pressure (SBP), regular exercise, current alcohol consumption, smoking status, waist circumference, HOMA-IR, hemoglobin A1c (HbA1c), high-sensitivity C-reactive protein (hs-CRP), low-density lipoprotein cholesterol (LDL-C), triglyceride, and new-onset diabetes;
c Adjused for age, sex, center (Seoul or Suwon), SBP, regular exercise, current alcohol consumption, smoking status, waist circumference, HOMA-IR, BMI, HbA1c, hs-CRP, LDL-C, triglyceride, and new-onset diabetes.
- 1. Chalasani N, Younossi Z, Lavine JE, Charlton M, Cusi K, Rinella M, et al. The diagnosis and management of nonalcoholic fatty liver disease: practice guidance from the American Association for the Study of Liver Diseases. Hepatology 2018;67:328–57.ArticlePubMed
- 2. Sayiner M, Otgonsuren M, Cable R, Younossi I, Afendy M, Golabi P, et al. Variables associated with inpatient and outpatient resource utilization among medicare beneficiaries with nonalcoholic fatty liver disease with or without cirrhosis. J Clin Gastroenterol 2017;51:254–60.ArticlePubMed
- 3. Ekstedt M, Franzen LE, Mathiesen UL, Thorelius L, Holmqvist M, Bodemar G, et al. Long-term follow-up of patients with NAFLD and elevated liver enzymes. Hepatology 2006;44:865–73.ArticlePubMed
- 4. Younossi Z, Henry L. Contribution of alcoholic and nonalcoholic fatty liver disease to the burden of liver-related morbidity and mortality. Gastroenterology 2016;150:1778–85.ArticlePubMed
- 5. Gaggini M, Morelli M, Buzzigoli E, DeFronzo RA, Bugianesi E, Gastaldelli A. Non-alcoholic fatty liver disease (NAFLD) and its connection with insulin resistance, dyslipidemia, atherosclerosis and coronary heart disease. Nutrients 2013;5:1544–60.ArticlePubMedPMC
- 6. Utzschneider KM, Kahn SE. Review: the role of insulin resistance in nonalcoholic fatty liver disease. J Clin Endocrinol Metab 2006;91:4753–61.PubMed
- 7. Bugianesi E, Gastaldelli A, Vanni E, Gambino R, Cassader M, Baldi S, et al. Insulin resistance in non-diabetic patients with non-alcoholic fatty liver disease: sites and mechanisms. Diabetologia 2005;48:634–42.ArticlePubMed
- 8. Angulo P, Machado MV, Diehl AM. Fibrosis in nonalcoholic fatty liver disease: mechanisms and clinical implications. Semin Liver Dis 2015;35:132–45.ArticlePubMed
- 9. Kitade H, Chen G, Ni Y, Ota T. Nonalcoholic fatty liver disease and insulin resistance: new insights and potential new treatments. Nutrients 2017;9:387.ArticlePubMedPMC
- 10. Sorrentino P, Terracciano L, D’Angelo S, Ferbo U, Bracigliano A, Vecchione R. Predicting fibrosis worsening in obese patients with NASH through parenchymal fibronectin, HOMA-IR, and hypertension. Am J Gastroenterol 2010;105:336–44.ArticlePubMed
- 11. Pais R, Charlotte F, Fedchuk L, Bedossa P, Lebray P, Poynard T, et al. A systematic review of follow-up biopsies reveals disease progression in patients with non-alcoholic fatty liver. J Hepatol 2013;59:550–6.ArticlePubMed
- 12. Gomez de la Cuesta S, Aller de la Fuente R, Tafur Sanchez C, Izaola O, Garcia Sanchez C, Mora N, et al. Analytical, anthropometric and dietary factors associated with the development of fibrosis in patients with nonalcoholic fatty liver disease. Rev Esp Enferm Dig 2018;110:292–8.ArticlePubMed
- 13. Fujii H, Imajo K, Yoneda M, Nakahara T, Hyogo H, Takahashi H, et al. HOMA-IR: an independent predictor of advanced liver fibrosis in nondiabetic non-alcoholic fatty liver disease. J Gastroenterol Hepatol 2019;34:1390–5.ArticlePubMed
- 14. Aller R, Siguenza R, Pina M, Laserna C, Antolin B, Burgueno B, et al. Insulin resistance is related with liver fibrosis in type 2 diabetic patients with non-alcoholic fatty liver disease proven biopsy and Mediterranean diet pattern as a protective factor. Endocrine 2020;68:557–63.ArticlePubMed
- 15. Anstee QM, Targher G, Day CP. Progression of NAFLD to diabetes mellitus, cardiovascular disease or cirrhosis. Nat Rev Gastroenterol Hepatol 2013;10:330–44.ArticlePubMed
- 16. Cox KL, Burke V, Morton AR, Beilin LJ, Puddey IB. Independent and additive effects of energy restriction and exercise on glucose and insulin concentrations in sedentary overweight men. Am J Clin Nutr 2004;80:308–16.ArticlePubMed
- 17. Yoon YS, Oh SW, Baik HW, Park HS, Kim WY. Alcohol consumption and the metabolic syndrome in Korean adults: the 1998 Korean National Health and Nutrition Examination Survey. Am J Clin Nutr 2004;80:217–24.ArticlePubMed
- 18. Chun MY. Validity and reliability of Korean version of international physical activity questionnaire short form in the elderly. Korean J Fam Med 2012;33:144–51.ArticlePubMedPMC
- 19. Antuna-Puente B, Disse E, Rabasa-Lhoret R, Laville M, Capeau J, Bastard JP. How can we measure insulin sensitivity/resistance? Diabetes Metab 2011;37:179–88.ArticlePubMed
- 20. Hamer OW, Aguirre DA, Casola G, Lavine JE, Woenckhaus M, Sirlin CB. Fatty liver: imaging patterns and pitfalls. Radiographics 2006;26:1637–53.ArticlePubMed
- 21. Angulo P, Hui JM, Marchesini G, Bugianesi E, George J, Farrell GC, et al. The NAFLD fibrosis score: a noninvasive system that identifies liver fibrosis in patients with NAFLD. Hepatology 2007;45:846–54.ArticlePubMed
- 22. Wai CT, Greenson JK, Fontana RJ, Kalbfleisch JD, Marrero JA, Conjeevaram HS, et al. A simple noninvasive index can predict both significant fibrosis and cirrhosis in patients with chronic hepatitis C. Hepatology 2003;38:518–26.ArticlePubMed
- 23. Li B, Zhang C, Zhan YT. Nonalcoholic fatty liver disease cirrhosis: a review of its epidemiology, risk factors, clinical presentation, diagnosis, management, and prognosis. Can J Gastroenterol Hepatol 2018;2018:2784537.ArticlePubMedPMC
- 24. Salomone F, Micek A, Godos J. Simple scores of fibrosis and mortality in patients with NAFLD: a systematic review with meta-analysis. J Clin Med 2018;7:219.ArticlePubMedPMC
- 25. European Association for the Study of the Liver (EASL); European Association for the Study of Diabetes (EASD); European Association for the Study of Obesity (EASO). EASL-EASD-EASO clinical practice guidelines for the management of non-alcoholic fatty liver disease. J Hepatol 2016;64:1388–402.ArticlePubMed
- 26. Younossi ZM, Koenig AB, Abdelatif D, Fazel Y, Henry L, Wymer M. Global epidemiology of nonalcoholic fatty liver disease: meta-analytic assessment of prevalence, incidence, and outcomes. Hepatology 2016;64:73–84.ArticlePubMed
- 27. Adams LA, Anstee QM, Tilg H, Targher G. Non-alcoholic fatty liver disease and its relationship with cardiovascular disease and other extrahepatic diseases. Gut 2017;66:1138–53.ArticlePubMed
- 28. Xiao G, Zhu S, Xiao X, Yan L, Yang J, Wu G. Comparison of laboratory tests, ultrasound, or magnetic resonance elastography to detect fibrosis in patients with nonalcoholic fatty liver disease: a meta-analysis. Hepatology 2017;66:1486–501.ArticlePubMed
- 29. Polyzos SA, Slavakis A, Koumerkeridis G, Katsinelos P, Kountouras J. Noninvasive liver fibrosis tests in patients with nonalcoholic fatty liver disease: an external validation cohort. Horm Metab Res 2019;51:134–40.ArticlePubMed
- 30. Koo DJ, Lee MY, Jung I, Moon SJ, Kwon H, Park SE, et al. Baseline homeostasis model assessment of insulin resistance associated with fibrosis progression in patients with nonalcoholic fatty liver disease without diabetes: a cohort study. PLoS One 2021;16:e0255535.ArticlePubMedPMC
- 31. McPherson S, Stewart SF, Henderson E, Burt AD, Day CP. Simple non-invasive fibrosis scoring systems can reliably exclude advanced fibrosis in patients with non-alcoholic fatty liver disease. Gut 2010;59:1265–9.ArticlePubMed
- 32. Rhee EJ, Lee WY, Cho YK, Kim BI, Sung KC. Hyperinsulinemia and the development of nonalcoholic Fatty liver disease in nondiabetic adults. Am J Med 2011;124:69–76.ArticlePubMed
- 33. Motamed N, Miresmail SJ, Rabiee B, Keyvani H, Farahani B, Maadi M, et al. Optimal cutoff points for HOMA-IR and QUICKI in the diagnosis of metabolic syndrome and non-alcoholic fatty liver disease: a population based study. J Diabetes Complications 2016;30:269–74.ArticlePubMed
- 34. Salgado AL, Carvalho Ld, Oliveira AC, Santos VN, Vieira JG, Parise ER. Insulin resistance index (HOMA-IR) in the differentiation of patients with non-alcoholic fatty liver disease and healthy individuals. Arq Gastroenterol 2010;47:165–9.ArticlePubMed
- 35. Chen Z, Yu R, Xiong Y, Du F, Zhu S. A vicious circle between insulin resistance and inflammation in nonalcoholic fatty liver disease. Lipids Health Dis 2017;16:203.ArticlePubMedPMC
- 36. Gruben N, Shiri-Sverdlov R, Koonen DP, Hofker MH. Nonalcoholic fatty liver disease: a main driver of insulin resistance or a dangerous liaison? Biochim Biophys Acta 2014;1842:2329–43.ArticlePubMed
- 37. Leclercq IA, Da Silva Morais A, Schroyen B, Van Hul N, Geerts A. Insulin resistance in hepatocytes and sinusoidal liver cells: mechanisms and consequences. J Hepatol 2007;47:142–56.ArticlePubMed
- 38. Yki-Jarvinen H. Thiazolidinediones. N Engl J Med 2004;351:1106–18.ArticlePubMed
- 39. Stein LL, Dong MH, Loomba R. Insulin sensitizers in nonalcoholic fatty liver disease and steatohepatitis: current status. Adv Ther 2009;26:893–907.ArticlePubMedPMC
- 40. Taguchi K, Yamanaka-Okumura H, Mizuno A, Nakamura T, Shimada M, Doi T, et al. Insulin resistance as early sign of hepatic dysfunction in liver cirrhosis. J Med Invest 2014;61:180–9.ArticlePubMed
- 41. Muzzi A, Leandro G, Rubbia-Brandt L, James R, Keiser O, Malinverni R, et al. Insulin resistance is associated with liver fibrosis in non-diabetic chronic hepatitis C patients. J Hepatol 2005;42:41–6.ArticlePubMed
- 42. Promrat K, Kleiner DE, Niemeier HM, Jackvony E, Kearns M, Wands JR, et al. Randomized controlled trial testing the effects of weight loss on nonalcoholic steatohepatitis. Hepatology 2010;51:121–9.ArticlePubMed
- 43. Kim Y, Chang Y, Cho YK, Ahn J, Shin H, Ryu S. Obesity and weight gain are associated with progression of fibrosis in patients with nonalcoholic fatty liver disease. Clin Gastroenterol Hepatol 2019;17:543–50.ArticlePubMed
- 44. Sumida Y, Nakajima A, Itoh Y. Limitations of liver biopsy and non-invasive diagnostic tests for the diagnosis of nonalcoholic fatty liver disease/nonalcoholic steatohepatitis. World J Gastroenterol 2014;20:475–85.ArticlePubMedPMC
References
Figure & Data
References
Citations
- Insulin Resistance/Sensitivity Measures as Screening Indicators of Metabolic-Associated Fatty Liver Disease and Liver Fibrosis
Mohammad E. Khamseh, Mojtaba Malek, Soodeh Jahangiri, Sohrab Nobarani, Azita Hekmatdoost, Marieh Salavatizadeh, Samira Soltanieh, Haleh Chehrehgosha, Hoda Taheri, Zeinab Montazeri, Fereshteh Attaran, Faramarz Ismail-Beigi, Fariba Alaei-Shahmiri
Digestive Diseases and Sciences.2024; 69(4): 1430. CrossRef - Association between nonalcoholic fatty liver disease and left ventricular diastolic dysfunction: A 7-year retrospective cohort study of 3,496 adults using serial echocardiography
Gyuri Kim, Tae Yang Yu, Jae Hwan Jee, Ji Cheol Bae, Mira Kang, Jae Hyeon Kim
Diabetes & Metabolism.2024; : 101534. CrossRef - Factors Associated with Liver Fibrosis in Chinese Patients with Type 2 Diabetes Mellitus and Non-Alcoholic Fatty Liver Disease
Yu Luo, Cuiyu Wang, Tian Zhang, Xiaoyu He, Jianan Hao, Andong Shen, Hang Zhao, Shuchun Chen, Luping Ren
International Journal of General Medicine.2023; Volume 16: 293. CrossRef - Impact of COVID-19 Lockdown on Non-Alcoholic Fatty Liver Disease and Insulin Resistance in Adults: A before and after Pandemic Lockdown Longitudinal Study
Ángel Arturo López-González, Bárbara Altisench Jané, Luis Masmiquel Comas, Sebastiana Arroyo Bote, Hilda María González San Miguel, José Ignacio Ramírez Manent
Nutrients.2022; 14(14): 2795. CrossRef - Metabolic Score for Insulin Resistance Is Inversely Related to Incident Advanced Liver Fibrosis in Patients with Non-Alcoholic Fatty Liver Disease
Jun-Hyuk Lee, Yu-Jin Kwon, Kyongmin Park, Hye Sun Lee, Hoon-Ki Park, Jee Hye Han, Sang Bong Ahn
Nutrients.2022; 14(15): 3039. CrossRef - Machine learning models including insulin resistance indexes for predicting liver stiffness in United States population: Data from NHANES
Kexing Han, Kexuan Tan, Jiapei Shen, Yuting Gu, Zilong Wang, Jiayu He, Luyang Kang, Weijie Sun, Long Gao, Yufeng Gao
Frontiers in Public Health.2022;[Epub] CrossRef - The crosstalk between insulin resistance and nonalcoholic fatty liver disease/metabolic dysfunction-associated fatty liver disease: a culprit or a consequence?
Dae-Jeong Koo, Won-Young Lee
Cardiovascular Prevention and Pharmacotherapy.2022; 4(4): 132. CrossRef
 PubReader
 ePub Link
 Cite
Cite