Frequency of Exposure to Impaired Fasting Glucose and Risk of Mortality and Cardiovascular Outcomes
Article information

Abstract
Background
Metabolic abnormalities, such as impaired fasting glucose (IFG), are dynamic phenomena; however, it is unclear whether the timing of IFG exposure and cumulative exposure to IFG are related to cardiovascular disease (CVD) and mortality risk.
Methods
Data were extracted from a nationwide population-based cohort in South Korea for adults (n=2,206,679) who were free of diabetes and had 4 years of consecutive health examination data. Fasting blood glucose levels of 100 to 125 mg/dL were defined as IFG, and the number of IFG diagnoses for each adult in the 4-year period was tabulated as the IFG exposure score (range, 0 to 4). Adults with persistent IFG for the 4-year period received a score of 4.
Results
The median follow-up was 8.2 years. There were 24,820 deaths, 13,502 cases of stroke, and 13,057 cases of myocardial infarction (MI). IFG exposure scores of 1, 2, 3, and 4 were associated with all-cause mortality (multivariable-adjusted hazard ratio [aHR], 1.11; 95% confidence interval [CI], 1.08 to 1.15; aHR, 1.16; 95% CI, 1.12 to 1.20; aHR, 1.20; 95% CI, 1.15 to 1.25; aHR, 1.18; 95% CI, 1.11 to 1.25, respectively) compared with an IFG exposure score of 0. Adjusting for hypertension and dyslipidemia attenuated the slightly increased risk of MI or stroke associated with high IFG exposure scores, but significant associations for all-cause mortality remained.
Conclusion
The intensity of IFG exposure was associated with an elevated risk of all-cause mortality, independent of cardiovascular risk factors. The association between IFG exposure and CVD risk was largely mediated by the coexistence of dyslipidemia and hypertension.
INTRODUCTION
Prediabetes, which is characterized by impaired glucose tolerance and impaired fasting glucose (IFG), is defined as an intermediate stage of hyperglycemia preceding diabetes mellitus (DM). IFG is considered to show a close association with metabolic syndrome and insulin resistance [1]. Numerous recent studies have explored the associations of prediabetes with cardiovascular disease (CVD) risk and mortality [2–7]. However, heterogeneity across studies in cutoff points and reference groups has led to substantial inconsistencies in the research. For example, some studies have reported that fasting blood glucose (FBG) levels of 110–125 mg/dL, but not 100–109 mg/dL, showed significant associations with CVD-related morbidity or mortality [3–5]. Other investigators reported that FBG levels exceeding 100 mg/dL had a positive relationship with mortality [6]. Another study found that the risks of cardiovascular and all-cause mortality among older adults with prediabetes were similar to those among adults with normoglycemia after accounting for cardiovascular risk factors [7].
Prediabetes is a dynamic condition; it may revert to normal glucose tolerance or progress to DM. A limitation of most earlier studies on this topic is that they did not consider the dynamic nature of prediabetes [8,9]. Diabetes occurs in approximately 5% to 10% of people with prediabetes annually, while the rate of reversion to normoglycemia depends upon population characteristics and the definition of prediabetes [10]. Data published by the Centers for Disease Control and Prevention showed that prediabetes progressed to diabetes in fewer than 2% of individuals per year, and in fewer than 10% within 5 years [8]. Metabolic abnormalities are dynamic phenomena that are capable of changing over time, leading to the hypothesis that the risk of all-cause mortality and CVD could be predicted by the intensity of exposure to IFG, defined in terms of extent and duration of exposure. Thus, the present study investigated whether cumulative IFG exposure over 4 years was associated with the risk of all-cause mortality and CVD through an analysis of large-scale data from the Korean National Health Insurance Service (NHIS) database.
METHODS
Study population
We analyzed the Korean NHIS datasets of claims and health checkups from January 2006 to December 2017. Almost all Koreans (97.2% of the Korean population of about 50 million) are covered by the NHIS, which constitutes a non-profit, single-payer health care organization administered by the government of South Korea. All enrolled participants are required to undergo a standard health examination at least every 2 years [11–13]. Researchers have access to the NHIS database for population-based cohort studies. This database contains information on demographic characteristics, national health examinations, primary and secondary diagnoses, hospitalizations, medical treatment, and drug prescriptions; the data are routinely collected and quality control is conducted before the database is made available for research purposes [11–13]. The cohort database is linked to the Statistics Korea death registration database. In the present study, individuals aged ≥20 years who underwent national health examinations in 2009 or 2010 (index years) were selected. Among them, data were extracted for 2,513,127 adults who received four consecutive annual health examinations starting in 2006 or 2007. Adults who had DM prior to the index year were excluded (n=241,674), as were those who had a history of myocardial infarction (MI) or stroke prior to the index year (n=9,704). The purpose of this step was to prevent confounding by pre-existing disease and to attenuate the potential impact of reverse causality. Additionally, we excluded 55,070 participants who were missing data for any variable. The study population ultimately consisted of 2,206,679 individuals (Supplemental Fig. S1). Approval for this study was granted by the Institutional Review Board of Yeouido St. Mary’s Hospital, The Catholic University of Korea (No. SC20ZISE0150). Deidentified information was used for analysis; therefore, informed consent was not required.
Definition of IFG exposure score
IFG was defined as an FBG level of 100 to 125 mg/dL, in accordance with the guidelines of the Korean Diabetes Association [14]. The number of IFG diagnoses over 4 years was tabulated as the IFG exposure score, which ranged from 0 to 4. Individuals who did not have IFG at any of the health examinations were given an IFG exposure score of 0, whereas a score of 4 was given to those who received an IFG diagnosis at all four health examinations [9].
To account for the degree of FBG elevation in calculation of the IFG exposure score. IFG was categorized as grade 1 (FBG 100 to 109 mg/dL) or grade 2 (110 to 125 mg/dL). The IFG score was calculated by assigning 0, 1, and 2 points to FBG levels of 100, 100–109, and 110–125 mg/dL, respectively [9]. These severity-weighted scores were then totaled to yield an IFG exposure score that ranged from 0 to 8 points, such that a person with a total of 8 points had an FBG ≥110 mg/dL at all four annual health checkups.
Study outcomes and follow-up
The study endpoints were incident MI, stroke, or death. Incident MI was defined as newly recorded International Classification of Disease, 10th Revision (ICD-10) codes I21 or I22 during hospitalization. Stroke was defined according to ICD-10 codes I63 or I64 recorded during hospitalization episodes with simultaneous claims for brain computed tomography or brain magnetic resonance imaging. For participants who did not develop MI or stroke during the course of follow-up, study completion was defined as the date of their death or the end of follow-up (December 31, 2017), whichever occurred earlier.
Statistical analysis
Baseline characteristics are shown as the mean±standard deviation, median (interquartile range), or number (%). Five groups of participants were generated based on their IFG exposure score (0–4). The incidence rate (person-years) of the outcomes of interest (MI, stroke, and all-cause mortality) was calculated as the number of incident cases divided by the total follow-up duration. Hazard ratios (HRs) and 95% confidence intervals (CIs) for the outcomes were estimated using a Cox proportional hazards model according to baseline FBG or the IFG exposure score. In a multivariable-adjusted proportional hazards analysis, model 1 adjusted for age, sex, alcohol consumption, smoking, physical activity, and body mass index (BMI). Model 2 adjusted further for hypertension and dyslipidemia. The potential effect modification by age, sex, BMI categories (obesity), and smoking was evaluated through a stratified analysis, with interactions tested using the likelihood-ratio test. All statistical analyses were performed using SAS version 9.4 (SAS Institute, Cary, NC, USA). A P value <0.05 was considered statistically significant.
RESULTS
Baseline characteristics by the IFG exposure score
More than half (52.8%) of the population participants maintained normoglycemia for 4 years, with an IFG exposure score of 0. Persistent IFG was found in 2.7% of participants and intermittent IFG (i.e., IFG at one or more time points and normoglycemia at other points) was found in 44.5% of participants. A higher IFG exposure score was associated with older age, male sex, a higher baseline FBG, higher total cholesterol levels, and higher blood pressure (both systolic and diastolic) (Table 1).

Baseline Characteristics of Participants by the Impaired Fasting Glucose Exposure Score
Risk of all-cause mortality, MI, and stroke according to FBG levels
The median follow-up was 8.2 years. During this period, there were 24,820 deaths (1.12%), 13,502 cases of stroke (0.61%), and 13,057 cases of MIs (0.59%). A J-shaped relationship was found between baseline FBG and the risk of all-cause mortality. Using an FBG level of <80 mg/dL as the reference category, FBG levels of 110–119 and 120–125 mg/dL were associated with a significantly higher risk for all-cause mortality (HR, 1.14; 95% CI, 1.08 to 1.21; P<0.001 and HR, 1.26; 95% CI, 1.16 to 1.37; P<0.001, respectively) (Fig. 1A, model 1). The FBG category between 90 and 99 mg/dL was associated with the lowest risk of all-cause mortality. These associations were still significant after adjusting for hypertension and dyslipidemia (Fig. 1A, model 2).
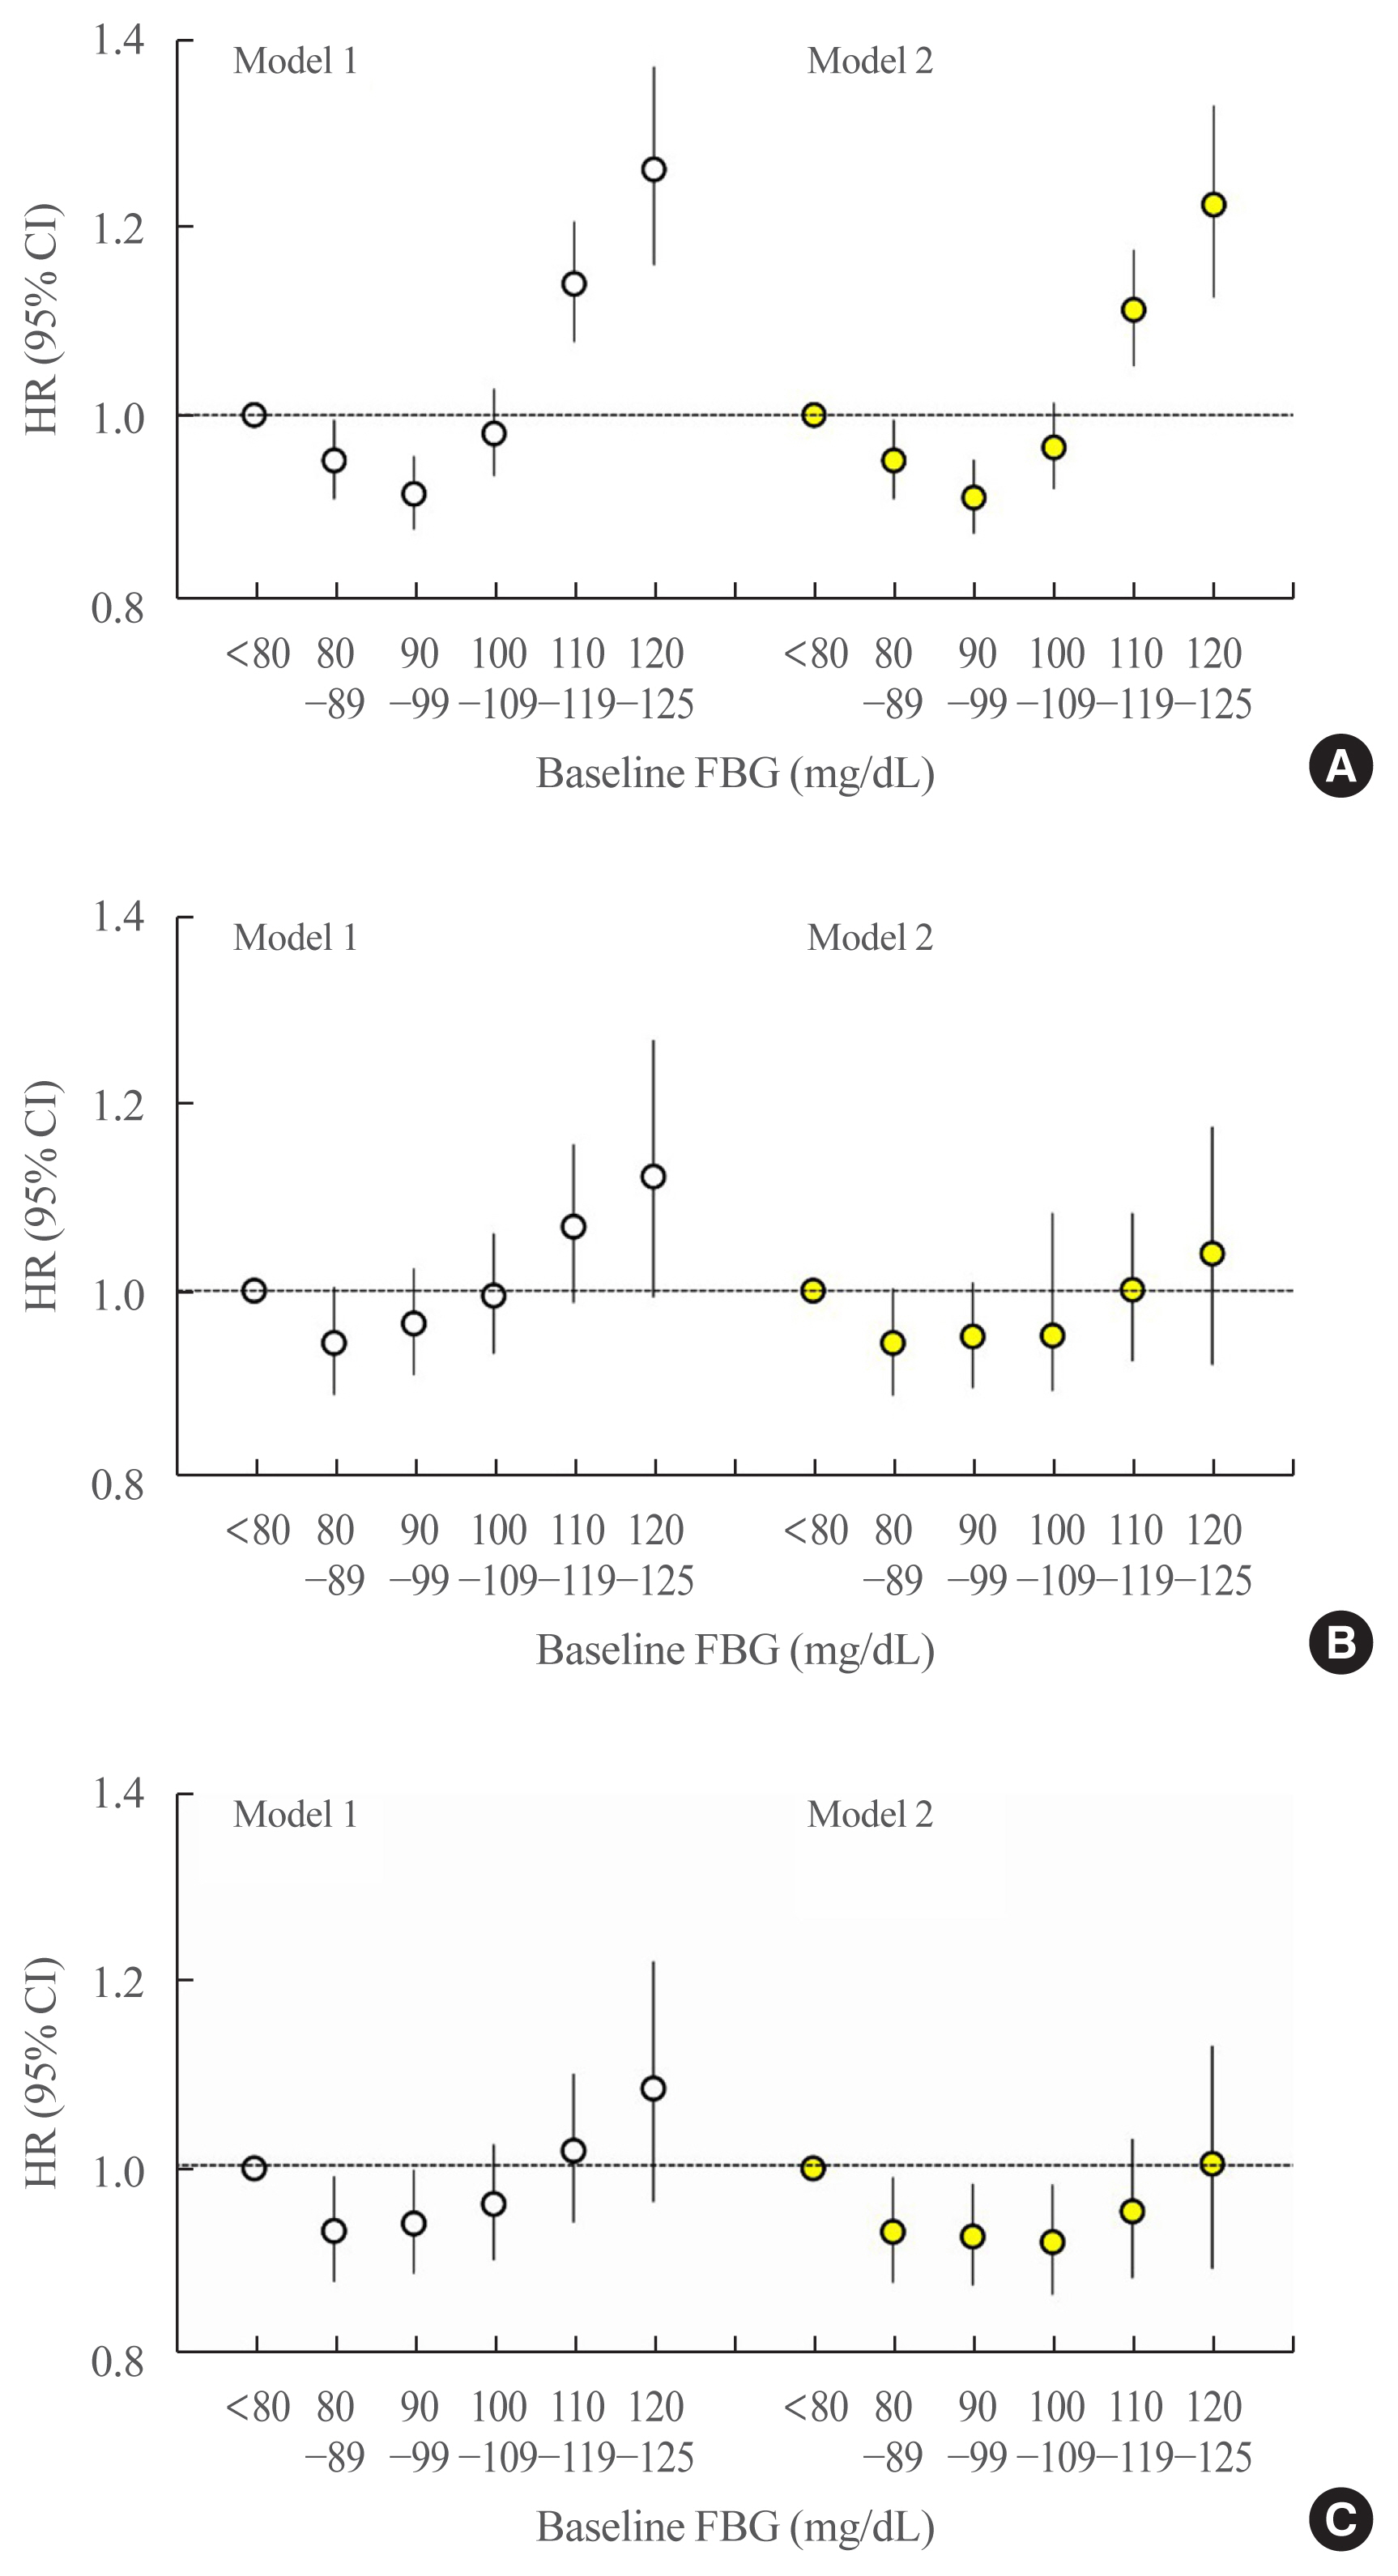
Hazard ratios (HRs) and 95% confidence intervals (CIs) for (A) all-cause mortality, (B) myocardial infarction (MI), and (C) stroke according to baseline fasting blood glucose (FBG) levels. The reference group was defined as those with baseline FBG levels <80 mg/dL. The left-hand panel shows data adjusted for age, sex, alcohol consumption, smoking, physical activity, and body mass index (model 1). The right-hand panel presents data upon full adjustment for covariates including hypertension and dyslipidemia (model 2).
The association of MI or stroke with FBG levels was J-shaped, but without statistical significance (Fig. 1B, C). Nonetheless, the FBG category between 80 and 89 mg/dL presented the lowest risk of MI or stroke.
Risk of all-cause mortality, MI, and stroke according to the IFG exposure score
The multivariable-adjusted HRs of all-cause mortality associated with IFG exposure scores of 1, 2, 3, and 4 were 1.11 (95% CI, 1.08 to 1.15), 1.16 (95% CI, 1.12 to 1.20), 1.20 (95% CI, 1.15 to 1.25), and 1.18 (95% CI, 1.11 to 1.25), respectively, compared with an IFG exposure score of 0 (Fig. 2A, model 1). After further adjustment for dyslipidemia and hypertension, the HRs of all-cause mortality associated with IFG exposure scores of 1, 2, 3, and 4 were 1.10 (95% CI, 1.07 to 1.14), 1.14 (95% CI, 1.10 to 1.18), 1.17 (95% CI, 1.12 to 1.22), and 1.14 (95% CI, 1.08 to 1.22), respectively, compared with an IFG exposure score of 0 (Fig. 2A, model 2). In an analysis of the severity-weighted IFG exposure scores, which ranged from 0 to 8, the multivariable-adjusted HRs for all-cause mortality showed a continuous, linear positive relationship with the IFG exposure score (Fig. 3A).
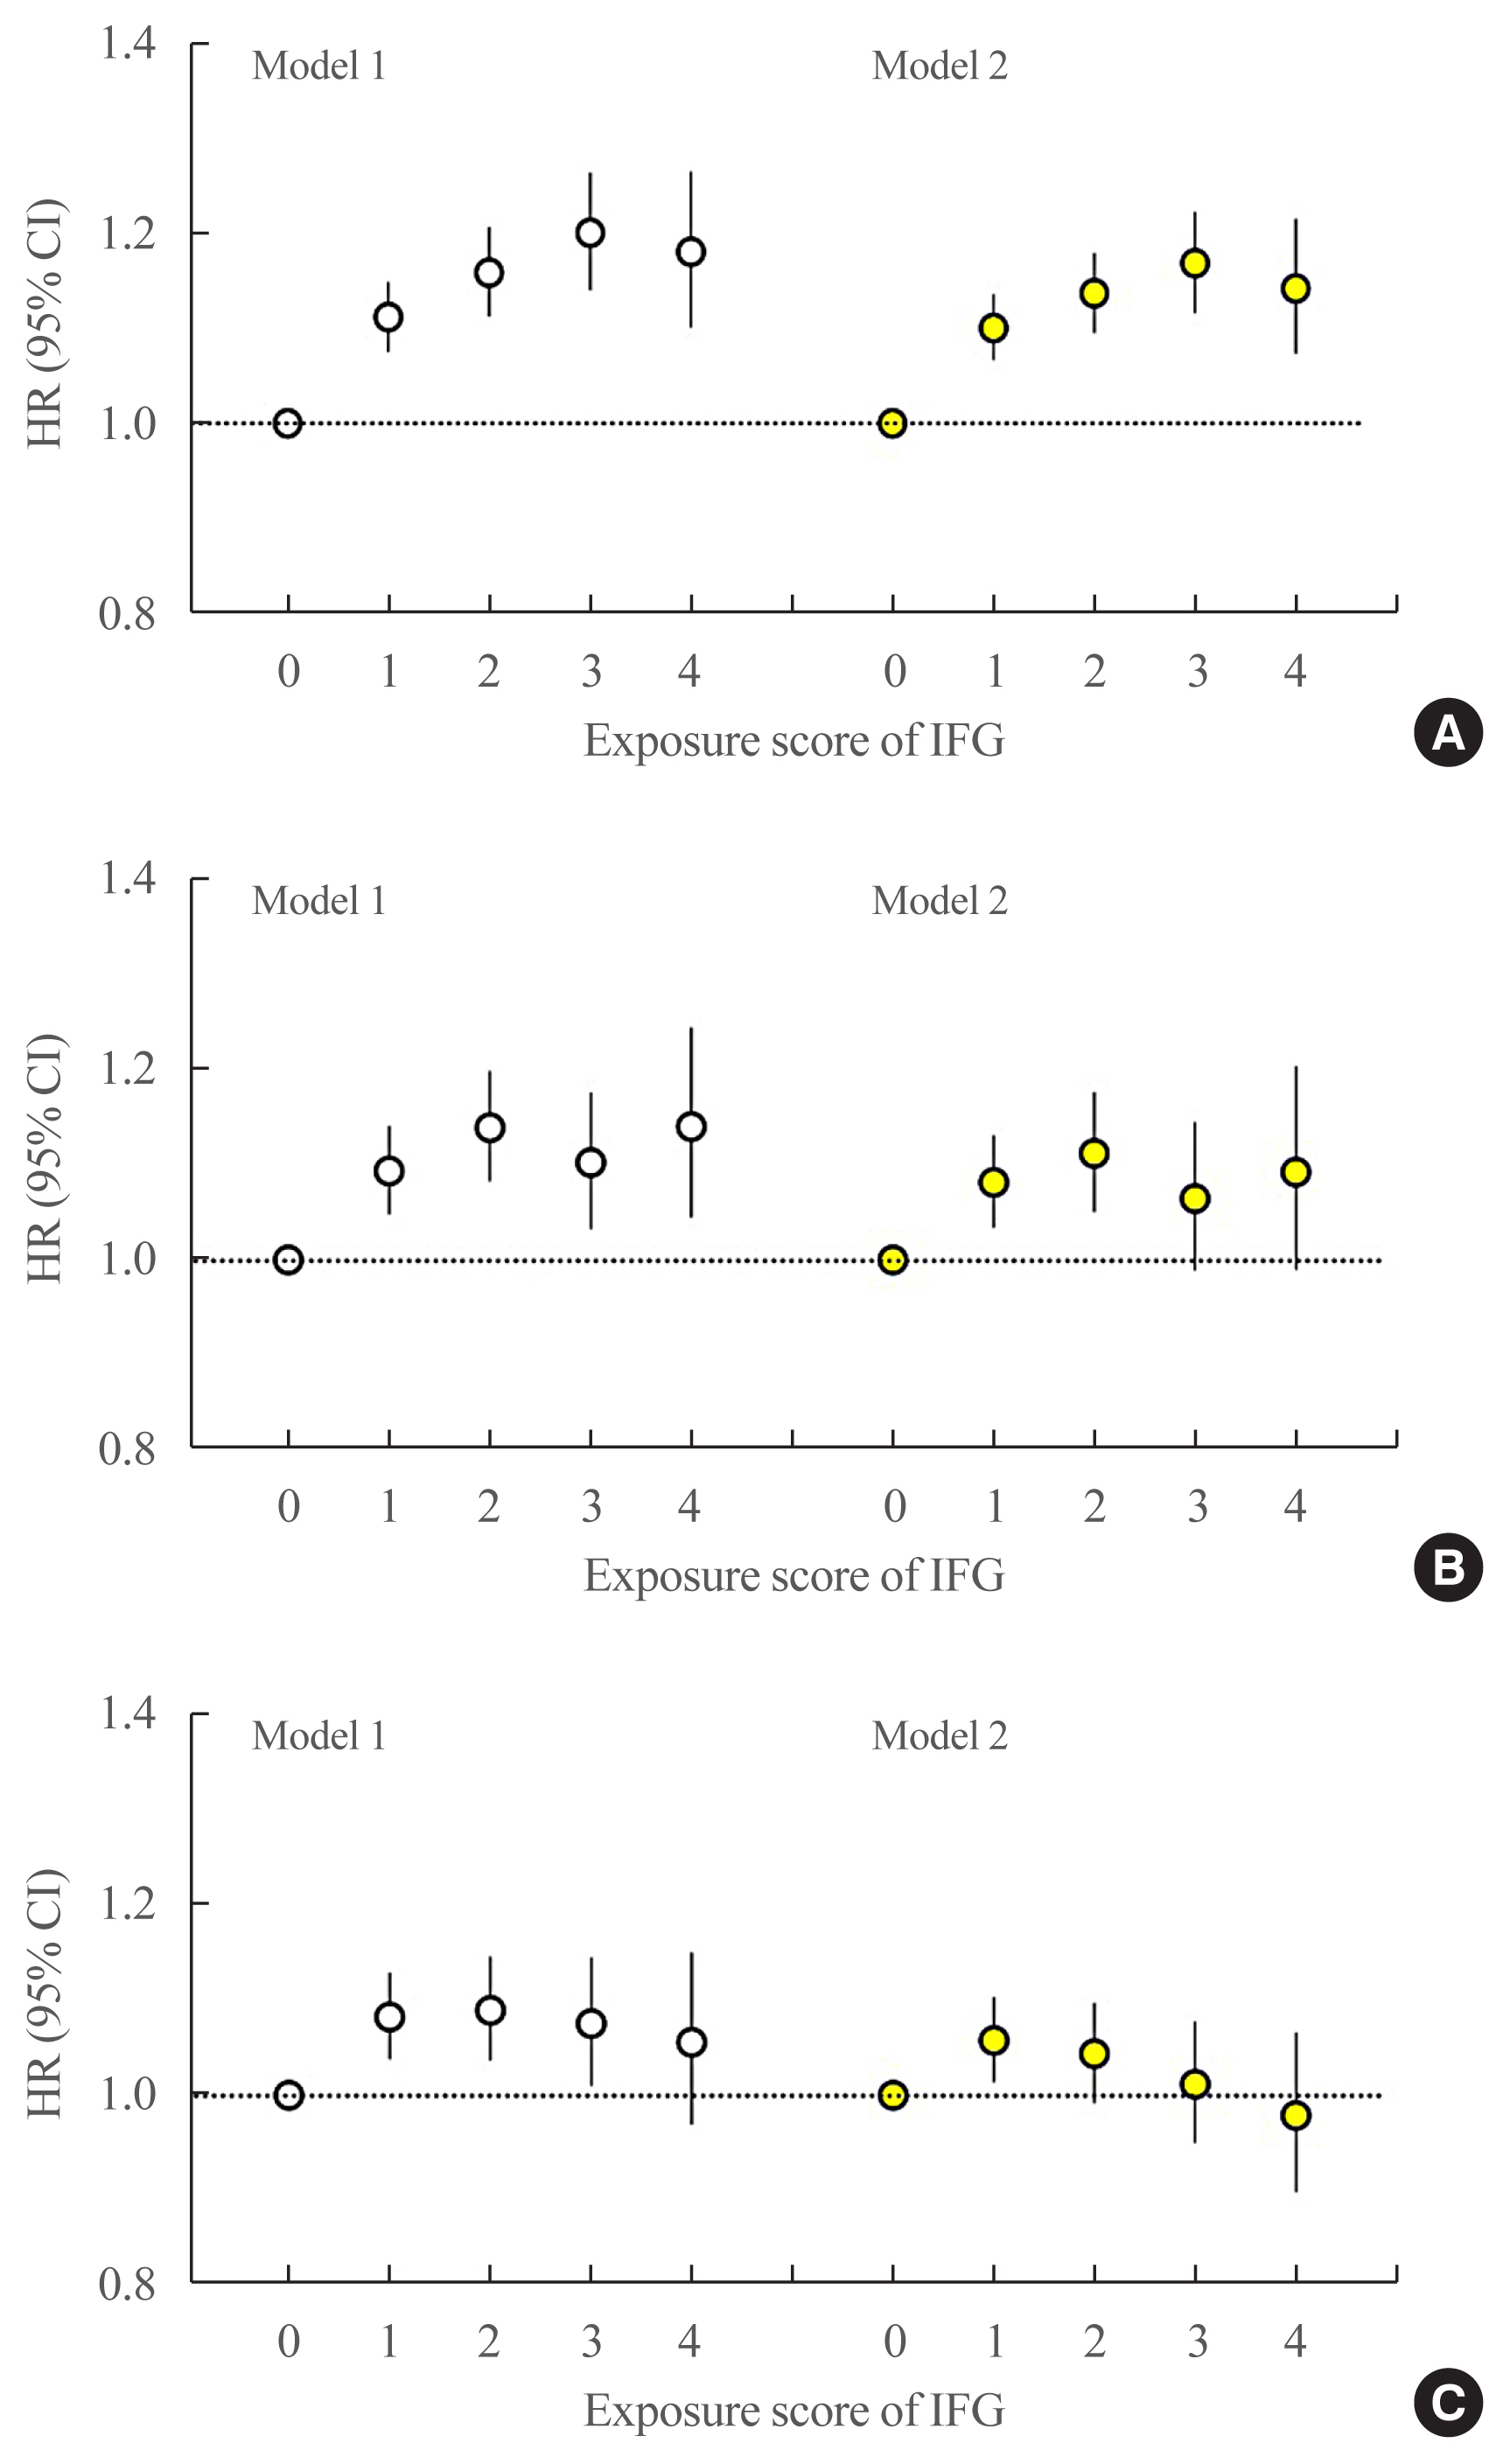
Hazard ratios (HRs) and 95% confidence intervals (CIs) for (A) all-cause mortality, (B) myocardial infarction (MI), and (C) stroke according to impaired fasting glucose (IFG) exposure score. The group with an IFG exposure score of 0 was considered the reference group. The left-hand panel shows data adjusted for age, sex, alcohol consumption, smoking, physical activity, and body mass index (model 1). The right-hand panel presents data upon full adjustment for covariates including hypertension and dyslipidemia (model 2).
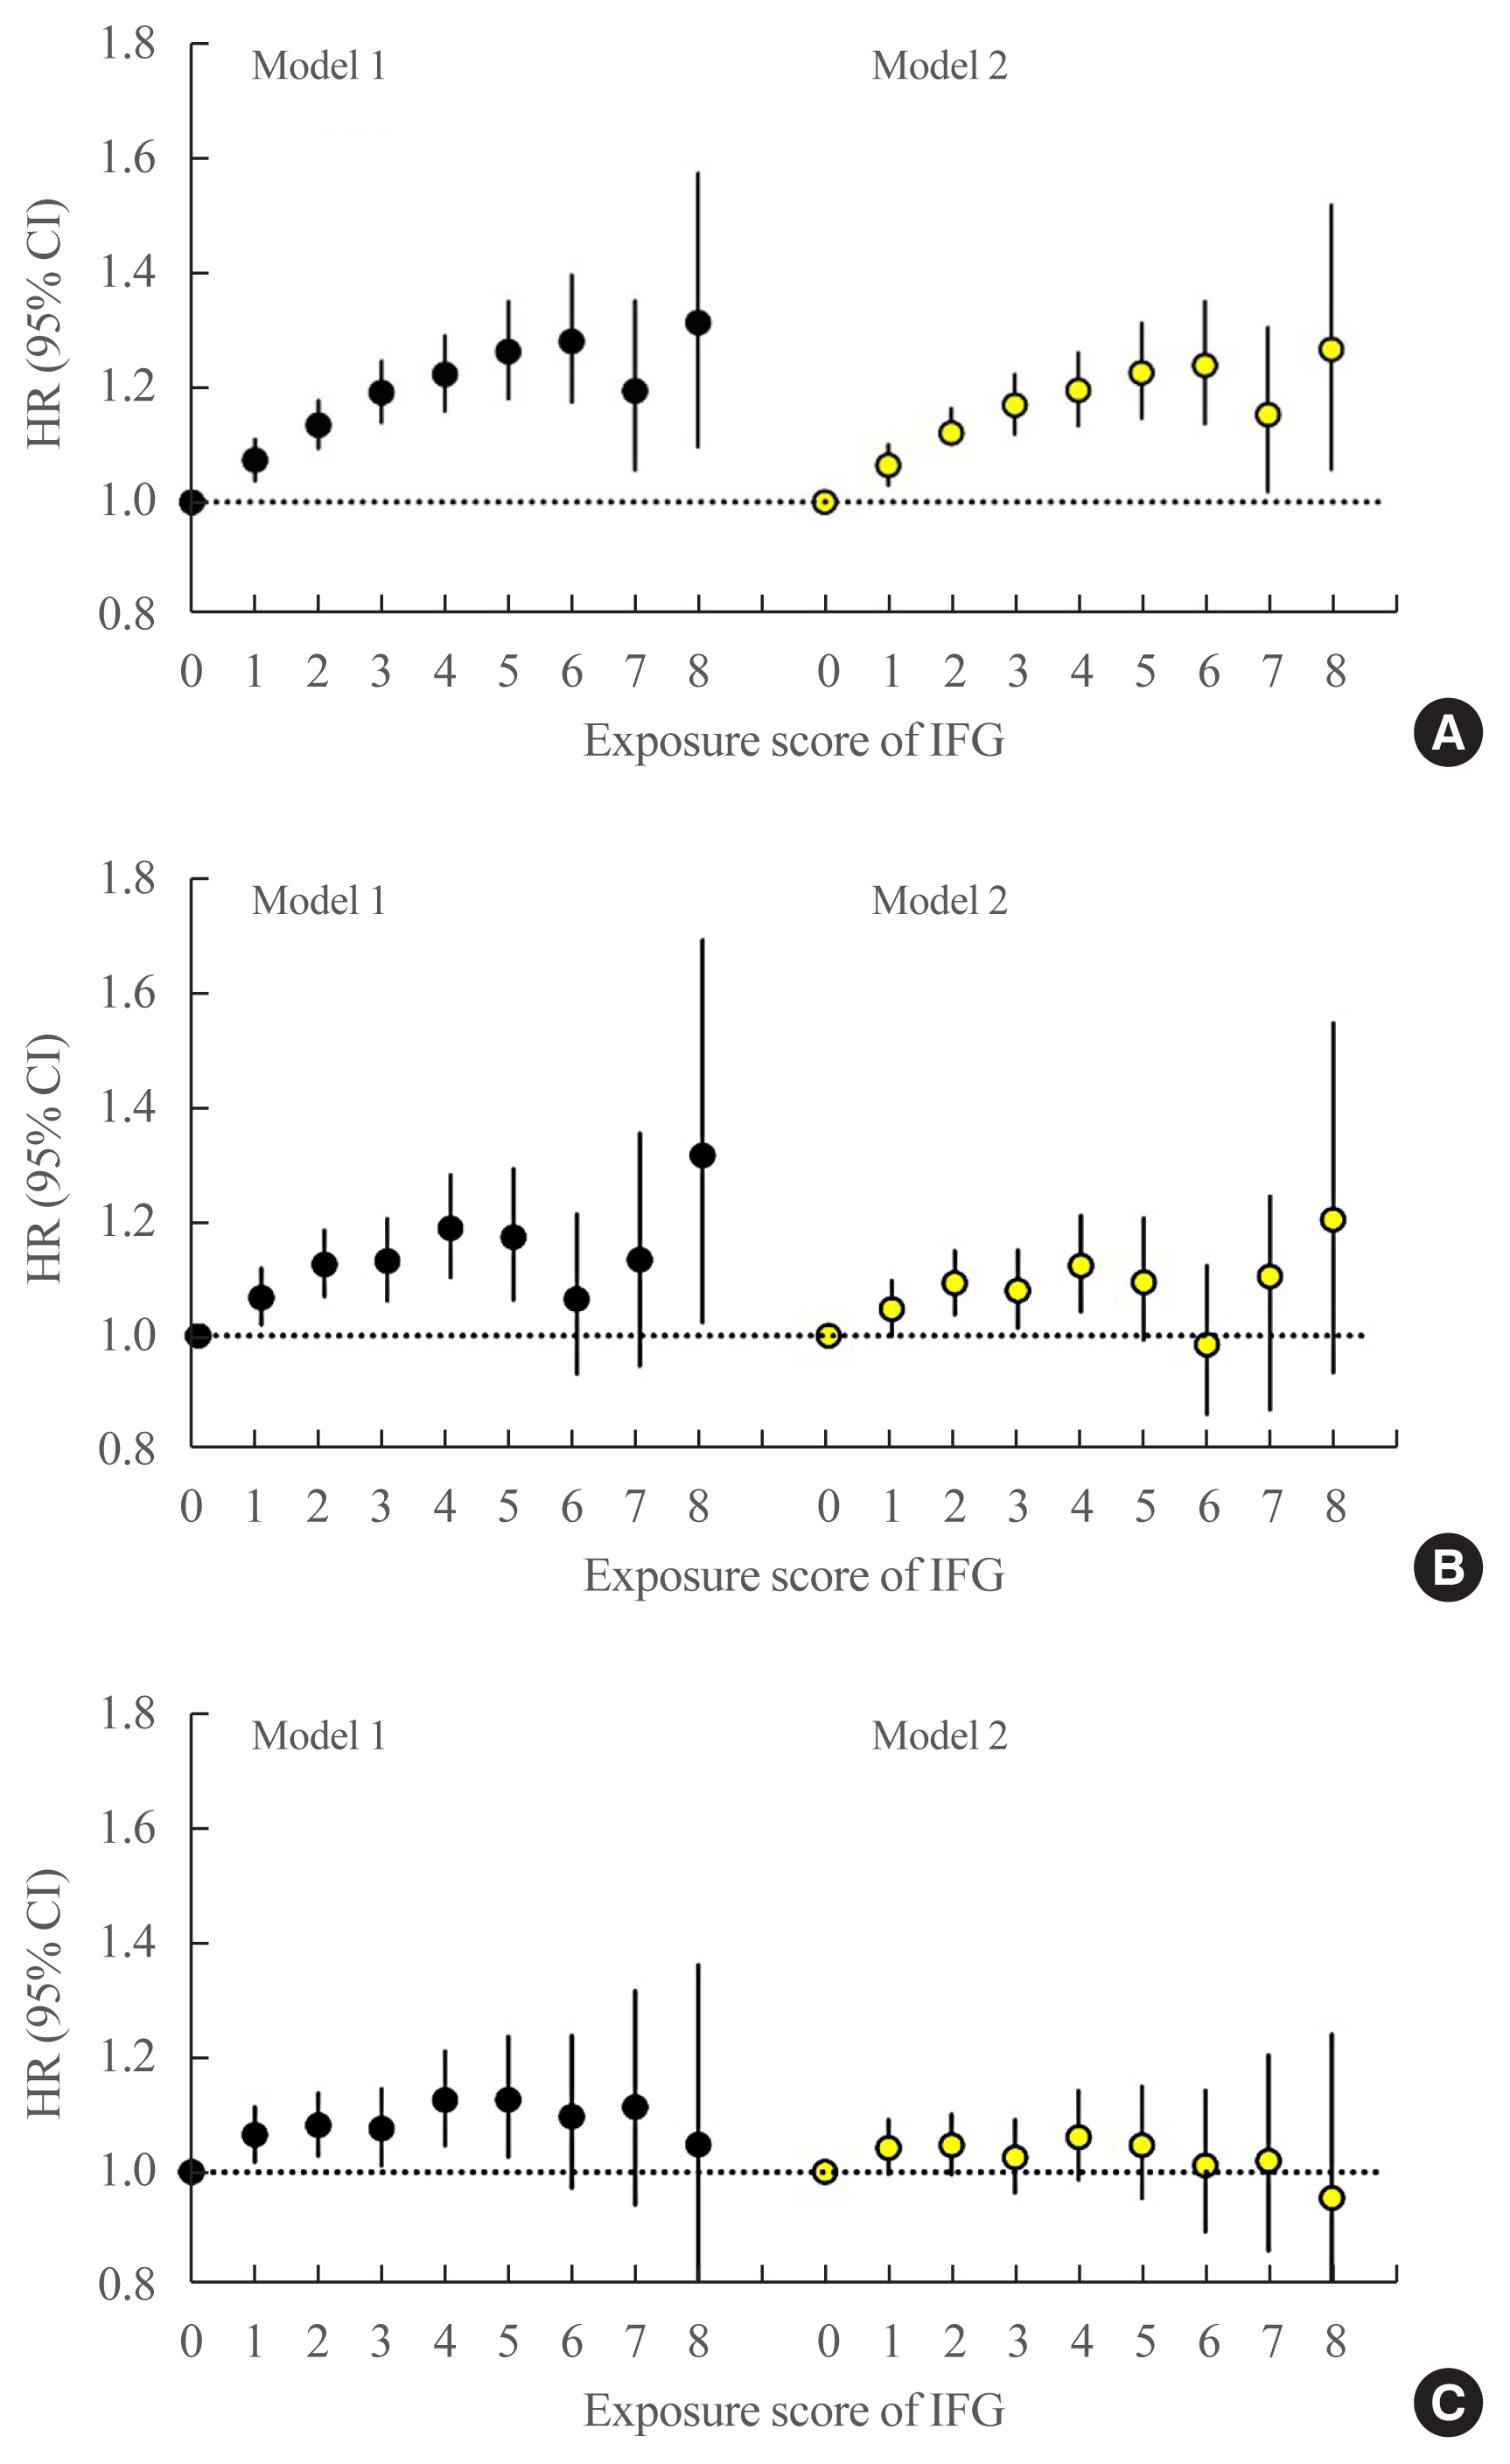
Hazard ratios (HRs) and 95% confidence intervals (CIs) for (A) all-cause mortality, (B) myocardial infarction, and (C) stroke according to the severity-weighted impaired fasting glucose (IFG) exposure score ranging from 0 to 8. This IFG score was defined by assigning 0, 1, and 2 points to FBG levels of <100, 100–109, and 110–125 mg/dL, respectively. These scores were then summed to generate an IFG exposure score ranging from 0 to 8 points. A person with a score of 8 points corresponds to a person with a FBG ≥110 mg/dL at all annual health checkups over 4 years. The left-hand panel shows data adjusted for age, sex, alcohol consumption, smoking, physical activity, and body mass index (model 1). The right-hand panel presents data upon full adjustment for covariates including hypertension and dyslipidemia (model 2).
The multivariable-adjusted HRs of MI associated with IFG exposure scores of 1, 2, 3, and 4 were 1.09 (95% CI, 1.05 to 1.14), 1.14 (95% CI, 1.08 to 1.20), 1.10 (95% CI, 1.03 to 1.18), and 1.14 (95% CI, 1.05 to 1.25), respectively, compared with an IFG exposure score of 0 (Fig. 2B, model 1). After further adjustment for dyslipidemia and hypertension, the HRs of MI associated with IFG exposure scores of 1, 2, 3, and 4 were 1.08 (95% CI, 1.04 to 1.13), 1.11 (95% CI, 1.05 to 1.18), 1.07 (95% CI, 0.99 to 1.15), and 1.09 (95% CI, 0.99 to 1.20), respectively, compared with an IFG exposure score of 0 (Fig. 2B, model 2). Using the severity-adjusted IFG exposure score (ranging from 0 to 8 points), the association of the IFG exposure score with MI was also attenuated after adjustment for hypertension and dyslipidemia (Fig. 3B, model 2). Similar trends were observed for the risk of stroke (Figs. 2C, 3C).
Subgroup and sensitivity analyses
We conducted stratified analyses according age, sex, BMI category, and smoking (Table 2). The association of the IFG exposure score with all-cause mortality was similar across all subgroups except for the BMI category and smoking. The association of the IFG exposure score with all-cause mortality was significant in non-obese individuals (BMI <25 kg/m2, P for interaction =0.016) and current smokers (P for interaction =0.022).

Risk of All-Cause Mortality, Myocardial Infarction, and Stroke by Impaired Fasting Glucose Exposure Score in Subgroups According to Age, Sex, Obesity, and Smoking
A sensitivity analysis was performed, with the exclusion of subjects in whom the endpoints occurred within 1 year of the follow-up to account for the possibility of reverse causation. Similar results were obtained (Supplemental Table S1). To further reduce the potential impact of reverse causation, we also excluded those with a history of cancer at baseline (Supplemental Table S1). The results were nearly identical, indicating that the positive association of a high IFG exposure score with high mortality is unlikely to be due to the presence of serious illness.
DISCUSSION
The intensity of exposure to IFG, defined in terms of extent and duration, was associated with an elevated risk of all-cause mortality. This association was independent of cardiovascular risk factors (e.g., smoking, obesity, lipid profile, or blood pressure levels). The risk of MI or stroke was marginally elevated in those diagnosed with IFG one or more times in 4 years, but this risk was attenuated after further adjustment for hypertension and dyslipidemia.
In our study, cumulative IFG exposure showed an association with an elevated risk of mortality. Upon further adjustment for hypertension and dyslipidemia, the association of IFG exposure score with mortality remained consistent. Even a single exposure to IFG over 4 years demonstrated a positive association with mortality risk. It has been reported that prediabetes is associated with a higher risk of all-cause mortality in Asians than in non-Asians [2]. Asians with prediabetes have a significantly higher risk of microvascular events and worsening nephropathy than Western populations [2,15]. A recent study identified prediabetes as an independent risk factor for glomerular hyperfiltration and increased albuminuria in a 5.6-year follow-up period [16]. Microvascular events may account at least partially for the association between prediabetes and all-cause mortality. Diabetes has also been found to be associated with a considerable risk of premature mortality from a diverse range of conditions—encompassing degenerative disorders, external causes, infectious diseases, and several types of cancer—independent of other major risk factors [6,17]. The authors of this study identified continuous associations between FBG levels exceeding 100 mg/dL and mortality risk, providing support for the direct relevance of hyperglycemia in these observed relationships [6].
Subjects who were diagnosed with IFG once or twice in 4 years had an approximately 10% increased risk of MI, but those diagnosed with IFG three or four times in 4 years had an non-significant increased risk of MI (Fig. 2B, model 2). We previously reported that the IFG exposure score showed a strong, dose-dependent association with type 2 DM [9]. The cumulative incidence of type 2 DM in subjects with an IFG exposure score of 4 (persistent IFG) was 25.5 per 1,000 person-years, which substantially exceeded the rate of 4.6 per 1,000 person-years in the entire study population [9]. Some individuals with a higher IFG exposure score might have developed type 2 DM during follow-up and subsequently received treatment (e.g., statins or antihypertensive medications) to reduce their risk of CVD events. This could potentially have weakened the association between a higher IFG exposure score and risk of MI and subsequent mortality. Over the range of IFG exposure scores from 0 to 8 points, subjects with a higher IFG exposure score (scores of 6 to 8) had a non-significantly increased risk of MI, and their risk was further attenuated upon adjustment for hypertension and dyslipidemia. The association of IFG with MI risk was largely driven by the concomitant presence of dyslipidemia and hypertension.
Previous studies have shown that prediabetes defined by the World Health Organization IFG criterion (FBG 110 to 125 mg/dL), but not by the American Diabetes Association IFG criterion (FBG 100 to 125 mg/dL), is associated with an elevated risk of cardiovascular and all-cause mortality [3–5]. The results of the present study align with those findings. We also found that a baseline FBG level of 110 to 125 mg/dL was associated with an elevated risk of all-cause mortality. The FBG category between 90 and 99 mg/dL was associated with the lowest risk of all-cause mortality. While the association between MI or stroke with FBG levels was J-shaped, it did not show statistical significance, especially after adjustment for hypertension and dyslipidemia. An increased risk of cardiovascular events has been reported in older patients with diabetes and particularly high comorbidities among those with low FBG levels (<95 mg/dL) [18]. In the general Korean population, the HR of all-cause mortality was significantly higher in the low (<70 mg/dL) and high FBG ranges (≥126 mg/dL) than in the reference range (80 to 99 mg/dL) [19]. In our study, we also a J-shaped association between FBG levels and all-cause mortality, as the range of 90 to 99 mg/dL was associated with the lowest risk of all-cause mortality. The exact mechanism underlying the relationship between low FBG levels and a high risk of mortality remains unclear, although one possibility is that low FBG levels could indicate poor nutritional status, liver dysfunction, or other undetectable illnesses [19,20].
Prediabetes defined by an elevated hemoglobin A1c (HbA1c) has been reported to show a poorer prognosis than prediabetes defined by FBG or 2-hour postprandial glucose levels [7]. Conversely, the Whitehall II study reported that adjustment for cardiovascular risk factors (e.g., systolic blood pressure, cholesterol levels, and smoking) completely eliminated the risk of CVD associated with prediabetes defined by HbA1c [7], suggesting that the clustering of other hyperglycemia-related cardiovascular risk factors may principally explain the elevation of CVD risk in individuals with prediabetes [7,21,22]. Patients with prediabetes who had five or more ideal cardiovascular health metrics showed lower CVD risk than those with normal glucose regulation [22].
This study has some limitations. First, due to a lack of the corresponding data, it was not possible to analyze postprandial glucose or HbA1c levels, despite the strong reported association of these factors with CVD. Second, bias may have occurred due to the selection of study subjects according to whether they received health examinations in 4 consecutive years because men and employee subscribers have a higher likelihood of participating in these regular health checkups. Third, the potential effects of unmeasured confounding variables, such as the presence of subclinical illness or changes in weight, physical activity, or lifestyle, remain. Subjects with a high IFG score may have had a sedentary lifestyle that remained unchanged despite the diagnosis of IFG or may have had other subclinical diseases. Finally, the NHIS database does not include data on specific causes of death. Therefore, it was not possible to conclude that the elevated risk of mortality in subjects with high IFG exposure scores was associated with CVD death.
In conclusion, cumulative IFG exposure was associated with a higher risk of mortality. Even a single exposure to IFG over 4 years demonstrated an association with a higher risk of mortality. The risk of MI or stroke was marginally increased in those diagnosed with IFG one or more times in 4 years.
Acknowledgements
This work was supported by the Korean Endocrine Society of EnM Research Award 2020.
This study was supported by a grant of the Institute of Clinical Medicine Research in the Yeouido St. Mary’s Hospital, Catholic University of Korea. The funders of the study had no role in study design, data collection, data analysis, data interpretation, or writing of the report.
SUPPLEMENTARY INFORMATION
Sensitivity Analysis Excluding Subjects with the Occurrence of End Points within 1 Year of Follow-up (Center Column) or Excluding Subjects with a History of Cancer at Baseline (Right Column)
Study flowchart. MI, myocardial infarction.
Notes
CONFLICTS OF INTEREST
No potential conflict of interest relevant to this article was reported.
AUTHOR CONTRIBUTIONS
Conception or design: S.H.L., M.K.K. Acquisition, analysis, or interpretation of data: K.H., M.K.K. Drafting the work or revising: S.H.L., H.S.K., M.K.K. Final approval of the manuscript: S.H.L., K.H., H.S.K., M.K.K.