Articles
- Page Path
- HOME > Endocrinol Metab > Volume 37(2); 2022 > Article
-
Original ArticleDiabetes, Obesity and Metabolism Association of High-Density Lipoprotein Cholesterol Phenotypes with the Risk of Cardiovascular Diseases and Mortality: A Cohort Study in Korea
 Keypoint
The authors investigated whether low high-density lipoprotein cholesterol (HDL-C) and isolated and non-isolated low HDL-C levels are associated with the risk of cardiovascular diseases and all-cause mortality among Korean adults. The authors analyzed 8,665,841 individuals aged ≥20 years who had undergone a health examination provided by the Korean National Health Insurance Service (NHIS) in 2009 and were followed up until the end of 2018. In this study, low and non-isolated low HDL-C were associated with cardiovascular diseases and mortality. -
Ga Eun Nam1*
 , Youn Huh2*, Jin-Hyung Jung3, Kyungdo Han4, Seon Mee Kim1, on Behalf of the Taskforce Team of the Obesity Fact Sheet of the Korean Society for the Study of Obesity
 -
Endocrinology and Metabolism 2022;37(2):261-271.
DOI: https://doi.org/10.3803/EnM.2021.1259
Published online: April 25, 2022
1Department of Family Medicine, Korea University Guro Hospital, Korea University College of Medicine, Seoul, Korea
2Department of Family Medicine, Uijeongbu Eulji Medical Center, Eulji University, Uijeongbu, Korea
3Department of Biostatistics, College of Medicine, The Catholic University of Korea, Seoul, Korea
4Department of Statistics and Actuarial Science, Soongsil University, Seoul, Korea
- Corresponding author: Seon Mee Kim. Department of Family Medicine, Korea University Guro Hospital, Korea University College of Medicine, 148 Gurodong-ro, Guro-gu, Seoul 08308, Korea Tel: +82-2-2626-3276, Fax: +82-2-837-3966, E-mail: ksmpdh@korea.ac.kr
- *These authors contributed equally to this work.
Copyright © 2022 Korean Endocrine Society
This is an Open Access article distributed under the terms of the Creative Commons Attribution Non-Commercial License (http://creativecommons.org/licenses/by-nc/4.0/) which permits unrestricted non-commercial use, distribution, and reproduction in any medium, provided the original work is properly cited.
ABSTRACT
-
Background
- We investigated whether low high-density lipoprotein cholesterol (HDL-C) and isolated and non-isolated low HDL-C levels are associated with the risk of cardiovascular diseases and all-cause mortality among Korean adults.
-
Methods
- We included 8,665,841 individuals aged ≥20 years who had undergone a health examination provided by the Korean National Health Insurance Service (NHIS) in 2009 and were followed up until the end of 2018. The hazard ratios (HRs) and 95% confidence intervals (CIs) for study outcomes were calculated using multivariable Cox proportional hazard regression analysis.
-
Results
- During the 8.2 years of mean follow-up, myocardial infarction (MI), stroke, and all-cause mortality occurred in 81,431, 110,996, and 244,309 individuals, respectively. After adjusting for confounding variables (model 3), individuals with low HDL-C and lower HDL quartiles were associated with significantly increased risks of all three outcomes, compared to those with normal HDL-C and highest HDL-C quartile (all P<0.001), respectively. HRs for incident MI (1.28; 95% CI, 1.26 to 1.30), stroke (1.13; 95% CI, 1.11 to 1.15), and all-cause mortality (1.07; 95% CI, 1.05 to 1.08) increased in the non-isolated low HDL-C group compared to the normal HDL-C group. Isolated low HDL-C also showed an increase in the HRs of incident stroke (1.06; 95% CI, 1.04 to 1.08) and all-cause mortality (1.30; 95% CI, 1.28 to 1.32).
-
Conclusion
- Low HDL-C and non-isolated low HDL-C were associated with increased risk of MI, stroke, and all-cause mortality, and isolated low HDL-C was associated with incident stroke and all-cause mortality risk.
- Keywords: Low high-density lipoprotein cholesterol; Non-isolated low high-density lipoprotein cholesterol; Isolated low high-density lipoprotein cholesterol; Myocardial infarction; Stroke; Mortality
- Cardiovascular diseases (CVDs) account for about one-third of annual deaths worldwide [1]. As a recognized modifiable risk factor for CVD development and progression, dyslipidemia is characterized by increased low-density lipoprotein cholesterol (LDL-C) and triglycerides as well as decreased high-density lipoprotein cholesterol (HDL-C) [2]. In the well-known Framingham Study, the coronary artery disease (CAD) risk increased sharply as HDL-C levels decreased progressively to <40 mg/dL [3]. In previous studies, low HDL-C levels occurred in more than 60% of the patients with CAD [4] and increased the risk of myocardial infarction (MI), stroke, postprocedural re-stenosis, severe premature disease in the main coronary artery, and sudden death [5-8]. Several studies have shown that HDL-C levels ≥40 mg/dL are ideal for patients with diabetes mellitus and CVD [9-12]. Other prospective cohort studies have reported an inverse linear association between HDL-C levels and mortality [12].
- However, recent trials have found that increasing HDL-C levels failed to improve cardiovascular outcomes and suggested that high HDL-C levels may not be a protective factor against CVDs [13-18]. The association between decreased HDL-C levels and mortality also remains controversial; in the Framingham Heart Study, triglycerides levels were not routinely measured, and the association between isolated low HDL-C levels and CVD risk could not be determined [3]. Thus, whether high triglycerides and low HDL-C levels are associated with different risks of incident CVDs in various conditions of distinct populations remains unclear. Studies on how the low HDL-C phenotypes (i.e., isolated and non-isolated low HDL-C) are associated with the risks of CVDs and all-cause death are scarce. In particular, studies that examined the relationship between the HDL-C phenotypes and cardiovascular outcomes and mortality using population-based data are limited [19]. To help fill this gap in the research, this study aimed to evaluate the associations between HDL-C phenotypes and cardiovascular outcomes, as well as all-cause mortality, using South Korean population-based cohort data.
INTRODUCTION
- Data source and study population
- This study used the South Korean population-based cohort database established by the South Korean National Health Insurance Service (NHIS). The NHIS, which is the sole and universal insurer system for Korea that began in 2002, provides a minimum of health examinations every 2 years for all insured South Koreans. Thus, there is a health information dataset available within this system, including demographics, medical treatment, diagnosis codes of diseases, and records of health examinations. The medical claims for disease diagnosis and treatment were based on the International Classification of Diseases, 10th Revision, Clinical Modification (ICD-10-CM) [20].
- For our study, we initially identified 10,490,501 adults aged ≥20 years who had undergone a health examination conducted by the NHIS between January 1, 2009, and December 31, 2009. Thereafter, we excluded those who had been given a prior MI or stroke diagnosis between 2002 and the time of enrollment (n=762,247), those with missing data for any of the study variables (n=385,917), and those treated with lipid-lowering medication (n=676,496). The remaining 8,665,841 individuals (4,863,046 men and 3,802,795 women) were eligible for the analyses. Requirements for obtaining informed consent were waived because the data comprised of fully anonymized and de-identified information. Our study protocol conforms to the ethical guidelines of the Declaration of Helsinki and was approved by the Institutional Review Board of Korea University Guro Hospital (No 2018GR0096).
- Study outcomes
- The study endpoints were newly diagnosed MI, stroke, or all-cause mortality (whichever occurred first until December 31, 2018). MI was identified based on the recorded ICD-10-CM codes for MI (i.e., I21 or I22) during hospitalization. Stroke was determined based on the recorded ICD-10-CM code for stroke (i.e., I63 or I64) during hospitalization and on claims for brain image testing such as computerized tomography or magnetic resonance imaging. Information regarding mortality was identified from the records of Korea National Statistical Office, as each individual’s unique de-identified number in the NHIS was linked to mortality information from the Korea National Statistical Office. The study individuals were followed up with until December 31, 2018 or until the occurrence of either of the study endpoints.
- Assessment and definitions
- The South Korean NHIS provides detailed information on participants’ demographics and lifestyles, which is regularly obtained through standardized self-report questionnaires. Smoking status is classified as either non-smoker or current smoker based on history. Heavy alcohol drinkers were defined as individuals who consumed ≥30 g of alcohol per day [21]. Regular exercise was defined as high-intensity exercise ≥3 days per week or moderate-intensity exercise ≥5 days per week. Low-income was assigned to the lowest 20% of income, and the rest defined as non-low-income. The health examinations conducted by the NHIS included both anthropometric and laboratory findings. The participants’ height, weight, and waist circumference (WC) measurements were included. Body mass index (BMI) was calculated as weight (kg) divided by height (m) squared. Blood pressure (BP) was measured with the participant in a seated position after at least 5 minutes of rest. Laboratory samples were obtained after overnight fasting, and the following measurements taken: serum glucose levels, creatinine, and a cholesterol battery (total cholesterol, triglycerides, HDL-C, and LDL-C).
- Regarding HDL-C categories, we defined low HDL-C as less than 40 mg/dL in men and less than 50 mg/dL in women. Subsequently, we divided the participants into HDL-C quartile groups; the cutoff HDL-C levels were 44, 50, and 59 mg/dL in men and 48, 57, and 67 mg/dL in women. In addition, low HDL-C was categorized into isolated low HDL-C and non-isolated low HDL-C groups. Non-isolated low HDL-C was defined as low HDL-C with triglycerides ≥150 mg/dL or LDL-C ≥130 mg/dL and isolated low HDL-C was defined as low HDL-C with triglycerides <150 mg/dL and LDL-C <130 mg/dL. In patients with type 2 diabetes, non-isolated low HDL-C was defined as low HDL-C with triglycerides ≥150 mg/dL or LDL-C ≥100 mg/dL, and isolated low HDL-C was defined as low HDL-C with triglycerides <150 mg/dL and LDL-C <100 mg/dL. In addition, we defined high LDL-C to HDL-C ratio as ≥2.5 and divided the participants into LDL-C/HDL-C quartile groups [22].
- We defined underlying comorbidities based on health examination results and medical claims made for disease diagnosis. Hypertension was defined as BP ≥140/90 mm Hg or at least one medication prescription claim made per year with the ICD-10-CM codes I10–I13 or I15. Type 2 diabetes was defined as a fasting serum blood glucose level ≥126 mg/dL or at least one medication prescription claim per year with the ICD-10-CM codes E11–E14. Estimated glomerular filtration rate (eGFR) was calculated using the method devised in the Modification of Diet in Renal Disease study [23]. Individuals with eGFR of less than 60 mL/min/1.73 m2 were defined as chronic kidney disease patients.
- Statistical analysis
- We performed statistical analyses using SAS software version 9.4 (SAS Institute, Cary, NC, USA). The baseline characteristics of the study subjects according to the HDL-C categories were compared using analysis of variance for continuous variables and a chi-squared test for categorical variables. Incidence rates of MI, stroke, and all-cause mortality were calculated by dividing the number of events by 1,000 person-years. Kaplan–Meier curves were plotted to identify the cumulative incidence probability of study outcomes according to the HDL-C categories. Multivariable Cox proportional hazard regression analyses were performed to evaluate the association between HDL-C categories and incident MI, stroke, and all-cause mortality; hazard ratios (HRs) and 95% confidence intervals (CIs) were calculated. Model 1 was not adjusted, Model 2 was adjusted for age and sex, and Model 3 was additionally adjusted for smoking status, alcohol consumption, physical activity, income, BMI, hypertension, type 2 diabetes, and eGFR. Model 4 was further adjusted for LDL-C and triglycerides. We interpreted the findings from Model 3 as main result due to possible multicollinearity. We also examined the association between HDL-C categories and the risk of study outcomes in both sexes, patients with type 2 diabetes, and participants after dividing them into six groups based on LDL-C levels (<70, 70–99, 100–129, 130–159, 160–189, ≥190 mg/dL). Stratified analyses by sex and age were also performed. Statistical significance was set at a P value of less than 0.05 (P<0.05).
- Availability of data and materials
- This study was conducted using a database from the Korea National Health Insurance System, and the study results do not necessarily represent the opinion of the Korea National Health Insurance Corporation. Restrictions apply to the availability of the data, which were used under license for this study.
METHODS
- Baseline characteristics
- Table 1 shows baseline characteristics for 8,665,841 individuals according to HDL-C categories. At baseline, 6,992,376 (80.7%) individuals had normal HDL-C, 642,710 (7.4%) had isolated low HDL-C, and 1,030,749 (11.9%) had non-isolated low HDL-C. The proportion of men was higher than that of women in the normal HDL-C group. Mean age increased across the normal, isolated low HDL-C, and non-isolated low HDL-C groups. There was a larger number of current smokers, heavy alcohol drinkers, and regular exercisers in the normal HDL-C group than in the other groups. The non-isolated low HDL-C group exhibited the highest mean values of cardiometabolic parameters, including weight, BMI, WC, BP, and serum levels of fasting glucose, total cholesterol, triglycerides, and LDL-C. Individuals with non-isolated low HDL-C had the lowest mean values of serum HDL-C and eGFR, the highest proportion of hypertension, type 2 diabetes, and chronic kidney disease.
- Incidence and risk of study outcomes according to HDL-C phenotypes
- During the 8.2 years of mean follow-up, the number of cases of MI, stroke, and all-cause death were 81,431 (0.94%), 110,996 (1.28%), and 244,309 (2.82%), respectively. Table 2 presents the incidence rate and HR (95% CI) of MI, stroke, and all-cause mortality in each HDL-C group. The low HDL-C group exhibited 1.2-, 1.1-, and 1.2-fold higher incidence rates of MI, stroke, and all-cause mortality, respectively, than the normal HDL-C group. The low HDL-C group was associated with increased risk of incident MI, stroke, and all-cause mortality compared to the normal HDL-C group, even after adjusting for potential confounding variables (Model 3) (HR, 1.20; 95% CI, 1.18–1.22 for MI; HR, 1.11; 95% CI, 1.09 to 1.12 for stroke; and HR, 1.15; 95% CI, 1.14 to 1.16 for all-cause mortality). The HRs of the study outcomes significantly increased in the lower HDL-C quartile groups compared to the highest quartile group (Q1 vs. Q4 of HDL-C in Model 3: HR, 1.27; 95% CI, 1.24 to 1.29 for MI; HR, 1.12; 95% CI, 1.11 to 1.14 for stroke; and HR, 1.08; 95% CI, 1.07 to 1.10 for all-cause mortality). High LDL-C/HDL-C and higher LDL-C/HDL-C quartiles were associated with higher risks of study outcomes than normal LDL-C/HDL-C group and the lowest LDL-C/HDL-C quartile, respectively (Supplemental Table S1).
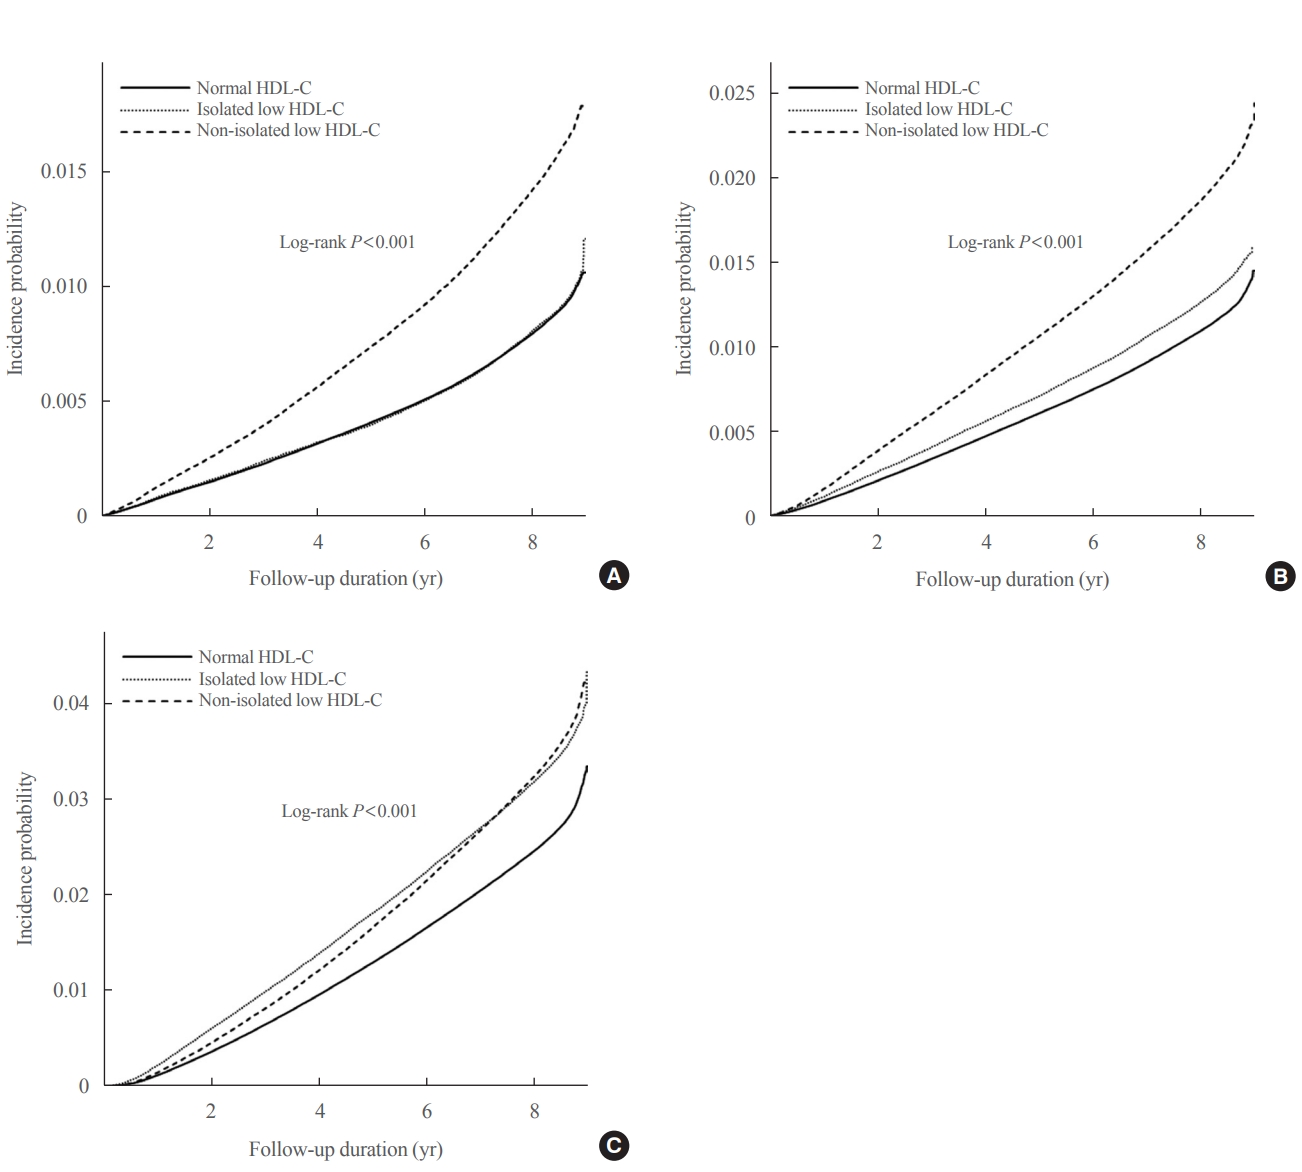
- The Kaplan–Meier curves in Fig. 1 show the incidence probabilities of the study outcomes according to HDL-C categories. The non-isolated low HDL-C group had the highest incidence probabilities of MI and stroke, which was followed by the isolated low HDL-C and normal HDL-C groups (log-rank P<0.001). However, the isolated low HDL-C group had the highest incidence probability of all-cause mortality in approximately 7 years, followed by the non-isolated low HDL-C and normal HDL-C groups (log-rank P<0.001). Compared to the normal HDL-C group, the non-isolated low HDL-C group had increased HRs for incident MI (HR, 1.28; 95% CI, 1.26 to 1.30), stroke (HR, 1.13; 95% CI, 1.11 to 1.15), and all-cause mortality (HR, 1.07; 95% CI, 1.05 to 1.08) in Model 3, whereas the isolated low HDL-C group had increased HRs for incident stroke (HR, 1.06; 95% CI, 1.04 to 1.08) and all-cause mortality (HR, 1.30; 95% CI, 1.28 to 1.32) (Table 3).
- We further analyzed the risk of study outcomes according to the HDL-C phenotypes in groups divided by sex. In both men and women, low HDL-C was associated with an increased risk of study outcomes compared to the normal HDL-C, and the HRs of the study outcomes significantly increased in the lowest HDL-C quartile groups compared to the highest quartile group (Supplemental Table S2). The non-isolated low HDL-C group had the highest HRs for incident MI, while the isolated low HDL-C group had the highest HRs for incident stroke and all-cause mortality in both sexes (Supplemental Table S3).
- Supplemental Tables S4, S5 present the incidence and HRs of study outcomes according to HDL-C phenotypes among patients with type 2 diabetes (n=527,835). In all the models, the HRs of outcomes significantly increased among the low HDL-C group compared with the normal HDL-C group and the HRs of outcomes significantly increased in the lowest HDL-C quartile groups compared to the highest quartile group (Supplemental Table S4). The non-isolated low HDL-C group had the highest HRs for incident MI and stroke, whereas the isolated low HDL-C group had the highest HRs for all-cause mortality (Supplemental Table S5).
- Additionally, we analyzed the HRs of study outcomes according to HDL-C phenotypes in groups divided by six LDL-C categories (LDL-C: <70, 70–99, 100–129, 130–159, 160–189, ≥190 mg/dL). Generally, HRs of study outcomes increased in the low HDL-C and the lowest HDL-C quartile groups compared to normal HDL-C group and the highest HDL-C quartile groups, respectively (Supplemental Table S6). In groups with LDL-C <130 mg/dL, the isolated low HDL-C group had the highest HRs for study outcomes compared to the normal HDL-C group (Supplemental Table S7).
- Risk of study outcomes according to HDL-C phenotypes in the subgroups
- Table 4 presents the results of the stratified analyses according to sex and age. The associations between non-isolated low HDL-C and incident MI were stronger in men and younger individuals than in women and older individuals (P for interaction <0.001) and those between non-isolated low HDL-C and stroke were stronger in younger individuals (P for interaction=0.003). Men and individuals aged 40 to 64 years showed stronger associations between isolated low HDL-C and all-cause mortality than the other subgroups (P for interaction <0.001).
RESULTS
- In our nationwide cohort study, we found that low HDL-C levels were independently associated with increased risk of MI, stroke, and all-cause mortality. Compared to the normal HDL-C group, the non-isolated low HDL-C group had a 1.28-, 1.13-, and 1.07-fold increased risk of MI, stroke, and all-cause mortality, respectively. The isolated low HDL-C group had a 1.06- and 1.30-fold increased risk of stroke and all-cause mortality. These findings were similarly observed in both sexes. Our results indicate that low HDL-C as well as non-isolated low HDL-C levels may be risk factors for CVDs, such as MI and stroke, and mortality, and that isolated low HDL-C may increase the risk of stroke and, in particular, all-cause mortality in adults. Moreover, our findings suggest that monitoring and managing low HDL-C levels are particularly vital for the prevention of CVDs and mortality, and that low HDL-C should be cautiously considered a risk factor for stroke and mortality.
- Although low HDL-C levels are a known risk factor for CVD [24,25], recent studies failed to show that high HDL-C levels reduces CVD risk [13-18]. In our study, low HDL-C levels increased the risks of MI and stroke compared to a normal HDL-C level, and HRs for MI and stroke significantly increased across the groups with lower HDL-C quartiles. The Framingham Heart Study revealed an association between low HDL-C and CAD; however, it failed to show any relationship between CAD and other cholesterol categories [11]. In our study, we further classified low HDL-C level as isolated and non-isolated low HDL-C levels. The non-isolated low HDL-C group had increased HRs for MI and stroke compared to the normal HDL-C group, and this group had the highest HR for stroke, which was followed by the isolated HDL-C group. However, a previous meta-analysis among Asian-Pacific participants with 6.8 years of follow-up reported that isolated low HDL-C is associated with increased risk of coronary heart disease but not risk of stroke [26]. This discrepancy could be largely attributed to the study design. Moreover, the meta-analysis included a significant proportion of cross-sectional studies, and its overall sample size was much smaller than our study population. Variations in genetics and factors affecting low HDL-C levels, even among Asian populations, may exist. Our study found that isolated low HDL-C levels are also associated with an increased risk of stroke, which indicates that high LDL-C and triglycerides levels and low HDL-C levels are all associated with an increased stroke risk. In addition, compared to the normal HDL-C group, the isolated low HDL-C group showed increased risk of MI, stroke, and all-cause mortality among the LDL-C <130 mg/dL group. Hence, isolated low HDL-C levels seem to play an important role in the development of MI, stroke, and all-cause mortality among individuals with LDL <130 mg/dL [27].
- The main function of protective atherogenesis of HDL-C is reverse cholesterol transport [28]. In addition, high HDL-C levels may reduce CVD risk for the following reasons: HDL-C reverses endothelial cell dysfunction, activates both vasodilatory and antithrombotic vasodilator production, decreases endothelial cell apoptosis, inhibits platelet aggregation, and inhibits LDL-C oxidation [29]. Moreover, cholesterol efflux from macrophages is likely relevant to atheroprotection [30]. Thus, low HDL-C along with high triglyceride and LDL-C levels also increases the risk of CVDs and mortality.
- In accordance with previous longitudinal studies [31,32], we showed that low HDL-C levels increase mortality risk. One such cohort study in Canada demonstrated that low HDL-C levels are associated with increased HRs for both cardiovascular and non-cardiovascular mortality [19]. We also found that the isolated low HDL-C group was more prominently associated with all-cause mortality than the non-isolated low HDL-C group. However, studies on the association between HDL-C phenotypes and all-cause mortality were very limited and there were differences between the results. In contrast to our study, a pooled analysis in Japan showed that non-isolated low HDL-C increased the CVD mortality by 1.37-fold compared to normal HDL-C; however, isolated low HDL-C did not increase CVD mortality [33]. The different findings between the studies may be attributed to methodological issues; our study had a much larger sample size and adjusted for various confounding factors, including type 2 diabetes that were assessed using a stricter measurement compared to the Japanese study. The association of low HDL-C levels with all-cause mortality risk may be caused by various factors, such as smoking status, physical inactivity, and other comorbidities [19]. Although the underlying mechanism behind the association between isolated low HDL-C and all-cause mortality was not fully revealed, we believe that nutritional status may play a role in that association; a previous study showed that higher mortality risk is correlated with lower LDL-C and triglyceride levels, which are markers of malnutrition [34]. In addition, an isolated low HDL-C level is a more prevalent lipid phenotype in Asian populations and it has been more associated with increased cardiovascular risk than a non-isolated low HDL-C level in Asians in previous studies, although we could not assess cause-specific mortality in ours [26]. This may partly explain the prominent association between isolated low HDL-C and mortality risk, but additional studies are needed to confirm this association. Further studies are needed to identify the role of HDL-C phenotypes in cause-specific mortality.
- In subgroup analysis, the associations between HDL-C phenotypes and the risk of MI and all-cause mortality were stronger among younger individuals than among older individuals. This suggests that control of low HDL-C may be important among young adults. Although previous trials have clearly demonstrated the ability of lipid-lowering medications to significantly increase HDL-C levels, these medications did not exhibit improved clinical outcomes compared to placebos [16,18-20,35]. Our study showed consistent results regarding the association between HDL-C phenotypes and CVD risk irrespective of lipid-lowering medication use. However, the positive relationship between isolated low HDL-C level and all-cause death risk was prominent in individuals who did not use lipid-lowering medications.
- This study has some limitations. First, the database relies on physicians’ decision of a diagnostic code for MI or stroke; thus, misdiagnosis of MI or stroke was possible. Second, because we conducted a retrospective study, causality could not be determined. Although individuals with a prior diagnosis of CVDs before study enrollment were excluded to decrease the possibility of reverse causality, it was still possible based on the long prodromal phase of CVDs. Third, we could not consider other confounding variables affecting CVDs that were not available in the NHIS database. Fourth, the duration and severity of chronic diseases that possibly influenced the incidence of CVD and death could not be considered owing to data limitations. Lastly, our study was included only Korean adults; thus, other ethnicities were not included. Nevertheless, our study had the following strengths: it used a large-scale cohort; the effect of the full categories of HDL-C on the risk of CVD and all-cause death was examined; and comprehensive evaluations with adjustment for various variables that could affect CVDs and potentially influence the results were performed.
- In conclusion, we found that both low HDL-C and non-isolated low HDL-C levels were independently associated with increased risk of MI, stroke, and all-cause mortality. Isolated low HDL-C levels were associated with increased stroke and allcause mortality risk. Particularly, all-cause mortality risk was more strongly associated with isolated low HDL-C than with non-isolated low HDL-C. Our findings suggest that isolated low HDL-C levels may also be a risk factor for stroke and all-cause mortality in the general population. Strategies to increase HDL-C levels may be helpful in preventing future cardiovascular events and mortality. Future studies examining whether controlling each HDL-C phenotype can decrease the risk of CVD development and all-cause mortality are warranted.
DISCUSSION
Supplementary Information
Supplemental Table S1.
Supplemental Table S2.
Supplemental Table S3.
Supplemental Table S4.
Supplemental Table S5.
Supplemental Table S6.
Supplemental Table S7.
-
CONFLICTS OF INTEREST
No potential conflict of interest relevant to this article was reported.
-
AUTHOR CONTRIBUTIONS
Conception or design: G.E.N., Y.H. Acquisition, analysis, or interpretation of data: G.E.N., Y.H., J.H.J., K.H., S.M.K. Drafting the work or revising: G.E.N., Y.H. Final approval of the manuscript: G.E.N., Y.H., J.H.J., K.H., S.M.K.
Article information
-
Acknowledgements
- This work was partially supported by the Korean Society for the Study of Obesity. We would like to thank the Korean National Health Insurance Corporation and all the subjects of the study.

| Variable | Number | Event | IRa |
HR (95% CI) |
||||
|---|---|---|---|---|---|---|---|---|
| Model 1b | Model 2c | Model 3d | Model 4e | |||||
| Myocardial infarction | ||||||||
| Normal HDL-C | 6,992,376 | 60,062 | 1.04 | 1 (ref) | 1 (ref) | 1 (ref) | 1 (ref) | |
| Low HDL-C | 1,673,465 | 21,369 | 1.55 | 1.48 (1.46–1.51) | 1.29 (1.27–1.31) | 1.20 (1.18–1.22) | 1.13 (1.09–1.17) | |
| HDL-C quartiles | ||||||||
| Q1 | 2,155,921 | 27,594 | 1.56 | 1.72 (1.69–1.76) | 1.40 (1.37–1.42) | 1.27 (1.24–1.29) | 1.16 (1.10–1.22) | |
| Q2 | 2,138,155 | 20,244 | 1.15 | 1.27 (1.24–1.30) | 1.18 (1.16–1.21) | 1.12 (1.10–1.15) | 1.07 (1.01–1.13) | |
| Q3 | 2,194,204 | 17,426 | 0.96 | 1.07 (1.04–1.09) | 1.06 (1.04–1.08) | 1.04 (1.02–1.06) | 1.03 (0.97–1.09) | |
| Q4 | 2,177,561 | 16,167 | 0.90 | 1 (ref) | 1 (ref) | 1 (ref) | 1 (ref) | |
| P value | <0.001 | <0.001 | <0.001 | <0.001 | ||||
| Stroke | ||||||||
| Normal HDL-C | 6,992,376 | 81,770 | 1.42 | 1 (ref) | 1 (ref) | 1 (ref) | 1 (ref) | |
| Low HDL-C | 1,673,465 | 29,226 | 2.13 | 1.49 (1.47–1.51) | 1.18 (1.16–1.19) | 1.11 (1.09–1.12) | 1.09 (1.06–1.13) | |
| HDL-C quartiles | ||||||||
| Q1 | 2,155,921 | 36,533 | 2.07 | 1.59 (1.56–1.62) | 1.21 (1.19–1.23) | 1.12 (1.11–1.14) | 1.08 (1.04–1.12) | |
| Q2 | 2,138,155 | 27,103 | 1.54 | 1.19 (1.17–1.21) | 1.07 (1.05–1.09) | 1.04 (1.02–1.06) | 1.01 (0.97–1.05) | |
| Q3 | 2,194,204 | 24,175 | 1.34 | 1.03 (1.01–1.05) | 1.02 (1.00–1.04) | 1.01 (0.99–1.03) | 0.98 (0.94–1.03) | |
| Q4 | 2,177,561 | 23,185 | 1.29 | 1 (ref) | 1 (ref) | 1 (ref) | 1 (ref) | |
| P value | <0.001 | <0.001 | <0.001 | <0.001 | ||||
| All-cause mortality | ||||||||
| Normal HDL-C | 6,992,376 | 185,783 | 3.21 | 1 (ref) | 1 (ref) | 1 (ref) | 1 (ref) | |
| Low HDL-C | 1,673,465 | 58,526 | 4.23 | 1.31 (1.30–1.32) | 1.20 (1.11–1.13) | 1.15 (1.14-1.16) | 1.13 (1.11-1.16) | |
| HDL-C quartiles | ||||||||
| Q1 | 2,155,921 | 76,275 | 4.28 | 1.30 (1.29–1.32) | 1.02 (1.01–1.03) | 1.08 (1.07–1.10) | 1.06 (1.04–1.09) | |
| Q2 | 2,138,155 | 56,195 | 3.17 | 0.97 (0.95–0.98) | 0.91 (0.90–0.92) | 0.97 (0.96–0.98) | 0.95 (0.93–0.98) | |
| Q3 | 2,194,204 | 52,862 | 2.91 | 0.89 (0.88–0.90) | 0.90 (0.89–0.92) | 0.95 (0.94–0.96) | 0.94 (0.92–0.97) | |
| Q4 | 2,177,561 | 58,977 | 3.28 | 1 (ref) | 1 (ref) | 1 (ref) | 1 (ref) | |
| P value | <0.001 | <0.001 | <0.001 | <0.001 | ||||
HDL-C, high-density lipoprotein cholesterol; IR, incidence rate; HR, hazard ratio; CI, confidence interval; Q, quartile.
a Incidence per 1,000 person-years;
b Model 1 was unadjusted;
c Model 2 was adjusted for age and sex;
d Model 3 was adjusted for age, sex, smoking status, alcohol consumption, physical activity, income, body mass index, hypertension, diabetes mellitus, and estimated glomerular filtration rate;
e Model 4 was adjusted for age, sex, smoking status, alcohol consumption, physical activity, income, body mass index, hypertension, diabetes mellitus, estimated glomerular filtration rate, low-density lipoprotein cholesterol, and triglycerides.
| Variable | Number | Event | IRa |
HR (95% CI) |
||||
|---|---|---|---|---|---|---|---|---|
| Model 1b | Model 2c | Model 3d | Model 4e | |||||
| Myocardial infarction | ||||||||
| Normal HDL-C | 6,992,376 | 60,062 | 1.04 | 1 (ref) | 1 (ref) | 1 (ref) | 1 (ref) | |
| Isolated low HDL-C | 642,716 | 5,621 | 1.06 | 1.02 (0.99–1.04) | 1.03 (1.00–1.06) | 1.02 (0.99–1.04) | 1.08 (0.98–1.19) | |
| Non-isolated low HDL-C | 1,030,749 | 15,748 | 1.86 | 1.78 (1.74–1.81) | 1.41 (1.39–1.44) | 1.28 (1.26–1.30) | 1.14 (1.09–1.18) | |
| P value | <0.001 | <0.001 | <0.001 | <0.001 | ||||
| Stroke | ||||||||
| Normal HDL-C | 6,992,376 | 81,770 | 1.42 | 1 (ref) | 1 (ref) | 1 (ref) | 1 (ref) | |
| Isolated low HDL-C | 642,716 | 8,691 | 1.65 | 1.16 (1.13–1.18) | 1.07 (1.05–1.10) | 1.06 (1.04–1.08) | 1.07 (0.99–1.15) | |
| Non-isolated low HDL-C | 1,030,749 | 20,535 | 2.43 | 1.70 (1.68–1.73) | 1.23 (1.21–1.25) | 1.13 (1.11–1.15) | 1.10 (1.06–1.13) | |
| P value | <0.001 | <0.001 | <0.001 | <0.001 | ||||
| All-cause mortality | ||||||||
| Normal HDL-C | 6,992,376 | 185,783 | 3.21 | 1 (ref) | 1 (ref) | 1 (ref) | 1 (ref) | |
| Isolated low HDL-C | 642,716 | 22,057 | 4.15 | 1.29 (1.27–1.31) | 1.29 (1.27–1.31) | 1.30 (1.28–1.32) | 1.40 (1.34–1.46) | |
| Non-isolated low HDL-C | 1,030,749 | 36,469 | 4.28 | 1.33 (1.31–1.34) | 1.04 (1.02–1.05) | 1.07 (1.05–1.08) | 1.08 (1.05–1.10) | |
| P value | <0.001 | <0.001 | <0.001 | <0.001 | ||||
HDL-C, high-density lipoprotein cholesterol; IR, incidence rate; HR, hazard ratio; CI, confidence interval.
a Incidence per 1,000 person-years;
b Model 1 was unadjusted;
c Model 2 was adjusted for age and sex;
d Model 3 was adjusted for age, sex, smoking status, alcohol consumption, physical activity, income, body mass index, hypertension, diabetes mellitus, and estimated glomerular filtration rate;
e Model 4 was adjusted for age, sex, smoking status, alcohol consumption, physical activity, income, body mass index, hypertension, diabetes mellitus, estimated glomerular filtration rate, low-density lipoprotein cholesterol, and triglycerides.
Values are presented as hazard ratio (95% confidential interval) using multivariable Cox proportional hazard regression analysis after adjusting for age, sex, smoking status, alcohol consumption, physical activity, income, body mass index, hypertension, diabetes mellitus, and estimated glomerular filtration rate.
HDL-C, high-density lipoprotein cholesterol.
- 1. GBD 2017 Causes of Death Collaborators. Global, regional, and national age-sex-specific mortality for 282 causes of death in 195 countries and territories, 1980-2017: a systematic analysis for the Global Burden of Disease Study 2017. Lancet 2018;392:1736–88.PubMedPMC
- 2. Arca M, Montali A, Valiante S, Campagna F, Pigna G, Paoletti V, et al. Usefulness of atherogenic dyslipidemia for predicting cardiovascular risk in patients with angiographically defined coronary artery disease. Am J Cardiol 2007;100:1511–6.ArticlePubMed
- 3. Castelli WP, Garrison RJ, Wilson PW, Abbott RD, Kalousdian S, Kannel WB. Incidence of coronary heart disease and lipoprotein cholesterol levels. The Framingham Study. JAMA 1986;256:2835–8.ArticlePubMed
- 4. Rubins HB, Robins SJ, Collins D, Iranmanesh A, Wilt TJ, Mann D, et al. Distribution of lipids in 8,500 men with coronary artery disease. Department of Veterans Affairs HDL Intervention Trial Study Group. Am J Cardiol 1995;75:1196–201.PubMed
- 5. Goldbourt U, Yaari S, Medalie JH. Isolated low HDL cholesterol as a risk factor for coronary heart disease mortality. A 21-year follow-up of 8000 men. Arterioscler Thromb Vasc Biol 1997;17:107–13.PubMed
- 6. Weverling-Rijnsburger AW, Jonkers IJ, van Exel E, Gussekloo J, Westendorp RG. High-density vs low-density lipoprotein cholesterol as the risk factor for coronary artery disease and stroke in old age. Arch Intern Med 2003;163:1549–54.ArticlePubMed
- 7. Shah PK, Amin J. Low high density lipoprotein level is associated with increased restenosis rate after coronary angioplasty. Circulation 1992;85:1279–85.ArticlePubMed
- 8. Pearson TA, Bulkley BH, Achuff SC, Kwiterovich PO, Gordis L. The association of low levels of HDL cholesterol and arteriographically defined coronary artery disease. Am J Epidemiol 1979;109:285–95.PubMed
- 9. Haffner SM; American Diabetes Association. Management of dyslipidemia in adults with diabetes. Diabetes Care 2003;26 Suppl 1:S83–6.ArticlePubMed
- 10. Turner RC, Millns H, Neil HA, Stratton IM, Manley SE, Matthews DR, et al. Risk factors for coronary artery disease in non-insulin dependent diabetes mellitus: United Kingdom Prospective Diabetes Study (UKPDS: 23). BMJ 1998;316:823–8.ArticlePubMedPMC
- 11. Gordon T, Castelli WP, Hjortland MC, Kannel WB, Dawber TR. High density lipoprotein as a protective factor against coronary heart disease. The Framingham Study. Am J Med 1977;62:707–14.ArticlePubMed
- 12. Gordon DJ, Probstfield JL, Garrison RJ, Neaton JD, Castelli WP, Knoke JD, et al. High-density lipoprotein cholesterol and cardiovascular disease. Four prospective American studies. Circulation 1989;79:8–15.ArticlePubMed
- 13. Barter PJ, Caulfield M, Eriksson M, Grundy SM, Kastelein JJ, Komajda M, et al. Effects of torcetrapib in patients at high risk for coronary events. N Engl J Med 2007;357:2109–22.ArticlePubMed
- 14. Schwartz GG, Olsson AG, Abt M, Ballantyne CM, Barter PJ, Brumm J, et al. Effects of dalcetrapib in patients with a recent acute coronary syndrome. N Engl J Med 2012;367:2089–99.ArticlePubMed
- 15. AIM-HIGH Investigators, Boden WE, Probstfield JL, Anderson T, Chaitman BR, Desvignes-Nickens P, et al. Niacin in patients with low HDL cholesterol levels receiving intensive statin therapy. N Engl J Med 2011;365:2255–67.ArticlePubMed
- 16. HPS2-THRIVE Collaborative Group, Landray MJ, Haynes R, Hopewell JC, Parish S, Aung T, et al. Effects of extendedrelease niacin with laropiprant in high-risk patients. N Engl J Med 2014;371:203–12.ArticlePubMed
- 17. Keene D, Price C, Shun-Shin MJ, Francis DP. Effect on cardiovascular risk of high density lipoprotein targeted drug treatments niacin, fibrates, and CETP inhibitors: meta-analysis of randomised controlled trials including 117,411 patients. BMJ 2014;349:g4379.ArticlePubMedPMC
- 18. Voight BF, Peloso GM, Orho-Melander M, Frikke-Schmidt R, Barbalic M, Jensen MK, et al. Plasma HDL cholesterol and risk of myocardial infarction: a mendelian randomisation study. Lancet 2012;380:572–80.PubMedPMC
- 19. Ko DT, Alter DA, Guo H, Koh M, Lau G, Austin PC, et al. High-density lipoprotein cholesterol and cause-specific mortality in individuals without previous cardiovascular conditions: the CANHEART study. J Am Coll Cardiol 2016;68:2073–83.PubMed
- 20. Lee J, Lee JS, Park SH, Shin SA, Kim K. Cohort profile: the National Health Insurance Service-National Sample Cohort (NHIS-NSC), South Korea. Int J Epidemiol 2017;46:e15.ArticlePubMed
- 21. Agarwal DP. Cardioprotective effects of light-moderate consumption of alcohol: a review of putative mechanisms. Alcohol Alcohol 2002;37:409–15.ArticlePubMed
- 22. Chen QJ, Lai HM, Chen BD, Li XM, Zhai H, He CH, et al. Appropriate LDL-C-to-HDL-C ratio cutoffs for categorization of cardiovascular disease risk factors among Uygur adults in Xinjiang, China. Int J Environ Res Public Health 2016;13:235.ArticlePubMedPMC
- 23. Levey AS, Coresh J, Greene T, Stevens LA, Zhang YL, Hendriksen S, et al. Using standardized serum creatinine values in the modification of diet in renal disease study equation for estimating glomerular filtration rate. Ann Intern Med 2006;145:247–54.ArticlePubMed
- 24. Sheridan S, Pignone M, Mulrow C. Framingham-based tools to calculate the global risk of coronary heart disease: a systematic review of tools for clinicians. J Gen Intern Med 2003;18:1039–52.ArticlePubMedPMC
- 25. Toth PP, Barter PJ, Rosenson RS, Boden WE, Chapman MJ, Cuchel M, et al. High-density lipoproteins: a consensus statement from the National Lipid Association. J Clin Lipidol 2013;7:484–525.ArticlePubMed
- 26. Huxley RR, Barzi F, Lam TH, Czernichow S, Fang X, Welborn T, et al. Isolated low levels of high-density lipoprotein cholesterol are associated with an increased risk of coronary heart disease: an individual participant data meta-analysis of 23 studies in the Asia-Pacific region. Circulation 2011;124:2056–64.ArticlePubMed
- 27. Bartlett J, Predazzi IM, Williams SM, Bush WS, Kim Y, Havas S, et al. Is isolated low high-density lipoprotein cholesterol a cardiovascular disease risk factor? New insights from the Framingham Offspring study. Circ Cardiovasc Qual Outcomes 2016;9:206–12.PubMedPMC
- 28. Toth PP. Reverse cholesterol transport: high-density lipoprotein’s magnificent mile. Curr Atheroscler Rep 2003;5:386–93.ArticlePubMed
- 29. Nofer JR, Kehrel B, Fobker M, Levkau B, Assmann G, von Eckardstein A. HDL and arteriosclerosis: beyond reverse cholesterol transport. Atherosclerosis 2002;161:1–16.ArticlePubMed
- 30. Cuchel M, Rader DJ. Macrophage reverse cholesterol transport: key to the regression of atherosclerosis? Circulation 2006;113:2548–55.ArticlePubMed
- 31. Wilson PW, Abbott RD, Castelli WP. High density lipoprotein cholesterol and mortality. The Framingham Heart Study. Arteriosclerosis 1988;8:737–41.ArticlePubMed
- 32. Goldbourt U, Holtzman E, Neufeld HN. Total and high density lipoprotein cholesterol in the serum and risk of mortality: evidence of a threshold effect. Br Med J (Clin Res Ed) 1985;290:1239–43.ArticlePubMedPMC
- 33. Hirata T, Sugiyama D, Nagasawa SY, Murakami Y, Saitoh S, Okayama A, et al. A pooled analysis of the association of isolated low levels of high-density lipoprotein cholesterol with cardiovascular mortality in Japan. Eur J Epidemiol 2017;32:547–57.ArticlePubMed
- 34. Scarpioni R, Ricardi M, Melfa L, Cristinelli L. Dyslipidemia in chronic kidney disease: are statins still indicated in reduction cardiovascular risk in patients on dialysis treatment? Cardiovasc Ther 2010;28:361–8.ArticlePubMed
- 35. Cannon CP, Shah S, Dansky HM, Davidson M, Brinton EA, Gotto AM, et al. Safety of anacetrapib in patients with or at high risk for coronary heart disease. N Engl J Med 2010;363:2406–15.ArticlePubMed
References
Figure & Data
References
Citations
- Association between HDL levels and stroke outcomes in the Arab population
Aizaz Ali, Omar Obaid, Naveed Akhtar, Rahul Rao, Syed Haroon Tora, Ashfaq Shuaib
Scientific Reports.2024;[Epub] CrossRef - Association of adiposity and fitness with triglyceride-to-high-density lipoprotein cholesterol ratio in youth
Danladi Ibrahim Musa, Abel Lamina Toriola, Nurudeen O Abubakar, Sunday Omachi, Victor B Olowoleni, Kolade B Ayodele
Annals of Pediatric Cardiology.2023; 16(3): 194. CrossRef - Association between cholesterol levels and dementia risk according to the presence of diabetes and statin use: a nationwide cohort study
You-Bin Lee, Min Young Kim, Kyungdo Han, Bongsung Kim, Jiyun Park, Gyuri Kim, Kyu Yeon Hur, Jae Hyeon Kim, Sang-Man Jin
Scientific Reports.2022;[Epub] CrossRef
 PubReader
 ePub Link
 Cite
Cite