Inhibition of miR-146a-5p and miR-8114 in Insulin-Secreting Cells Contributes to the Protection of Melatonin against Stearic Acid-Induced Cellular Senescence by Targeting Mafa
Article information

Abstract
Background
Chronic exposure to elevated levels of saturated fatty acids results in pancreatic β-cell senescence. However, targets and effective agents for preventing stearic acid-induced β-cell senescence are still lacking. Although melatonin administration can protect β-cells against lipotoxicity through anti-senescence processes, the precise underlying mechanisms still need to be explored. Therefore, we investigated the anti-senescence effect of melatonin on stearic acid-treated mouse β-cells and elucidated the possible role of microRNAs in this process.
Methods
β-Cell senescence was identified by measuring the expression of senescence-related genes and senescence-associated β-galactosidase staining. Gain- and loss-of-function approaches were used to investigate the involvement of microRNAs in stearic acid-evoked β-cell senescence and dysfunction. Bioinformatics analyses and luciferase reporter activity assays were applied to predict the direct targets of microRNAs.
Results
Long-term exposure to a high concentration of stearic acid-induced senescence and upregulated miR-146a-5p and miR-8114 expression in both mouse islets and β-TC6 cell lines. Melatonin effectively suppressed this process and reduced the levels of these two miRNAs. A remarkable reversibility of stearic acid-induced β-cell senescence and dysfunction was observed after silencing miR-146a-5p and miR-8114. Moreover, V-maf musculoaponeurotic fibrosarcoma oncogene homolog A (Mafa) was verified as a direct target of miR-146a-5p and miR-8114. Melatonin also significantly ameliorated senescence and dysfunction in miR-146a-5pand miR-8114-transfected β-cells.
Conclusion
These data demonstrate that melatonin protects against stearic acid-induced β-cell senescence by inhibiting miR-146a- 5p and miR-8114 and upregulating Mafa expression. This not only provides novel targets for preventing stearic acid-induced β-cell dysfunction, but also points to melatonin as a promising drug to combat type 2 diabetes progression.
INTRODUCTION
Pancreatic β-cells are highly specialized cells that secrete insulin to regulate glucose homeostasis. A progressive decline in β-cell function is a major driving force in the initiation and progression of type 2 diabetes (T2D) [1]. It is generally accepted that long-term consumption of a high-fat diet leads to β-cell dysfunction, which is attributed to an increase in the concentration of circulating saturated fatty acids (SFAs) [2]. SFAs are mainly composed of stearic acid and palmitic acid. Stearic acid accounts for a smaller proportion of SFAs than palmitic acid. However, the most significant increase in the serum free fatty acid profile of fasting or postprandial T2D patients or high-fat diet-fed mice is found in stearic acid rather than palmitic acid [3-5], probably because the two SFAs are differently processed after digestion [3]. Moreover, we previously showed that the destructive effect of stearic acid on β-cells is greater than that of palmitic acid [4]. Therefore, deciphering the mechanisms underlying stearic acid-induced β-cell dysfunction is essential to develop novel strategies to delay the appearance of T2D resulting from a high-fat diet.
Maintaining mature β-cell identity is important in enabling β-cells to accomplish their normal function [6]. Loss of β-cell identity contributes to β-cell dysfunction [7,8], which is triggered and accelerated by multiple types of stress, including endoplasmic reticulum (ER) stress, oxidative stress, inflammation, aging, and senescence [9-12]. In recent years, the relationship between cell senescence and β-cell identity has been investigated with respect to the development of T2D. Aguayo-Mazzucato et al. [13] demonstrated that β-cell senescence represents a loss of identity leading to β-cell dysfunction, which appeared in mice fed a high-fat diet. Furthermore, the clearance of senescent cells improves β-cell identity and function [13]. Therefore, the identification of effective agents for preventing β-cell senescence is highly desirable but particularly challenging.
Melatonin is predominantly synthesized by the pineal gland and plays a pleiotropic role in various physiological functions, including circadian rhythm regulation, anti-oxidation, anti-aging and anti-cancer mechanisms, and immunity modulation [14-18]. Accumulating evidence indicates that impaired melatonin production is closely associated with an increased risk of T2D [19]. Meanwhile, adequate levels of melatonin protect β-cells against the deleterious effects of metabolically inappropriate environmental factors, such as glucotoxicity [20], proteotoxicity [21], and glucolipotoxicity [22] through anti-apoptotic, anti-ER stress, anti-oxidative stress, and anti-senescence properties [23,24]. However, it is not known whether melatonin can attenuate β-cell senescence in response to high levels of stearic acid. Moreover, the target responsible for the protective effect of melatonin signaling against stearic acid-induced β-cell senescence needs to be explored.
In recent decades, most studies elucidating the mechanisms underlying SFA-induced β-cell dysfunction have focused on protein-coding genes; however, increasing evidence indicates that noncoding RNAs play central roles in the regulation of various biological processes [25]. microRNAs (miRNAs) are small noncoding RNAs that bind to complementary sequences within target mRNAs to cause translational repression [26]. It is well accepted that miRNAs are closely associated with β-cell dysfunction in T2D [27]. However, the contribution of miRNAs to the protective effect of melatonin on stearic acid-induced β-cell senescence remains to be determined.
The present study aimed to confirm the anti-senescence effect of melatonin on stearic acid-treated β-cells and focused on the regulatory role of miRNAs in this process. We previously selected miR-146a-5p and miR-8114 as candidate miRNAs through high-throughput sequencing [28]. Here, we used gain-and loss-of-function approaches to investigate the involvement of these two miRNAs in stearic acid-evoked β-cell senescence and dysfunction. Through bioinformatics analyses and luciferase reporter activity assays, V-maf musculoaponeurotic fibrosarcoma oncogene homolog A (Mafa) was verified as a direct target of miR-146a-5p and miR-8114. Our findings indicate that silencing miR-146a-5p and miR-8114 contributes to the protective effect of melatonin against stearic acid-induced β-cell senescence and dysfunction via Mafa. This provides a potential target for preventing SFA-induced β-cell dysfunction and suggests that melatonin therapy can inhibit the progression of T2D.
METHODS
Chemicals
Stock solutions of stearic acid (Sigma, St. Louis, MO, USA) were prepared as described previously [29]. Briefly, after the sodium salt was dried, it was resuspended in saline and then heated to 80°C until it completely dissolved. Then, 20% (w/v) bovine serum albumin (BSA) was added, and the mixture was stirred at 50°C for 4 hours. The complex was then sterilized and aliquoted. Melatonin (M5250-1G, Sigma-Aldrich, St. Louis, MO, USA) was dissolved in anhydrous ethanol to form a stock solution of 200 mmol/L. The working concentration was 100 μmol/L after dilution in culture medium based on previous studies [30] and our dose-dependent test of melatonin, in which the final ethanol content was less than 0.05% (v/v).
Animal experiments
Seven-week-old male C57BL/6 mice were obtained from Beijing Vital River Laboratory Animal Technology Company (Beijing, China). The mice were randomly allocated to normal diet and high-stearic-acid diet (HSD) groups (n=10 per group). The compositions of the normal diet and HSD were provided by the Beijing HFK Bioscience (Beijing, China) ( Supplemental Table S1). All animal procedures were approved by Institutional Animal Care and Use Committee of Harbin Medical University, and the animals were handled following the guidelines of the Animal Experimental Center of Harbin Medical University. Pancreatic tissues and blood samples were collected after 12-week feeding.
Profile of serum nonesterified fatty acid and lipid measurement
Fasting serum nonesterified fatty acids were transformed into fatty acid methyl esters as described previously [5,31]. Heptadecanoic acid (C17:0) was used as an internal standard. Fasting serum glucose, total cholesterol, triacylglycerol, high-density lipoprotein cholesterol, and low-density lipoprotein cholesterol levels were calculated with an automatic analyzer (Hitachi-7100, Hitachi, Tokyo, Japan). All kits were purchased from Biosino Biotechnology (Beijing, China). Serum insulin concentrations were measured using a mouse/rat insulin enzyme-linked immunosorbent assay kit (Cat. No. EZRMI-13K, Millipore, Burlington, MA, USA).
Cell culture and primary mouse islet isolation
Mouse pancreatic β-TC6 cells were obtained from the Chinese Sciences Cell Library (Shanghai, China) and cultured in Dulbecco’s modified Eagle’s medium (Gibco/Life Technologies, Carlsbad, CA, USA), supplemented with 15% (v/v) fetal bovine serum (Gibco/Life Technologies), 1.5 g/L NaHCO3, and 100 IU/mL penicillin-streptomycin (Gibco/Life Technologies). The β-TC6 cells were treated with 400 μmol/L stearic acid for 24 hours. The mouse islets were provided by Procell Life Science & Technology Co., Ltd. (Wuhan, China) and were isolated after digestion through ductal injection of collagenase P (Cat. No. 11213873001, Roche Molecular Biochemicals, Mannheim, Germany) and purified using Ficoll 400 (Cat. No. 17-0300-10, Pharmacia, Stockholm, Sweden), as described previously [32].
Cell viability measurements
Cell viability was determined using a cell counting kit 8 (CCK-8) assay (C0038, Beyotime Biotechnology, Shanghai, China). The β-TC6 cells were seeded into 96-well plates at a density of 3×10⁴ cells/well. Then, 10 μL of CCK-8 was added to each well. After incubation at 37°C for 2 hours, optical density was evaluated at 450 nm using a microplate reader (SpectraMax M2, Molecular Devices, San Jose, CA, USA).
Glucose-stimulated insulin secretion assay
Secretion buffer was prepared as described previously [3]. β-TC6 cells were incubated in secretion buffer (2.8 or 20 mmol/L) for 60 minutes. The culture medium was then collected for insulin measurements, and the cells were simultaneously lysed for protein concentration measurements to normalize the insulin level. Insulin levels were detected using a mouse/rat insulin enzyme-linked immunosorbent assay kit (Cat. No. EZRMI-13K).
Senescence-associated β-galactosidase staining
Senescence-associated β-galactosidase (β-gal) activity was measured using a senescence β-gal staining kit (C0602, Beyotime Biotechnology), as described previously [33,34]. β-TC6 cells in 24-well plates were washed with phosphate-buffered saline (PBS) three times. Then, 250 μL of fixative solution was added to each well and incubated for 15 minutes at room temperature. After three washes, the cells were incubated with X-Gal staining buffer at 37°C without CO2. We calculated the ratio between the number of positive cells (blue stained) and the total number of cells present in five different fields in each well. The total number of cells in each field was determined by Hoechst 33342 staining (C1022, Beyotime Biotechnology). We independently repeated the experiment three times.
EdU staining
EdU staining was carried out using a BeyoClick EdU-488 cell proliferation kit (C0071S, Beyotime Biotechnology). The β-TC6 cells were seeded onto a 24-well plate at a density of 1×10⁵ cells/well. They were fixed with 4% paraformaldehyde for 10 minutes and washed with PBS buffer 3% BSA, followed by incubation with 0.3% Triton X-100 (P0096, Beyotime Biotechnology) for 15 minutes at room temperature. After washing, EdU reaction buffer was then added and incubated for 30 minutes at room temperature in the absence of light. Finally, Hoechst 33342 was used for cell counting.
Transfection procedures
A RiboFect CP Transfection Kit (C10511-05, RiboBio Co. Ltd., Guangzhou, China) and Lipofectamine 2000 (Cat.11668019, Invitrogen, Carlsbad, CA, USA) were used to transfect cells with oligonucleotides and luciferase reporter vectors, according to the manufacturer’s instructions. Cells were collected for detection 24 hours after transfection. miR-146a-5p mimic, anti-miR-146a oligonucleotide (AMO-146a), miR-8114 mimic, anti-miR-8114 oligonucleotide (AMO-8114), overexpression plasmid pEX-RB-Mam carrying Mafa, and their negative controls were synthesized and constructed by Guangzhou RiboBio Co. Ltd.
Real-time quantitative polymerase chain reaction
The total RNA from β-TC6 cells and mouse islets was extracted using TRIzol reagent (Invitrogen) [35], according to the manufacturer’s protocol. A miRVana miRNA isolation kit (Ambion, Austin, TX, USA) was used to isolate miRNAs. Quantitative polymerase chain reaction (PCR) was performed using SYBR Green PCR Master Mix (Applied Biosystems, Foster City, CA, USA). β-actin and U6 were used as internal controls for mRNA and miRNA, respectively. All primers were synthesized by Sangon Biotech Co. Ltd. (Shanghai, China), and their sequences are shown in Table 1.
Primer Sequences Used for Real-Time Quantitative Polymerase Chain Reaction
Western blotting
Cells were gently washed three times in PBS, and 50 μL of intermediate radio-immunoprecipitation assay (RIPA) lysis buffer (Beyotime) was then added. Protein concentrations were detected using bicinchoninic acid (BCA) protein assay kits (Cat. No. P0010, Beyotime). Protein samples (50 μg) were separated by sodium dodecyl sulfate polyacrylamide gel electrophoresis and transferred to polyvinylidene fluoride membranes. The primary antibodies used were as follows: MAFA (DF13429, rabbit polyclonal, 1:1,500, Affinity Biosciences, Cincinnati, OH, USA) and β-actin (ab8266, rabbit polyclonal, 1:1,000, Cell Signaling Technology, Beverly, MA, USA). The secondary antibody was an anti-rabbit alkaline phosphatase-conjugated antibody (S373B, 1:7,500, Promega, Madison, WI, USA). Protein detection was performed using stabilized substrate for alkaline phosphatase (S3841, Promega) and the FluorChem R system (ProteinSimple, San Jose, CA, USA).
Luciferase activity assay
Luciferase reporter plasmids carrying the 3′-untranslated region (3′-UTR) of Mafa containing wild-type or mutant binding sites for miR-146a-5p or miR-8114 were constructed by RiboBio Co. Ltd. HEK293 cells were co-transfected with 200 ng of vectors and miR-146a-5p or miR-8114 mimics or their negative controls. Cell lysates were collected 24 hours after transfection, and the luciferase activity was measured using a luciferase reporter assay kit (E1910, Promega) and a GloMax 20/20 luminescence detector.
Statistics
All data were statistically analyzed using SPSS version 21.0 (IBM Corp., Armonk, NY, USA) and are presented as mean±standard deviation. The two-tailed Student t test was used to analyze differences between two groups, and one-way analysis of variance followed by the Student-Newman-Keuls test was used to test differences among multiple groups.
RESULTS
Long-term HSD feeding significantly stimulates senescence in mouse islets
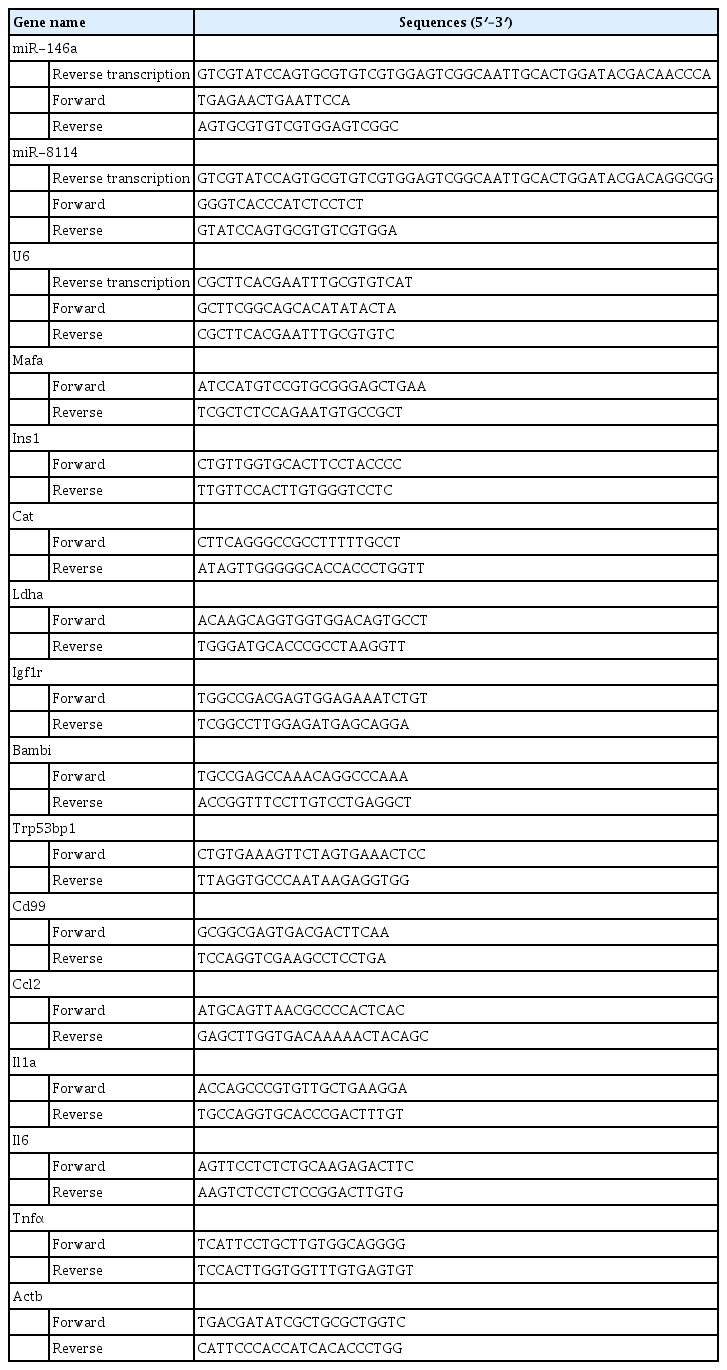
An HSD in the mouse model that mimicked increased proportions of stearic acid was successfully established, as evidenced by a significant elevation of circulating stearic acid levels ( Supplemental Table S2). The metabolic characteristics of these animals are summarized in Supplemental Table S3. After 12-week feeding with the HSD, the expression of markers of aging (Igf1r and Bambi), senescence (Cdkn2a and Trp53bp1), senescence-associated secretory phenotype factors (Ccl, Il1a, Il6, Tnf, and Cd99), and disallowed genes (Cat and Ldha) was significantly upregulated, and the expression of β-cell identity genes (Ins1 and Mafa) was robustly downregulated in mouse islets (Fig. 1).
Long-term high-stearic-acid diet (HSD) feeding induces senescence in mouse islets. Changes in the expressions of senescence-related genes in HSD-fed mice islets (n=5 mice per group). aP<0.05, bP<0.01, compared with the control (Ctrl) group.
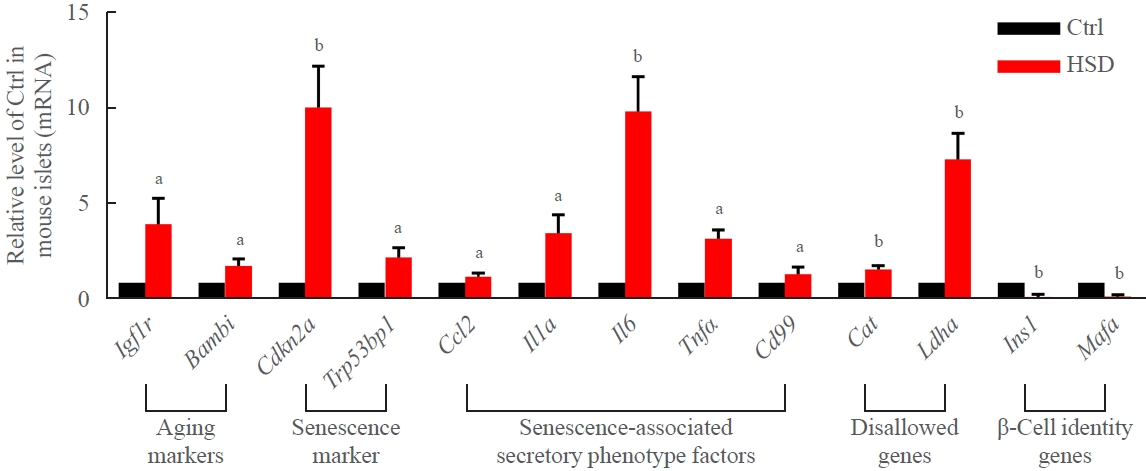
Melatonin ameliorates stearic acid-induced senescence and dysfunction in mouse pancreatic β-TC6 cells
The mouse β-TC6 cell line is derived from insulinoma cells arising in transgenic mice expressing the SV40 T antigen and can maintain stable in terms of differentiation in cell culture. It has remarkably similar characteristics to those of normal islets and maintains normal glucose responsiveness, as described previously [36-38]. We also observed a low level of cell proliferation after EdU staining (Supplemental Fig. S1A) and significant upregulation of p21 expression (Fig. 2, Supplemental Fig. S1B) in stearic acid-treated β-TC6 cells. Therefore, the β-TC6 cell line was selected as an appropriate model for this study.
Melatonin (Mel) protects mouse β-TC6 cells against stearic acid-induced senescence and dysfunction. (A) Cytotoxic effect on β-TC6 cells of treatment with different concentrations of melatonin for 24 hours, measured by cell counting kit 8 (CCK-8) assays. (B) Effect of Mel (0.1 mmol/L) on cell viability at different times. (C, D) Protective effect of Mel on stearic acid-decreased glucose-stimulated insulin secretion assay (GSIS) and cell viability. (E) Changes in mRNA levels of senescence-related genes after incubation with Mel in the presence and absence of stearic acid. Each experiment was independently repeated three times. (F) Effect of Mel on stearic acid-induced β-cell senescence measured by X-Gal staining (scale bar, 100 μm). Glu, glucose. aP<0.01, compared with 0 mmol/L; bP<0.01, compared with 0 hour; cP<0.05, dP<0.01, eP<0.001, compared with the control (Ctrl) group; fP<0.05, gP<0.01, hP<0.001, compared with the stearic acid (SA) group; iP<0.05; jP<0.01.
The incubation of β-TC6 cells with different concentrations (12.5, 25, 50, 100, 200, 400, 800, 1,600, 3,200, 6,400, and 12,800 μmol/L) of melatonin showed that cell survival rate decreased in a dose-dependent manner at concentrations above 400 μmol/L (Fig. 2A). We chose a 100 μmol/L dose of melatonin to treat β-TC6 cells for 6, 12, 24, and 48 hours, and observed a significant reduction in cell viability at the 48-hour time-point (Fig. 2B). To confirm that the ethanol content in the melatonin solution did not affect cell viability, we also treated β-TC6 cells with different concentrations of ethanol in parallel with different concentrations of melatonin. We found no significant effect on cell viability when the ethanol concentration was under 0.4% (v/v), which equates to a melatonin concentration of 800 μmol/L (Supplemental Fig. S2). Next, treatment with 100 μmol/L melatonin for 24 hours significantly ameliorated the stearic acid-induced decrease in β-TC6 cell viability (Fig. 2C) and impairment on the glucose-stimulated insulin secretion assay (GSIS) (Fig. 2D). Moreover, stearic acid significantly increased the expression of markers of aging (Igf1r and Bambi), senescence (Cdkn2a and Trp53bp1), senescence-associated secretory phenotype factors (Ccl, Il1a, Il6, Tnf, and Cd99), and disallowed genes (Cat and Ldha) in β-TC6 cells, and decreased the expression of β-cell identity genes (Ins1 and Mafa). The effects on all these genes were robustly reversed after melatonin treatment (Fig. 2E). Meanwhile, stearic acid-increased senescence-associated β-gal activity in β-cells was also blocked after melatonin exposure (Fig. 2F).
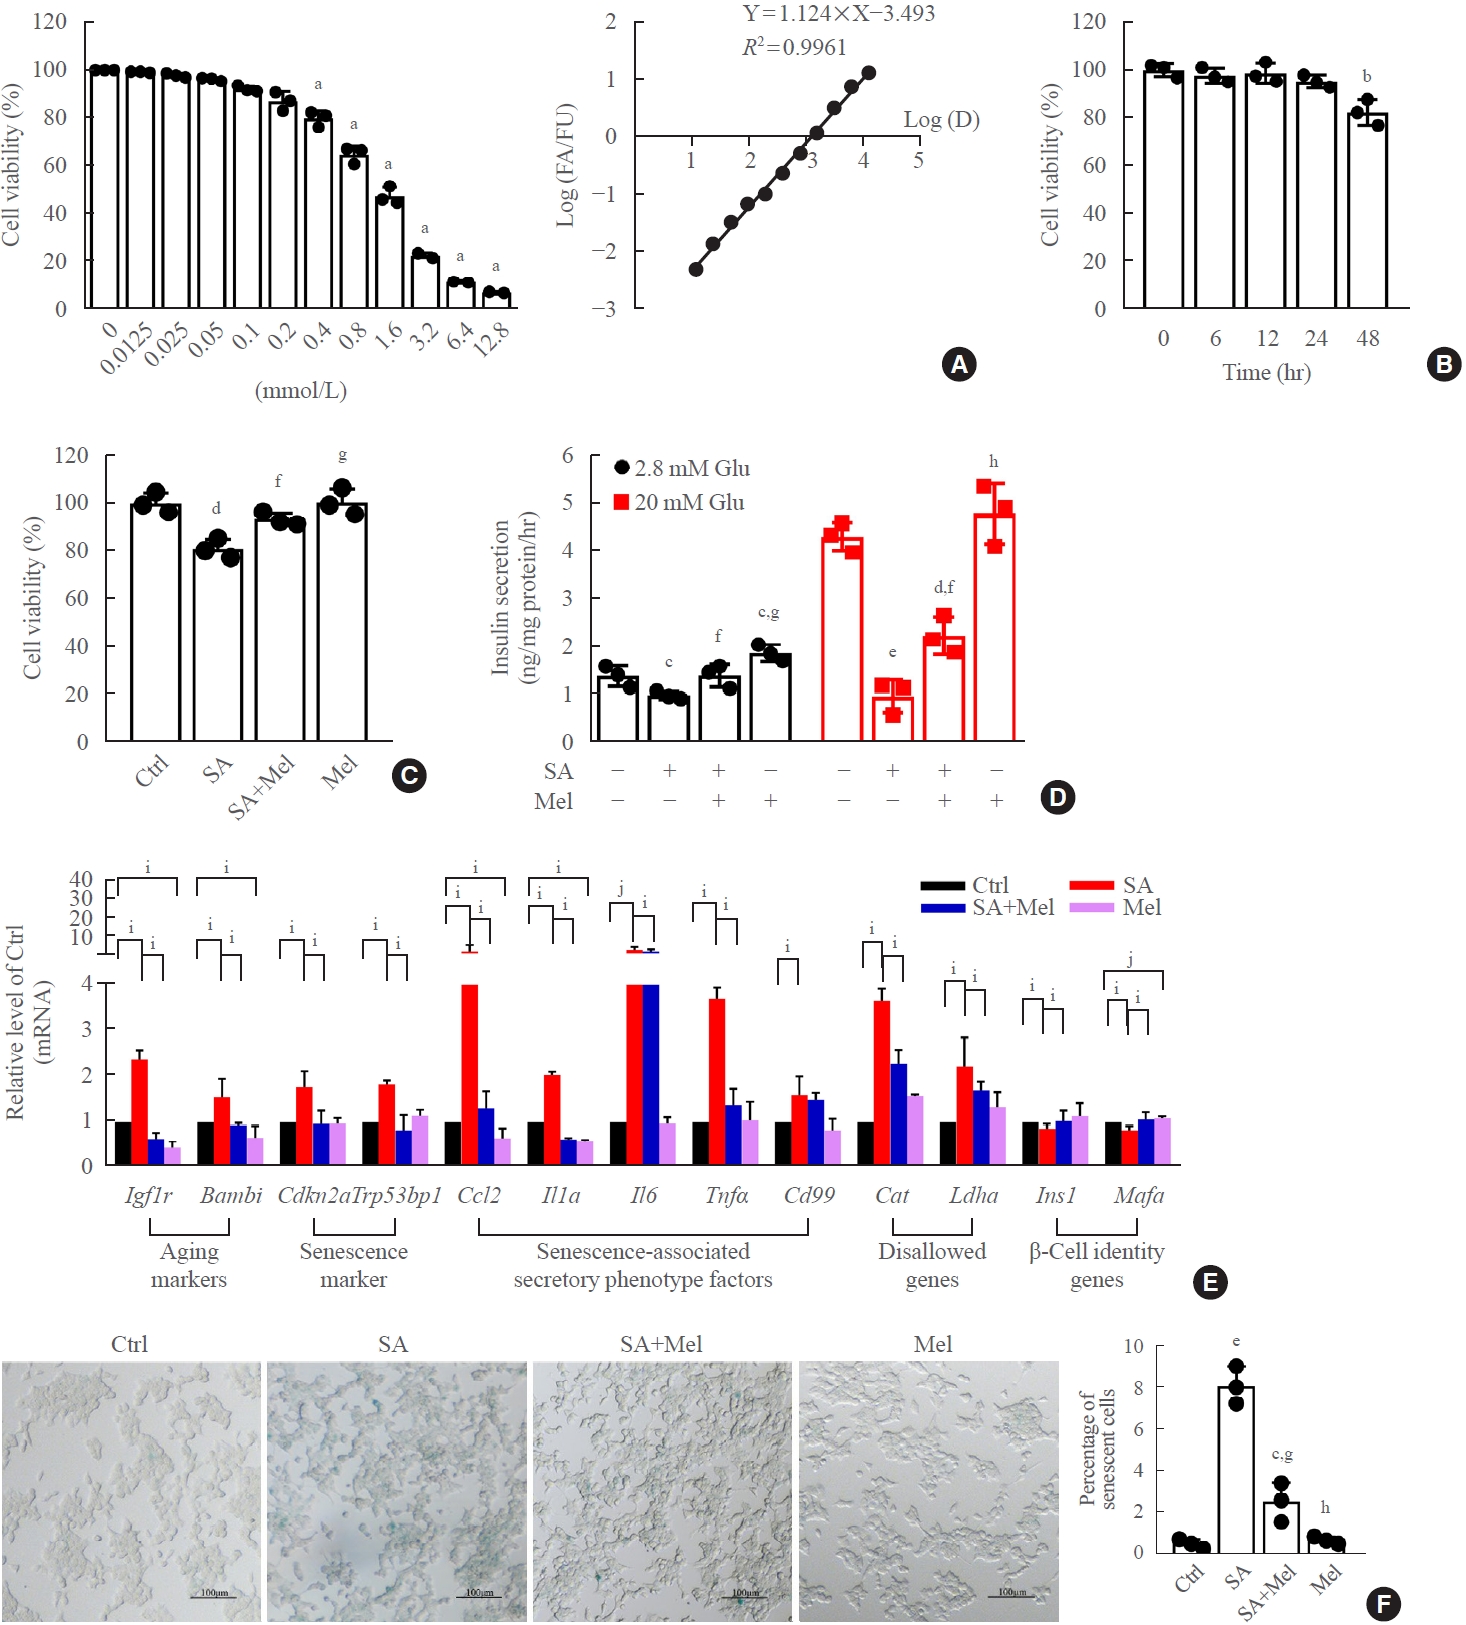
Melatonin significantly reversed stearic acid-increased expression of miR-146a-5p and miR-8114
In our previous study [28], we found that 13 miRNAs were upregulated and three miRNAs were downregulated after chronic exposure to stearic acid in β-TC6 cells using high-throughput sequencing. Among them, the expression of miR-146a-5p and miR-8114 was markedly elevated. Here, we verified this result in both HSD mice islets and stearic acid-treated β-TC6 cells. As shown in Fig. 3A, B, stearic acid significantly increased the expression of miR-146a-5p and miR-8114 in HSD-fed mice islets, compared with the control group. Similar increases in the levels of these two miRNAs were also observed in β-TC6 cells (Fig. 3C, D) and in mouse islets treated with stearic acid (Fig. 3E, F). Interestingly, these increases were effectively reversed by the addition of melatonin in β-TC6 cells (Fig. 3C, D) and in isolated islet cells (Fig. 3E, F).
Melatonin (Mel) significantly reversed the stearic acid (SA)-induced increase in the expression of miR-146a-5p and miR-8114 in β-TC6 cells and mouse islet cells. (A, B) Changes in levels of miR-146a-5p and miR-8114 in mouse islets fed with high-stearic-acid diet (HSD) (n=5 mice per group). (C, D) Expression of miR-146a-5p and miR-8114 in SA-treated β-TC6 cells in the presence or absence of Mel. Each experiment was repeated independently three (C) or four (D) times. (E, F) The miR-146a-5p and miR-8114 level in islet cells exposed to SA followed by Mel treatment. Each experiment was repeated independently five times.aP<0.05, bP<0.001, compared with the control (Ctrl) group; cP<0.05, dP<0.01, compared with the SA group; eP<0.01, compared with the Ctrl group.
miR-146a-5p and miR-8114 are key stimulatory downstream players of stearic acid-induced senescence and dysfunction of β-TC6 cells
Transfection of AMO-146a significantly suppressed endogenous levels of miR-146a-5p in the presence and absence of stearic acid (Fig. 4A). After treatment of β-TC6 cells with AMO-146a-5p, the stearic acid-induced reduction of cell viability and impaired GSIS significantly recovered (Fig. 4B, C). Meanwhile, inhibition of miR-146a-5p alleviated stearic acid-promoted β-cell senescence by suppressing the mRNA levels of senescence-related genes (Fig. 4D) and stearic acid-promoted β-gal activity (Fig. 4E). In contrast, overexpression of miR-146a-5p significantly impaired GSIS (Supplemental Fig. S3A) in β-TC6 cells in the absence of stearic acid, and this impairment was largely rescued by AMO-146a. Moreover, transfection of miR-146a-5p mimics resulted in the dysregulation of senescence-related gene expression (Supplemental Fig. S3B) and β-gal activity (Supplemental Fig. S3C). However, transfection of miR146a-5p alone did not affect cell viability (Supplemental Fig. S3D). The transfection efficiency of the miR-146a mimic is shown in Supplemental Fig. S3E. In parallel with miR-146a-5p, similar results were observed with transfection of miR-8114 AMO or its mimic with or without stearic acid treatment (Fig. 5, Supplemental Fig. S4), indicating that miR-8114 also participates in stearic acid-induced β-TC6 cell senescence and dysfunction. In addition, knockdown of miR-146a-5p and miR-8114 also blocked stearic acid-induced dysregulation of senescence-related gene expression in mouse islet β-cells (Supplemental Fig. S5).

Inhibition of miR-146a-5p alleviated stearic acid-induced cell senescence and glucose-stimulated insulin secretion assay (GSIS) in β-TC6 cells. (A) Change in miR-146a-5p expression after transfection of stearic acid-treated β-TC6 cells with anti-miRNA oligonucleotides (AMO)-146a-5p. (B, C) Effect of AMO-146a-5p on cell viability and GSIS in the presence and absence of stearic acid, respectively. (D) Alterations in senescence-related gene expression in stearic acid-treated β-TC6 cells transfected with AMO-146a-5p. (E) Inhibition of miR- 146a-5p reversed stearic acid-reduced β-gal activity. Each experiment was repeated independently three times (scale bar, 100 μm). Glu, glucose. aP<0.05, bP<0.01, compared with control (Ctrl)+AMO-negative control (NC) group; cP<0.05, dP<0.01, eP<0.001, compared with the stearic acid (SA)+AMO-NC group; fP<0.05; gP<0.01.
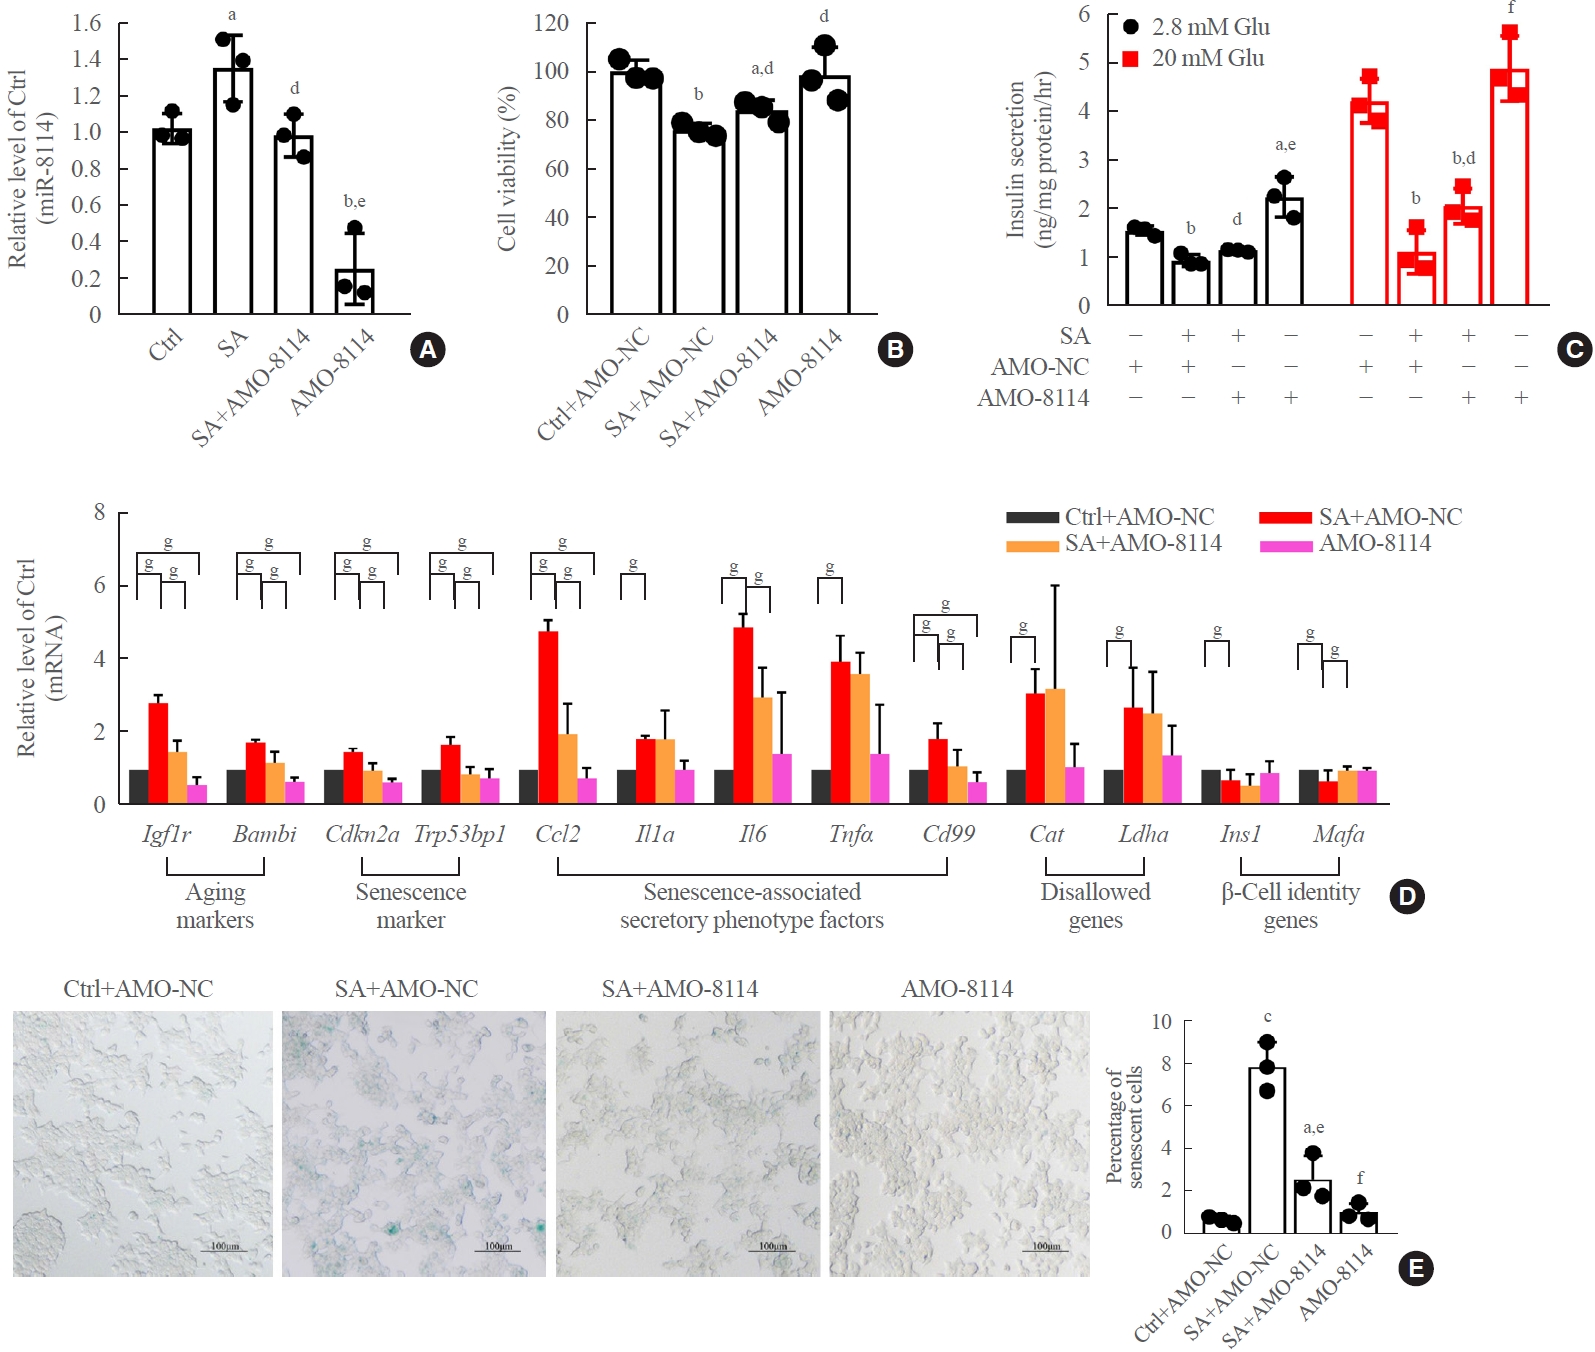
Silencing miR-8114 improved stearic acid (SA)-induced cell senescence and glucose-stimulated insulin secretion assay (GSIS) in β-TC6 cells. (A) Change in miR-8114 level after knockdown of miR-8114 in the presence and absence of SA. (B, C) Silencing miR-8114 improved SA-impaired cell viability and GSIS, respectively. (D) Effect of anti-miRNA oligonucleotides (AMO)-8114 on senescence-related gene expression in SA-treated β-TC6 cells. Each experiment was repeated independently three times. (E) Transfection of SA-treated β-TC6 cells with AMO-8114 reversed the decrease in β-gal activity (scale bar, 100 μm). aP<0.05, bP<0.01, cP<0.001, compared with control (Ctrl)+AMO-negative control (NC) group; dP<0.05, eP<0.01, fP<0.001, compared with SA+AMO-NC group; gP<0.05.
Mafa is a downstream target gene of miR-146a-5p and miR-8114
Stearic acid significantly decreased Mafa expression, and melatonin reversed this inhibition in both β-TC6 cells (Fig. 6A) and islet β-cells (Supplemental Fig. S6A). The predicted Mafa binding sites of miR-146a and miR-8114 are shown in Fig. 6B, C, respectively. Mafa mRNA and protein levels were significantly decreased after the incubation of β-TC6 cells with stearic acid. This was significantly reversed by knockdown of miR-146a-5p or miR-8114 (Fig. 6D-G). Similar changes in Mafa protein expression were also observed in stearic acid-treated islet cells after inhibition of miR-146-5p and miR-8114 with AMO-146a-5p and AMO-8114 (Supplemental Fig. S6B, C). In the absence of stearic acid, transfection of miR-146a-5p or miR-8114 mimics led to downregulation of Mafa expression (Fig. 6H-K). In addition, the luciferase activity of the vector encoding the wild-type 3’-UTR of Mafa was significantly suppressed after co-transfection with miR-146a or miR-8114 mimics; however, this suppression was not observed in the luciferase reporter vectors carrying mutant binding sites for miR-146a or miR-8114 (Fig. 6L).
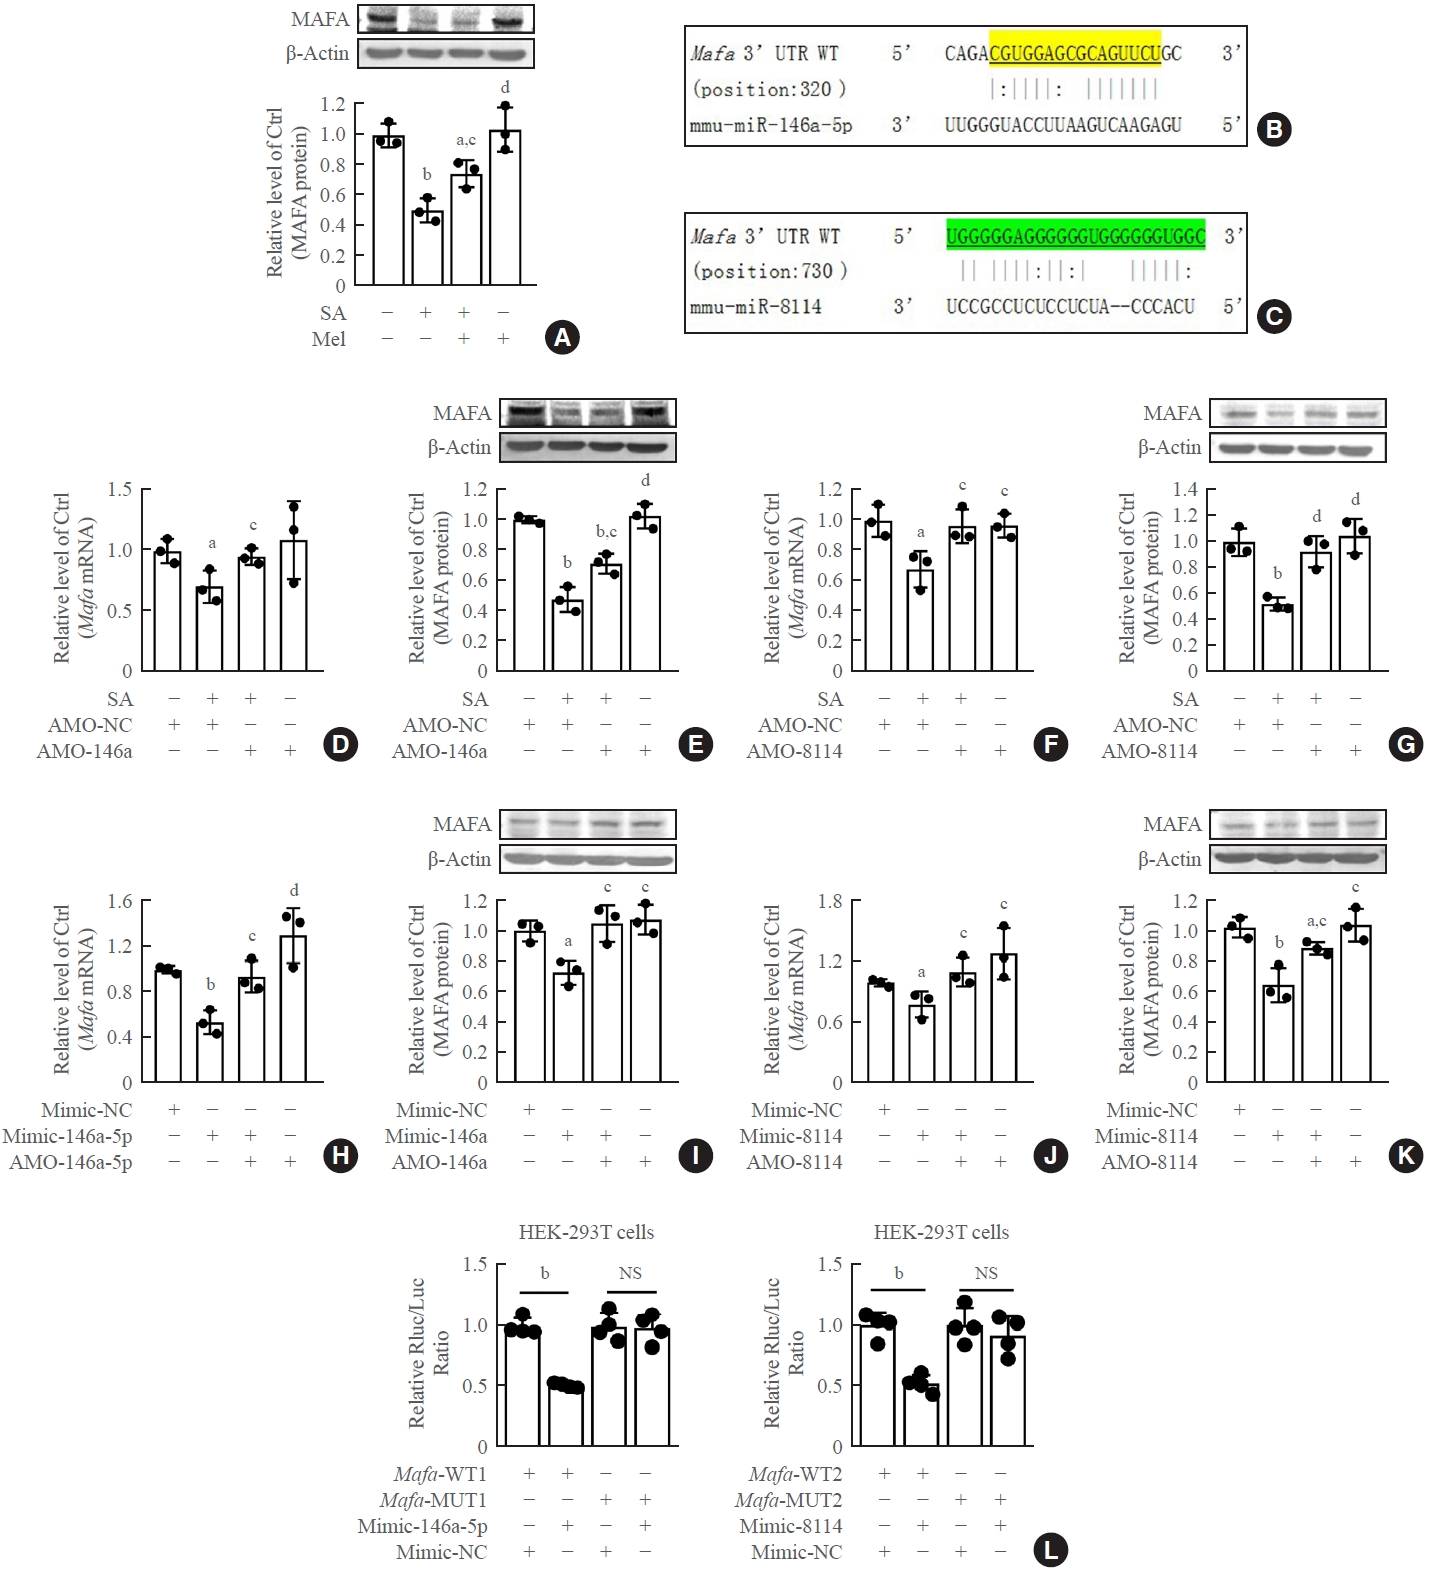
V-maf musculoaponeurotic fibrosarcoma oncogene homolog A (Mafa) is a direct target of miR-146a-5p and miR-8114. (A) Effect of melatonin on Mafa protein levels in stearic acid (SA)-treated β-TC6 cells. (B, C) Predicted binding sites between miR-146a/miR-8114 and Mafa, respectively. (D, E) Changes in levels of Mafa mRNA and Mafa protein after transfection of anti-miRNA oligonucleotides (AMO)- 146a-5p in SA-treated β-TC6 cells, respectively. (F, G) Mafa mRNA and Mafa protein levels after inhibition of miR-8114 in the presence of SA, respectively. (H, I) Overexpression of miR-146a-5p decreased Mafa mRNA and Mafa protein levels in the absence of SA, respectively. (J, K) Transfection of miR-8114 mimic alone inhibited the expression of Mafa mRNA and Mafa protein, respectively. (L) Luciferase activity between Mafa and miR-146a-5p or miR-8114, respectively. Each experiment was repeated independently three (A-K) or four (L) times. UTR, untranslated region; WT, wild-type; MUT, mutant; NS, no significance. aP<0.05, bP<0.01, compared with control (Ctrl)/Ctrl+AMO-negative control (NC)/mimic-NC group; cP<0.05, dP<0.01, compared with SA/SA+AMO-NC/miR-146a-5p mimic (mimic-146a-5p)/8114 group.
Melatonin rescued miR-146a-5p and miR-8114 overexpression-induced β-TC6 cell senescence and dysfunction
Melatonin blocked the upregulation of miR-146a-5p and miR-8114 levels after transfection of their mimics alone (Figs. 7A, 8A). Melatonin also obviously alleviated miR-146a-5p-induced GSIS impairment (Fig. 7B) and β-cell senescence (Fig. 7C, D). Meanwhile, the decreases in Mafa mRNA and Mafa protein levels induced by the miR-146a-5p mimic were significantly reversed after melatonin treatment (Fig. 7E, F). Melatonin also significantly inhibited miR-8114-induced GSIS impairment (Fig. 8B), β-cell senescence (Fig. 8C, D) and downregulation of Mafa mRNA (Fig. 8E) and Mafa protein levels (Fig. 8F).
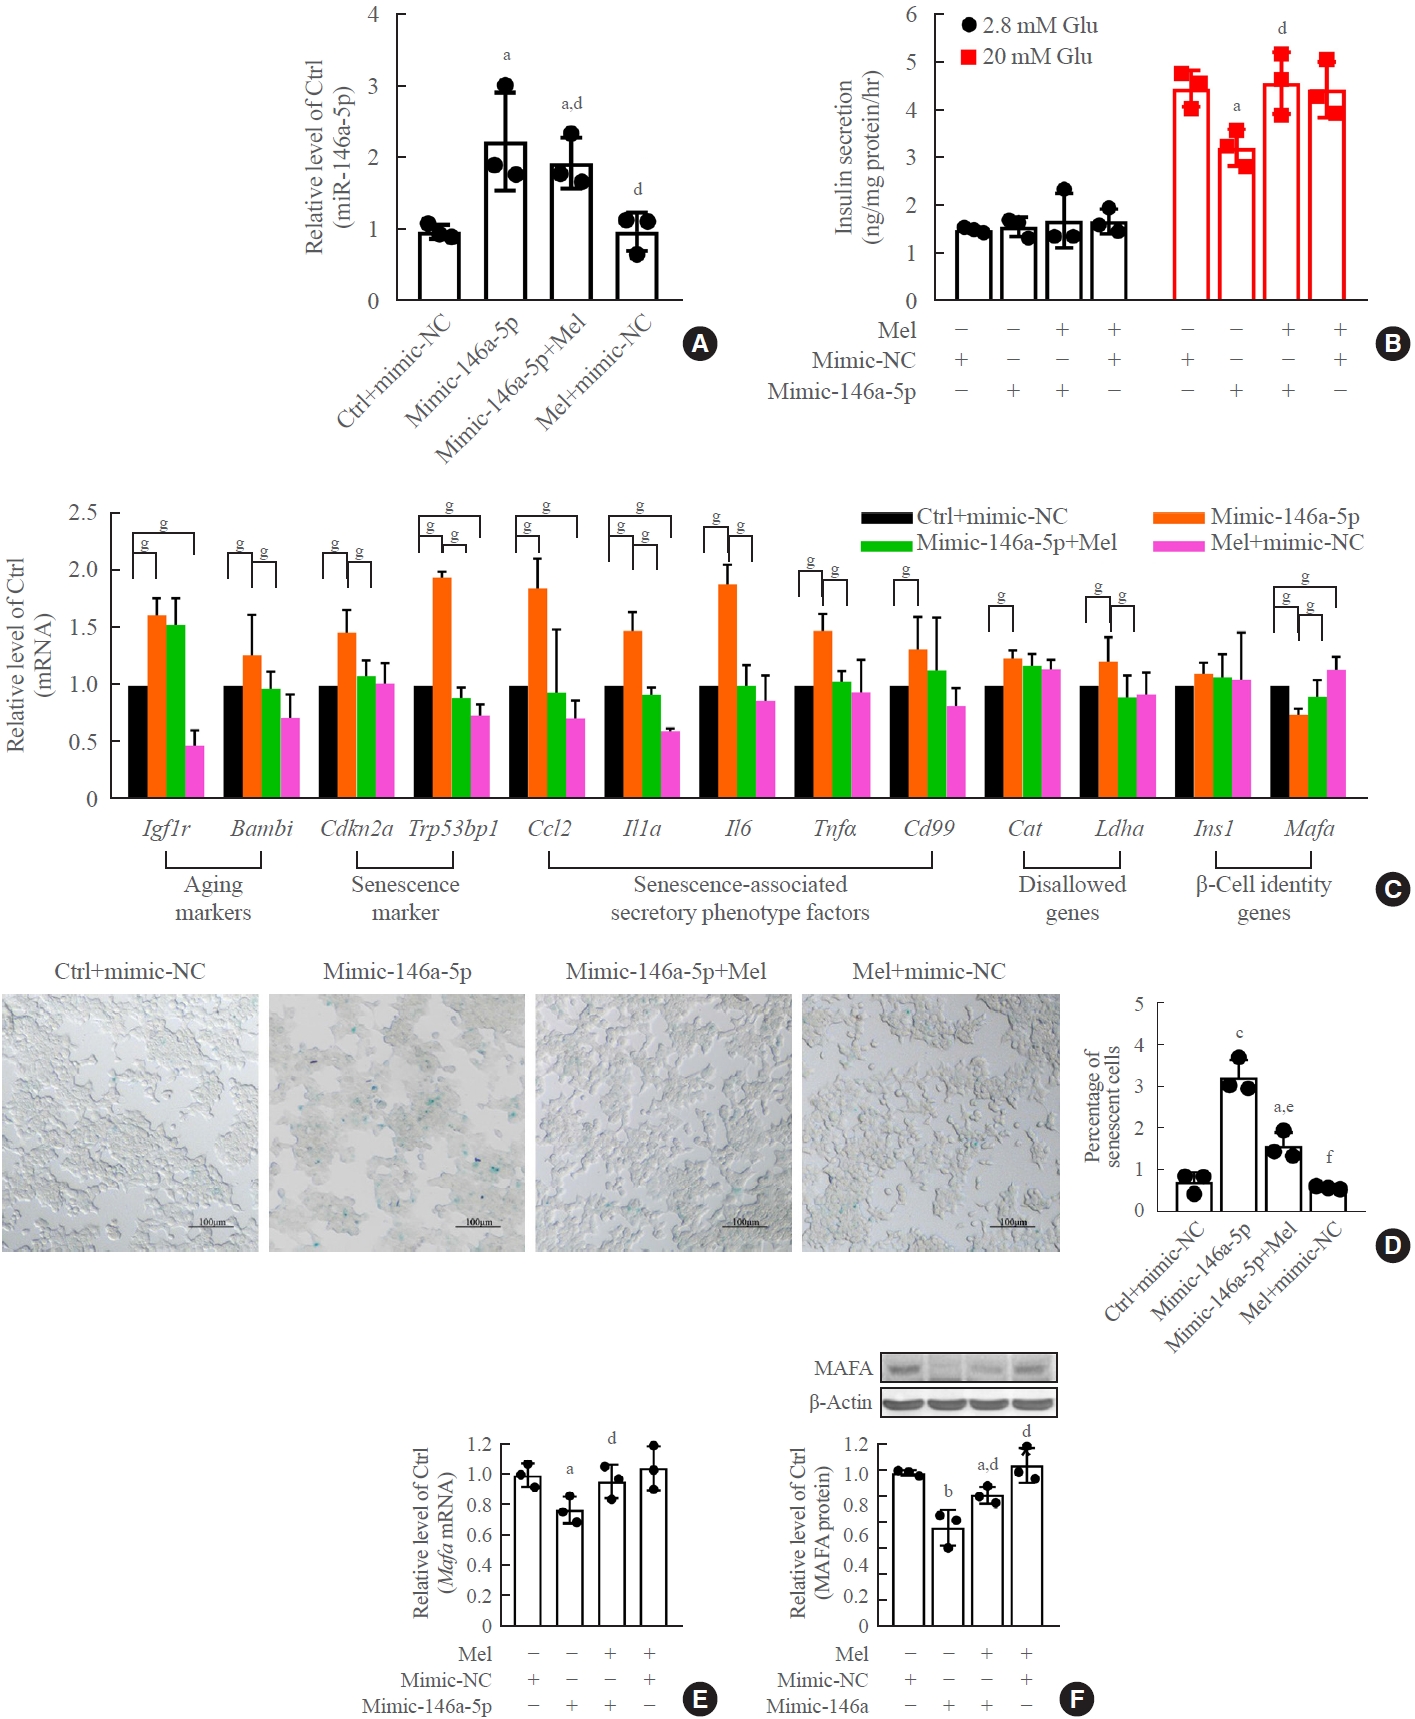
Melatonin (Mel) rescued miR-146a-5p mimic-induced senescence and dysfunction in β-TC6 cells. (A) Change in miR-146a-5p expression after exposure to Mel with a miR-146a-5p mimic. (B, C, D, E, F) Effect of Mel on cell viability, glucose-stimulated insulin secretion assay (GSIS), senescence gene expression, and V-maf musculoaponeurotic fibrosarcoma oncogene homolog A (Mafa) protein levels after overexpression of miR-146a-5p (D: scale bar, 100 μm). Each experiment was repeated independently three times. Glu, glucose. aP<0.05, bP<0.01, cP<0.001, compared with the control (Ctrl)+mimic-negative control (NC) group; dP<0.05, eP<0.01, fP<0.001, compared with the miR-146a-5p mimic (mimic-146a-5p) group; gP<0.05.
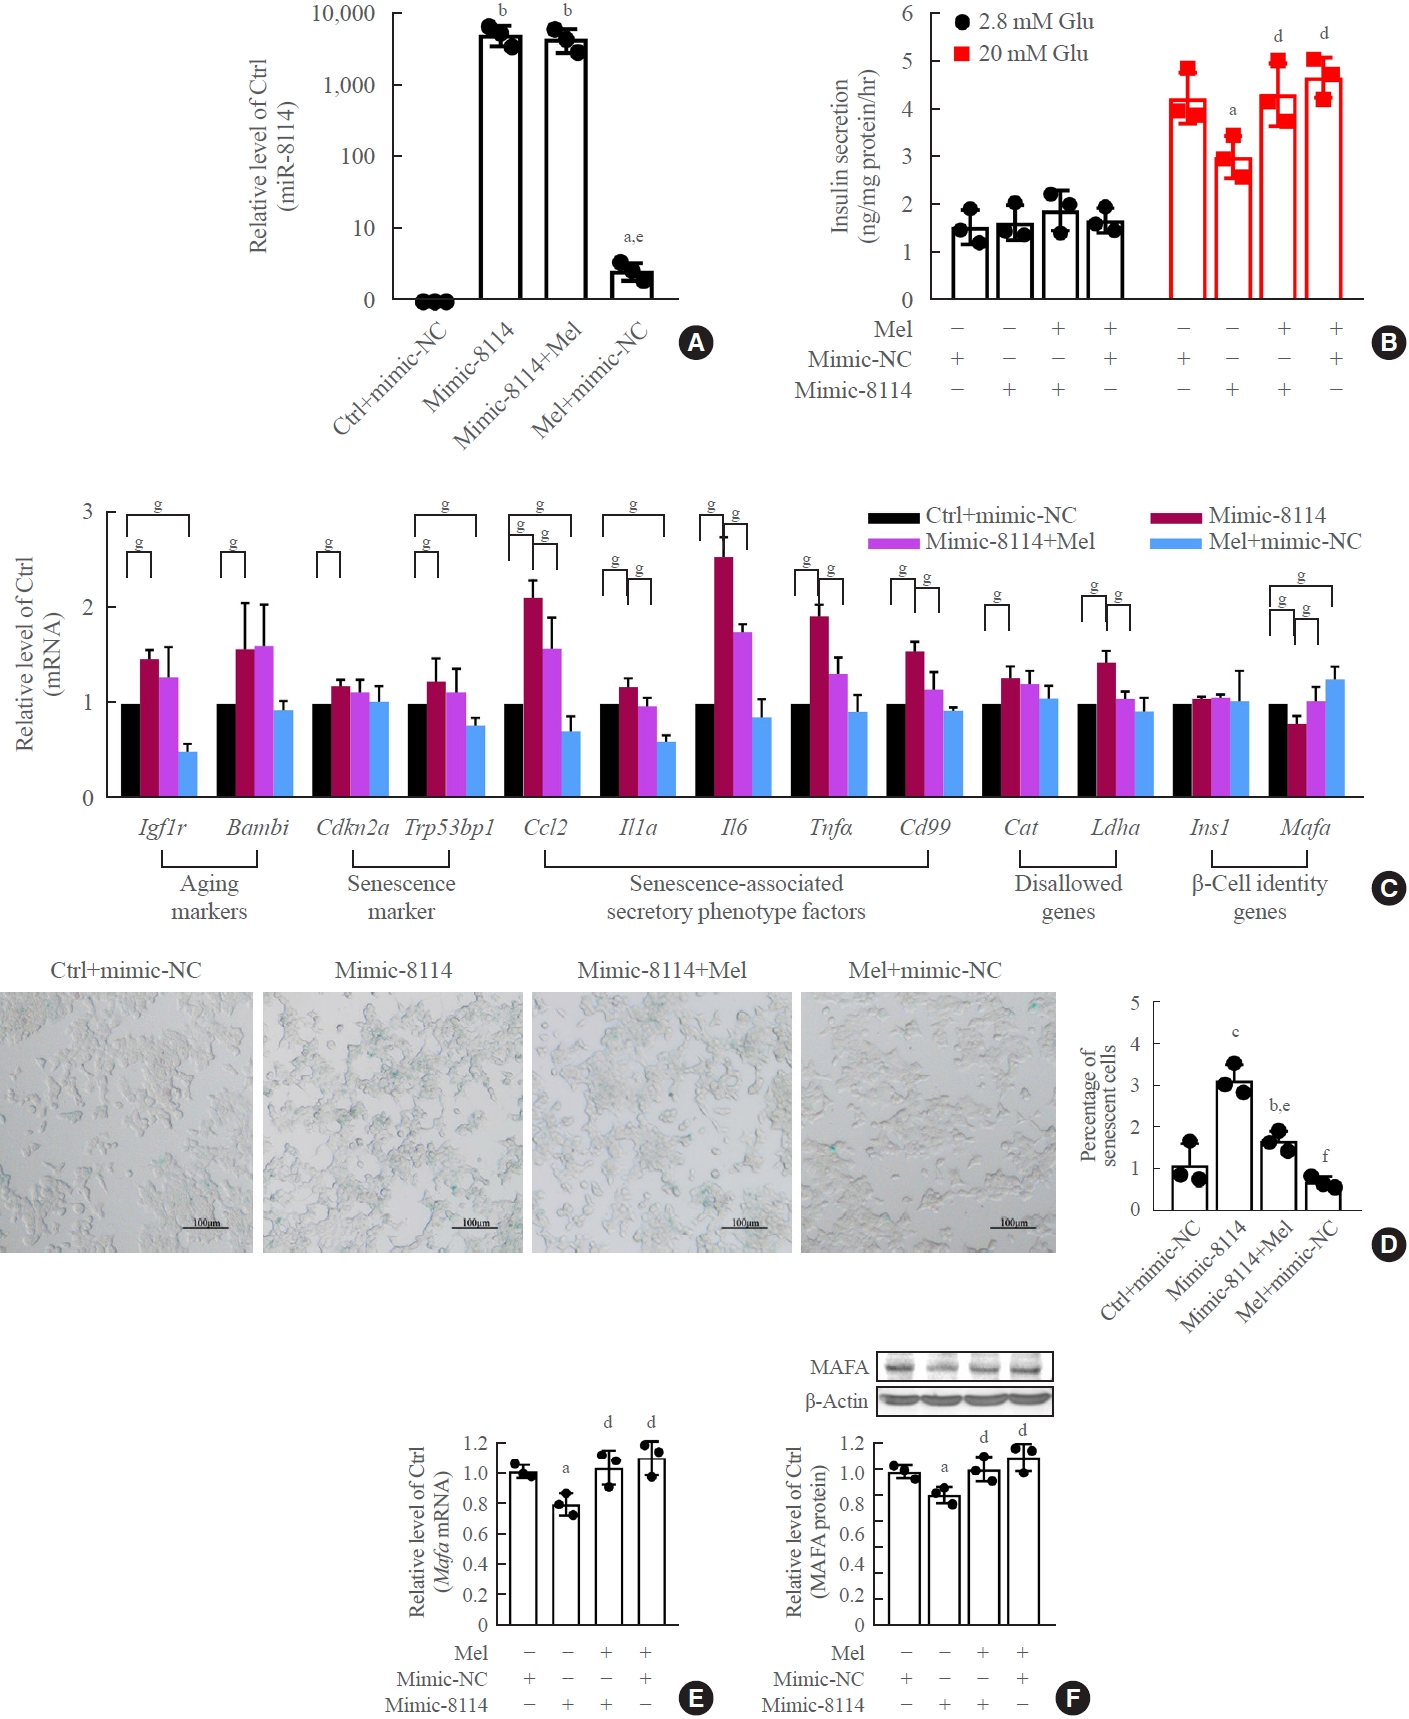
Melatonin (Mel) blocked miR-8114 overexpression-induced β-cell senescence and dysfunction in β-TC6 cells. (A) Change in miR- 8114 expression after incubation with Mel after miR-8114 mimic transfection. (B, C, D, E, F) Effects of Mel on cell viability, glucose-stimulated insulin secretion assay (GSIS), senescence gene expression and V-maf musculoaponeurotic fibrosarcoma oncogene homolog A (Mafa) protein levels after overexpression of miR-8114 (D: scale bar, 100 μm). Each experiment was repeated independently three times. aP<0.05, bP<0.01, cP<0.001, compared with the control (Ctrl)+mimic-negative control (NC) group; dP<0.05, eP<0.01, fP<0.001, compared with the miR-8114 mimic (mimic-8114) group; gP<0.05.
DISCUSSION
Sustained elevation of circulating stearic acid levels induces β-cell dysfunction, which accelerates the progression of T2D. The contribution of β-cell senescence to this phenomenon is still incompletely understood, and no appropriate therapies exist. Our work demonstrates that miR-146a-5p and miR-8114 play a critical role in stearic acid-induced β-cell senescence, and that melatonin can alleviate this process by reducing the upregulation of these two miRNAs and restoring Mafa expression.
Although the importance of miRNAs in regulating β-cell function has been realized for some time [39], there is scant evidence demonstrating the relationship between miRNAs and β-cell senescence. Here, we observed that stearic acid robustly induced senescence in β-TC6 cells. Through high-throughput miRNA sequencing, we previously found that levels of miR-146a-5p and miR-8114 were significantly increased in stearic acid-treated β-TC6 cells. miR-146a-5p is involved in inflammation and senescence [40,41]; however, the actions of miR-146a in various cells and tissues are a matter of debate [42,43]. In β-cells, the level of miR-146a increases in response to palmitate [44] or pro-inflammatory cytokines [45]. However, the role of miR-146a in β-cell senescence remains unknown. In our study, we found that overexpression of miR-146a-5p induced β-cell senescence, and silencing miR-146a-5p effectively reversed stearic acid-evoked β-cell senescence, indicating that miR-146a-5p may act as a critical player in stearic acid-induced β-cell senescence and dysfunction. Similar results were observed for miR-8114. This is the first report of miR-8114 involvement in β-cell function and of its role in stearic acid-induced senescence.
Increasing evidence indicates that β-cell identity is closely related to senescence. The accumulation of senescent β-cells reduces β-cell identity and impairs their function [15]. In contrast, the loss of β-cell identity can also accelerate the appearance of senescence [46]. Nevertheless, the causal relationship between β-cell identity and senescence is still poorly understood. Mafa, a hallmark β-cell identity gene, is crucial for β-cell function [47]. In this study, we found that Mafa expression was significantly reduced upon stearic acid treatment of β-cells. When this downregulation was blocked by the inhibition of miR-146a-5p or miR-8114, β-cell function recovered remarkably and the increase in stearic acid-induced senescence markers was significantly reversed, indicating that improving β-cell identity effectively alleviated stearic acid-induced β-cell senescence and impaired function. Based on luciferase reporter assays and the changes in Mafa expression observed after knockdown and overexpression of miR-146a-5p or miR-8114, we propose that Mafa is a direct downstream target of both miR-146a-5p and miR-8114. Taken together, our data indicate that inhibition of miR-146a-5p and miR-8114 significantly ameliorates stearic acid-induced loss of β-cell identity by restoring Mafa expression and by preventing β-cell senescence and dysfunction. However, to what extent Mafa contributes to the protective effect of melatonin on stearic acid-induced loss of β-cell identity remains to be clarified in future studies.
Evidence indicates that decreasing the load of senescent cells may be a beneficial strategy for improving β-cell function to help prevent the development of T2D [48]. The discovery of the anti-senescence effect of melatonin opens up new avenues for identifying novel agents to prevent β-cell dysfunction. Melatonin administration can markedly protect β-cells against glucotoxicity and glucolipotoxicity through anti-oxidative, anti-apoptotic, and anti-senescence processes [24,26]. However, the mechanisms by which melatonin prevents β-cell dysfunction under lipotoxic conditions still need to be fully elucidated. In the present study, we found that melatonin significantly protected β-cells against loss of identity and senescence induced by stearic acid by suppressing stearic acid-increased expression of miR-146a-5p and miR-8114 and subsequent upregulation of Mafa. These results indicate that melatonin can be used for maintaining β-cell identity in stearic acid-promoted β-cell senescence, probably by targeting miR-146a-5p and miR-8114. Although our results show that a close relationship exists between melatonin and these two miRNAs, whether miR-146a-5p and miR-8114 are direct or indirect downstream targets of melatonin is still not clear.
We would like to point out several limitations of this study. First, although we provide evidence that miR-146a-5p and miR-8114 are involved in stearic acid-induced senescence of mouse insulin-secreting cells in vitro, further exploration is needed to determine whether this conclusion holds true in vivo, including in humans. A predicted binding site for miR-146a-5p is also present in the human MAFA 3′-UTR (Supplemental Fig. S7). However, further experiments will be required to verify these predictions in human β-cells. The human MAFA 3′-UTR also contains a binding site for mouse miR-8114. However, this miRNA is not conserved in humans. Thus, it is possible that in humans, the regulatory role of miR-8114 is exerted by another miRNA. Second, although senescence and apoptosis are identified as potential molecular mechanisms underlying stearic acid-induced β-cell dysfunction, the precise contribution of senescence and apoptosis in this process has not been elucidated. Furthermore, the potential side effects of melatonin need to be evaluated in future studies.
In summary, our study demonstrated that miR-146a-5p and miR-8114 are significantly upregulated in stearic acid-treated β-TC6 cells, leading to loss of β-cell identity and senescence through the inhibition of Mafa expression. Melatonin could effectively reverse these effects (Fig. 9). These findings indicate new potential targets and therapeutic strategies for preventing stearic acid-induced β-cell senescence and dysfunction in high-fat diet-promoted T2D.
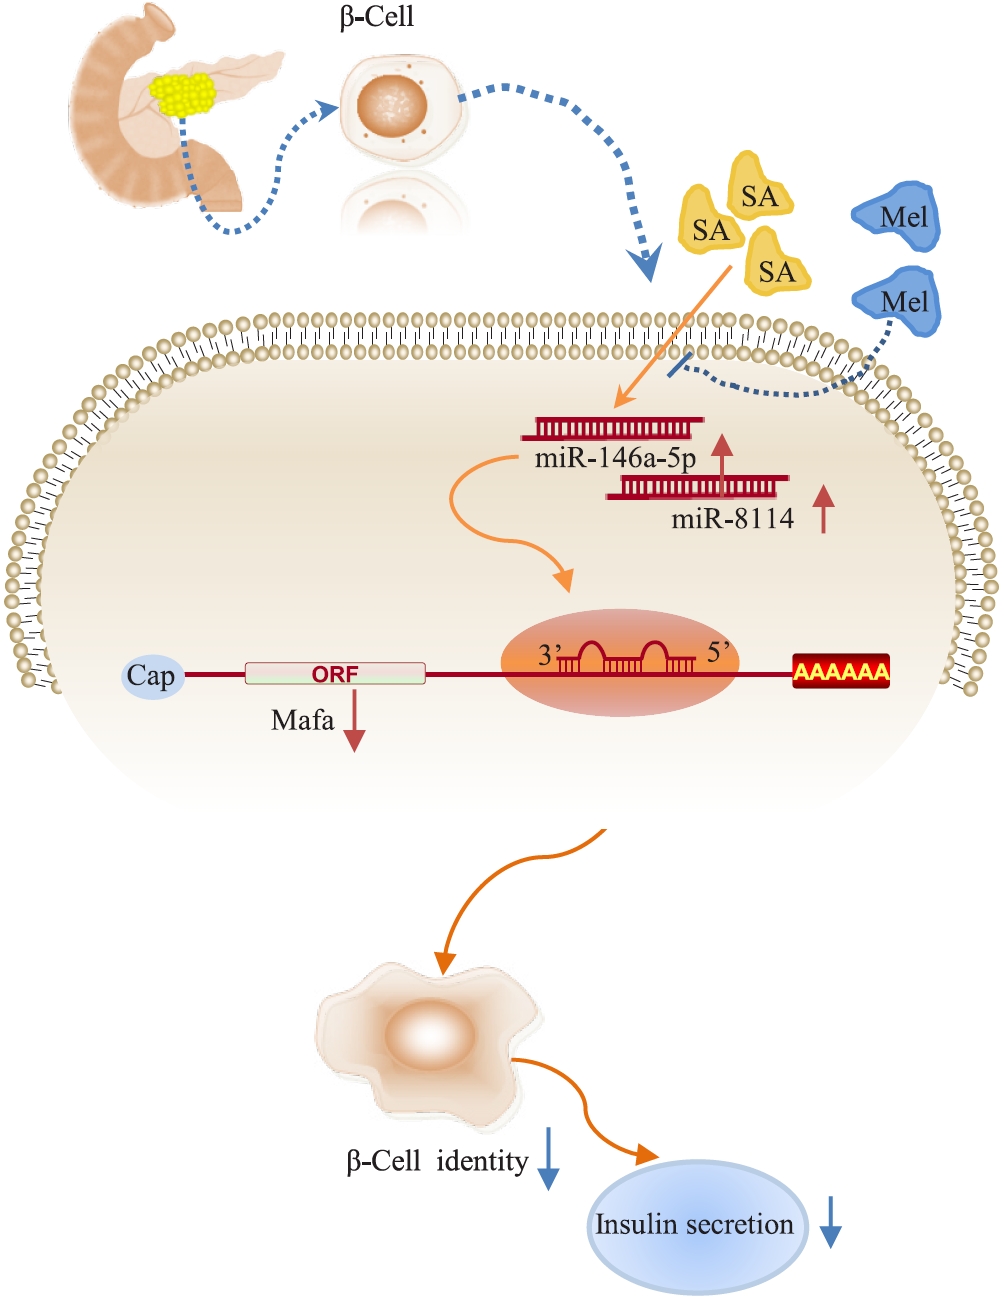
Schematic diagram of the molecular mechanisms underlying the protective effect of melatonin (Mel) on stearic acid (SA)-induced β-cell senescence through miR-146a-5p and miR-8114. ORF, Open Reading Frame; Mafa, V-maf musculoaponeurotic fibrosarcoma oncogene homolog A.
Supplementary Material
Supplemental Table S1.
The Composition of the Diet for Mice
Supplemental Table S2.
Profile of Fasting Serum Non-Essential Fatty Acids in Mice Fed with 12-Week Normal Diet and HSD
Supplemental Table S3.
Body Weight and Serum Analysis in Normal and HSD Mice at 12 weeks
Supplemental Fig. S1.
(A) Change in the ratio of EdU-positive β-TC6 cells after stearic acid (SA) treatment in (scale bar, 100 μm). (B) Expression of p21 in SA-treated β-TC6 cells. Three independent experiments were carried out. aP<0.05, compared with control (Ctrl) group.
Supplemental Fig. S2.
(A)Cytotoxic effect of ethanol on β-TC6 cell viability in different concentrations for 24-hour incubation by cell counting kit 8 (CCK8) assays. aP<0.05, bP<0.01, compared with 0 mmol/L group. FA, fraction affected by the dose; FU, fraction not affected by the dose.
Supplemental Fig. S3.
Overexpression of miR-146a-5p induced glucose-stimulated insulin secretion assay (GSIS) impairment and senescence in β-TC6 cells. (A) Overexpression of miR-146a-5p impaired GSIS in the absence of stearic acid, respectively. (B, C) The effect of miR-146a-5p mimic (mimic-146a-5p) on senescence genes expression and β-Gal activity in β-TC6 cells, respectively (C: scale bar, 100 μm). (D) The change in cell viability after transfection of mimic. (E) The transfection efficiency of mimic-146a-5p in β-TC6 cells. Each experiment was repeated independently three times. AMO, anti-miRNA oligonucleotides. aP<0.05, bP<0.01, compared with control (Ctrl)+mimic-negative control (NC) group; cP<0.05, dP<0.01, compared with mimic-146a-5p group; eP<0.05.
Supplemental Fig. S4.
Overexpression of miR-8114 resulted in impaired glucose-stimulated insulin secretion assay (GSIS) and senescence in β-TC6 cells. (A) Transfection of miR-8114 mimic (mimic-8114) alone induced impairment of GSIS. (B, C, D) Effect of mimic-8114 on senescence genes expression, β-Gal activity and cell viability in β-TC6 cells, respectively (C: scale bar, 100 μm). (E) The transfection efficiency of mimic-8114 in β-TC6 cells. Each experiment was repeated independently three times. NC, negative control; AMO, anti-miRNA oligonucleotides. aP<0.05, bP<0.01, cP<0.001, compared with control (Ctrl) group; dP<0.05, eP<0.01, compared with mimic-8114 group; fP<0.05.
Supplemental Fig. S5.
(A, B) Change in the expression of senescence-related genes after silencing of miR-146a-5p and miR-8114 in stearic acid (SA)-treated mouse islets. Each experiment was repeated independently three times. Ctrl, control; AMO, anti-miRNA oligonucleotides; NC, negative control. aP<0.05; bP<0.01.
Supplemental Fig. S6.
V-maf musculoaponeurotic fibrosarcoma oncogene homolog A (MAFA) protein levels in mouse islets. (A) Melatonin (Mel) rescued stearic acid (SA)-induced downregulation of MAFA protein levels. (B, C) Protective effect of miR-146a-5p and miR- 8114 inhibitors on MAFA protein levels. Each experiment was repeated independently three times. NC, negative control; AMO, anti-miRNA oligonucleotides. aP<0.05, bP<0.01, cP<0.001, compared with control (Ctrl) group; dP<0.05, eP<0.01, compared with SA group.
Supplemental Fig. S7.
Predicted binding sites of (A) hsa-miR-146a-5p and (B) mmu-miR-8114 present in human MAF BZIP transcription factor A (MAFA) 3′-untranslated region (3′-UTR).
Notes
CONFLICTS OF INTEREST
No potential conflict of interest relevant to this article was reported.
AUTHOR CONTRIBUTIONS
Conception or design: H.L. Acquisition, analysis, or interpretation of data: S.S., Q.Z., L.D., Y.L., X.L., Y.Z. C.Y., Y.D., X.L. Drafting the work or revising: S.S., R.R., C.S., X.C., H.L. Final approval of the manuscript: S.S., R.R., C.S., X.C., H.L.
Acknowledgements
This work was supported by the Excellent Youth Foundation of Heilongjiang Province of China (YQ2020H033 to Huimin Lu), National Natural Science Foundation of China (No. 82273614 to Huimin Lu), and Postgraduate Research & Practice Innovation Program of Harbin Medical University (YJSCX2020- 68HYD to Yunjin Zhang) as well as China Scholarship Council (to Huimin Lu). The authors also thank Jeremy Allen, PhD, from Liwen Bianji (Edanz) (www.liwenbianji.cn) for editing a draft of this manuscript.