
Articles
- Page Path
- HOME > Endocrinol Metab > Volume 38(1); 2023 > Article
-
Original ArticleDiabetes, obesity and metabolism Predicting the Risk of Insulin-Requiring Gestational Diabetes before Pregnancy: A Model Generated from a Nationwide Population-Based Cohort Study in Korea
 Keypoint
Gestational diabetes mellitus (GDM) is a growing concern, with a higher incidence among Asians than among other populations. Risk prediction models have been developed, but no gold standard method exists, and prediction rates vary based on the screening tools used. This study aimed to establish a risk assessment model using pre-pregnancy parameters to identify women at risk of severe GDM earlier. The model suggested by the authors includes six basic factors to predict patients with insulin-requiring GDM before pregnancy, improving preconception and prenatal care and reducing adverse maternal and fetal outcomes. -
Seung-Hwan Lee1,2*
 , Jin Yu1*, Kyungdo Han3, Seung Woo Lee4, Sang Youn You5, Hun-Sung Kim1,2, Jae-Hyoung Cho1,2, Kun-Ho Yoon1,2, Mee Kyoung Kim6
 -
Endocrinology and Metabolism 2023;38(1):129-138.
DOI: https://doi.org/10.3803/EnM.2022.1609
Published online: January 27, 2023
1Division of Endocrinology and Metabolism, Department of Internal Medicine, Seoul St. Mary’s Hospital, College of Medicine, The Catholic University of Korea, Seoul, Korea
2Department of Medical Informatics, College of Medicine, The Catholic University of Korea, Seoul, Korea
3Department of Statistics and Actuarial Science, Soongsil University, Seoul, Korea
4Department of Medical Statistics, College of Medicine, The Catholic University of Korea, Seoul, Korea
5College of Medicine, The Catholic University of Korea, Seoul, Korea
6Division of Endocrinology and Metabolism, Department of Internal Medicine, Yeouido St. Mary’s Hospital, College of Medicine, The Catholic University of Korea, Seoul, Korea
- Corresponding author: Mee Kyoung Kim. Division of Endocrinology and Metabolism, Department of Internal Medicine, Yeouido St. Mary’s Hospital, College of Medicine, The Catholic University of Korea, 10 63-ro, Yeongdeungpo-gu, Seoul 07345, Korea Tel: +82-2-3779-1368, Fax: +82-2-595-2534, E-mail: makung@catholic.ac.kr
- *These authors contributed equally to this work.
Copyright © 2023 Korean Endocrine Society
This is an Open Access article distributed under the terms of the Creative Commons Attribution Non-Commercial License (http://creativecommons.org/licenses/by-nc/4.0/) which permits unrestricted non-commercial use, distribution, and reproduction in any medium, provided the original work is properly cited.
ABSTRACT
-
Background
- The severity of gestational diabetes mellitus (GDM) is associated with adverse pregnancy outcomes. We aimed to generate a risk model for predicting insulin-requiring GDM before pregnancy in Korean women.
-
Methods
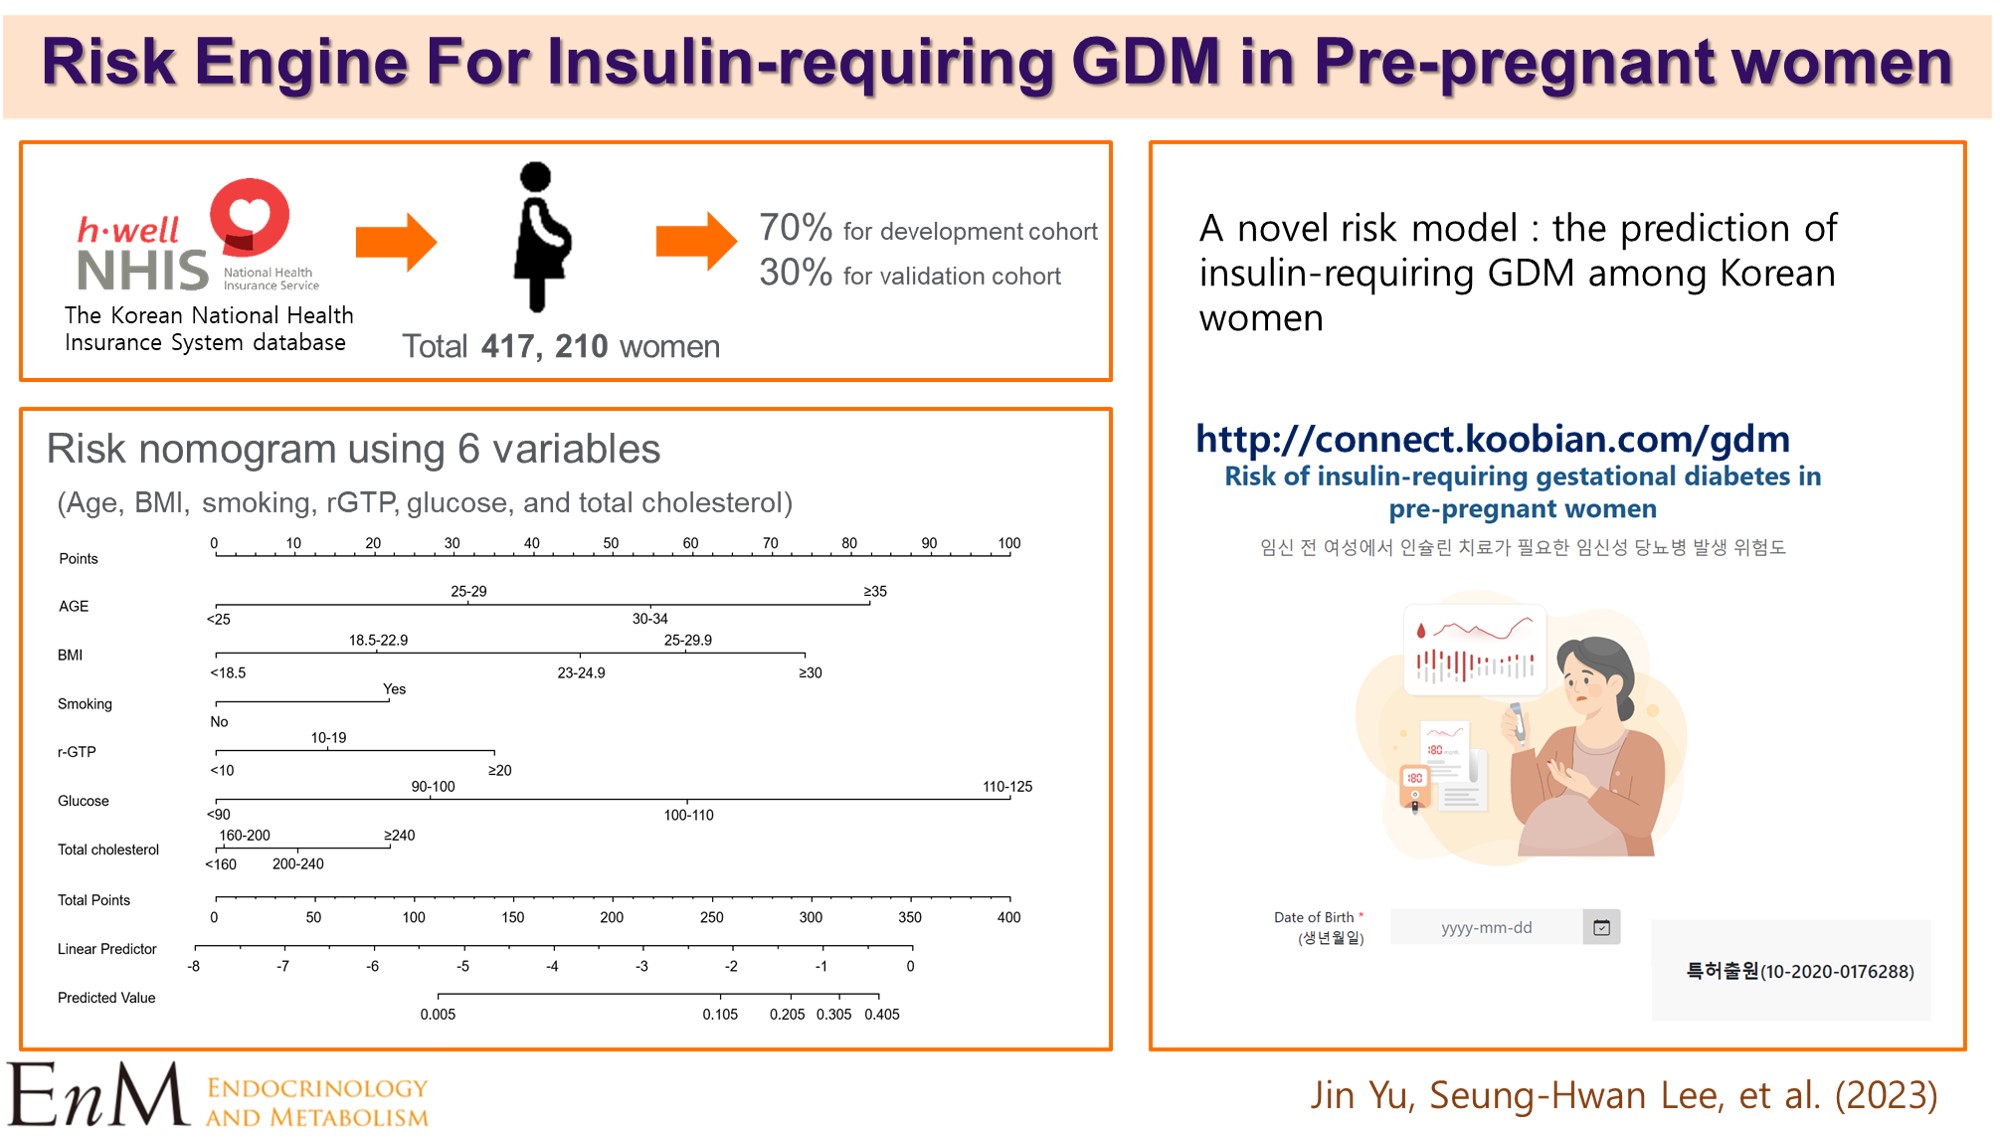
- A total of 417,210 women who received a health examination within 52 weeks before pregnancy and delivered between 2011 and 2015 were recruited from the Korean National Health Insurance database. The risk prediction model was created using a sample of 70% of the participants, while the remaining 30% were used for internal validation. Risk scores were assigned based on the hazard ratios for each risk factor in the multivariable Cox proportional hazards regression model. Six risk variables were selected, and a risk nomogram was created to estimate the risk of insulin-requiring GDM.
-
Results
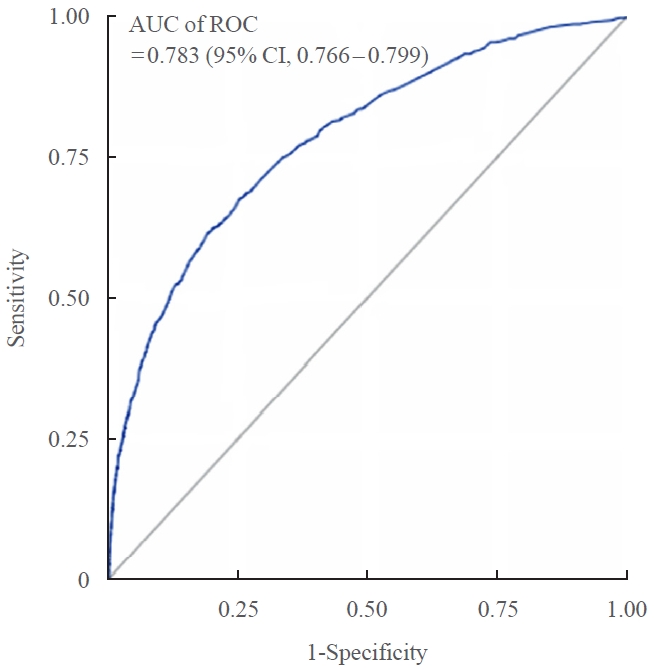
- A total of 2,891 (0.69%) women developed insulin-requiring GDM. Age, body mass index (BMI), current smoking, fasting blood glucose (FBG), total cholesterol, and γ-glutamyl transferase were significant risk factors for insulin-requiring GDM and were incorporated into the risk model. Among the variables, old age, high BMI, and high FBG level were the main contributors to an increased risk of insulin-requiring GDM. The concordance index of the risk model for predicting insulin-requiring GDM was 0.783 (95% confidence interval, 0.766 to 0.799). The validation cohort’s incidence rates for insulin-requiring GDM were consistent with the risk model’s predictions.
-
Conclusion
- A novel risk engine was generated to predict insulin-requiring GDM among Korean women. This model may provide helpful information for identifying high-risk women and enhancing prepregnancy care.
- Gestational diabetes mellitus (GDM) is characterized by high levels of blood glucose detected or developed during pregnancy. The prevalence of GDM is increasing worldwide and is expected to continue to increase [1]. It has also been reported that the incidence of GDM is higher in Asians [2], and a recent study using a nationwide claim database in Korea showed that the prevalence of GDM is increasing annually [3].
- GDM is one of the major causes of increasing maternal and fetal mortality and morbidity. Mothers with GDM are more likely to develop postpartum type 2 diabetes mellitus (DM), high blood pressure, preeclampsia, cesarean section, and cardiovascular disease [2,4]. Children born to mothers with GDM have a higher risk of congenital anomalies, neonatal hypoglycemia, and developing type 2 DM in the future [4]. Because the risk of adverse outcomes for the mother, fetus, and newborn increases [5], it is important to predict GDM in advance to reduce health-related burden.
- Several studies have created risk prediction models to prevent and treat GDM in advance. Because there is no gold standard method for diagnosing and predicting GDM, the prediction rate is different depending on the screening tools used [6,7]. Different risk variables were used in separate studies [2,8-12], but commonly used variables were age, prepregnancy body mass index (BMI), blood glucose, family history of DM, and previous history of GDM or macrosomia [13]. Because of the differences in the study population, risk variables, and methods used, it is difficult to compare the performance of the risk models directly and requires further validation. Of note, most previous models predicted the risk of GDM based on the data obtained in the first trimester. Therefore, we aimed to establish a risk assessment model for GDM with prepregnancy parameters for earlier identification of women at risk of severe GDM using an extensive nationwide population-based cohort database.
INTRODUCTION
- Data source and study population
- The Korean National Health Insurance Service (NHIS) claims and health examination database were used in this analysis. All Korean citizens are members of the NHIS, a single governmentrun insurer that provides complete healthcare-related data on behalf of the entire Korean population. The claim database is composed of an eligibility database (e.g., sex, age, income rank, disability, type of eligibility, mortality information), a medical treatment database (diagnosis statements defined by the International Classification of Disease 10th revision [ICD-10] codes, general information on specification, prescription statements, and consultation statements), and an institution database (types of medical care institutions, equipment, location, and the number of physicians). The NHIS encourages participants to have standardized health exams at least every 2 years. This database comprises questionnaires on lifestyle, behavior, past and family histories, anthropometric measurements, blood tests, and urinalysis. The NHIS certifies hospitals that provide health screenings and conducts routine quality control. Information about the NHIS database is provided elsewhere [14,15].
- We selected women who had delivered between 2011 and 2015. The date of conception was deemed to be 280 days prior to the delivery date [16], and 426,640 women had received health examinations within the 52 weeks before conception. We excluded subjects already on antidiabetic medication before pregnancy (n=3,306), having a fasting blood glucose (FBG) level of higher than 126 mg/dL at health examination (n= 1,816), and with missing data (n=4,308). The validation and development cohorts were divided from the final study population (n=417,210). To create the risk prediction model, 70% of the participants (n=292,048) were sampled; the remaining 30% (n=125,162) were chosen for internal validation using Harrell’s bootstrap resampling method. This study was approved by the Institutional Review Board of Seoul St. Mary’s Hospital, The Catholic University of Korea (No. KC19ZESI0586). As deidentified and anonymized data were utilized for analysis, informed consent was waived.
- Measurement of predictor variables and definitions
- Potential risk factors for GDM that are likely to have good predictive value were selected based on the literature and those available from the NHIS database. Subjects were categorized into four age groups: <25, 25–29, 30–34, and ≥35 years. Weight in kilograms divided by the square of height in meters was used to compute BMI. Five groups of obesity were defined according to the World Health Organization criterion for Asians: <18.5 (underweight), 18.5–22.9 (normal weight), 23–24.9 (overweight), 25–29.9 (stage I obesity), and ≥30.0 kg/m2 (stage II, III obesity). Abdominal obesity was defined by measuring waist circumference (WC) with a cutoff of 85 cm according to the criterion of the Korean Society for the Study of Obesity [17,18]. A self-report questionnaire was used to gather information on alcohol consumption and smoking habits, and drinking more than 30 g/day of alcohol was considered heavy consumption. Regular exercise was defined as performing at least 20 minutes of strenuous physical activity 3 times/week or at least 30 minutes of moderate physical activity 5 times/week [18]. FBG levels (<90, 90–100, 100–110, and 110–125 mg/dL) and total cholesterol (TC) levels (<160, 160–200, 200–240, and ≥240 mg/dL) were categorized into four groups. Triglyceride (TG) and high-density lipoprotein (HDL) cholesterol levels were dichotomized at 150 and 50 mg/dL, respectively. γ-Glutamyl transferase (γ-GTP) levels were categorized into three groups (<10, 10–20, and ≥20 IU/L). Hypertension was defined as at least one claim with ICD-10 codes I10 or I11 and the prescription of antihypertensive agents or systolic/diastolic blood pressure ≥140/90 mm Hg. Insulin-requiring GDM was diagnosed when a prescription of insulin during the pregnancy period occurred in subjects without a history of previous diabetes [16].
- Statistical analysis
- Baseline characteristics according to insulin-requiring GDM are presented as numbers and frequencies as percentages, and the chi-squared test was employed to identify differences in categorical variables. Univariate and multivariate Cox proportional hazards regression analyses were used to estimate the hazard ratio (HR) and 95% confidence interval (CI) values for insulin-requiring GDM according to the risk group. In the final Cox proportional hazards regression model, we allocated risk scores based on the HR for each risk factor [19]. Each of the six variables, including age, BMI, smoking status, FBG, TC, and γ-GTP, was applied with scores of 0 to 100. The risk prediction model for insulin-requiring GDM was translated into a risk score nomogram. Each variable was made to correspond to a specific point by drawing a line straight up the score axis. C-statistics were applied to evaluate discriminative power and determine the best risk model. The predicted and observed risks of insulin-requiring GDM in the development and validation cohorts were compared by ranking participants into decile groups of the total risk score. SAS version 9.4 (SAS Institute Inc., Cary, NC, USA) was used for all statistical analyses. A P value of <0.05 was considered to be statistically significant.
METHODS
- Baseline characteristics of the study subjects
- The clinical characteristics of subjects according to incidental insulin-requiring GDM in the development and validation cohorts are presented in Table 1. Among the study participants, 2,891 (0.69%) women had developed insulin-requiring GDM. In both cohorts, subjects with insulin-requiring GDM were older, more obese, and abdominally obese, more likely to be current smokers, and hypertensive, and less likely to be primipara. They were also likely to have higher FBG, TC, TG, and γ-GTP levels and lower HDL-cholesterol levels. However, there were no differences in alcohol consumption or engagement in regular exercise between the two groups.
- Risk variables for incident insulin-requiring GDM
- The univariate and multivariate HRs (95% CI) for insulin-requiring GDM according to risk categories, obtained using the development cohort, are presented in Table 2. In the univariate analysis, all the variables in Table 2 were associated with the development of insulin-requiring GDM. After multivariable adjustment, the HRs in the groups aged 25–29, 30–34, and ≥35 years were 2.02 (95% CI, 1.39 to 2.95), 3.36 (95% CI, 2.32 to 4.87), and 6.18 (95% CI, 4.25 to 9.00), respectively, compared with the youngest group (age <25 years). Compared with normal weight subjects, the HRs of women with BMI 23–25, 25–30, and ≥30 kg/m2 were 1.76 (95% CI, 1.56 to 2.00), 2.36 (95% CI, 2.09 to 2.67), and 3.30 (95% CI, 2.73 to 3.98), respectively. Underweight women had a significantly lower risk of developing insulin-requiring GDM. There were positive linear relationships between FBG, TC, and γ-GTP levels and the risk of incident insulin-requiring GDM. In particular, impaired fasting glucose status had the most significant impact, with FBG 110 to 125 mg/dL associated with a more than 9-fold higher risk than those with FBG <90 mg/dL. In addition, current smoking was associated with a 1.6-fold higher risk of insulin-requiring GDM.
- Development and validation of the risk engine for predicting insulin-requiring GDM
- We first tested the predictive performance of various models with different parameters. The original model that used the parameters listed in Table 2 showed a high predictive value with an area under the curve (AUC) of receiver operating characteristic (ROC) curve value of 0.783 (95% CI, 0.766 to 0.799) (Fig. 1). Using TG and HDL-cholesterol instead of TC (0.784; 95% CI, 0.768 to 0.800), using WC instead of BMI (0.772; 95% CI, 0.755 to 0.788), or including all of these parameters together (0.785; 95% CI, 0.769 to 0.801) resulted in similar predictive performance (data not shown). Therefore, we selected the original model, the most practical, with easily obtained parameters in clinical practice.
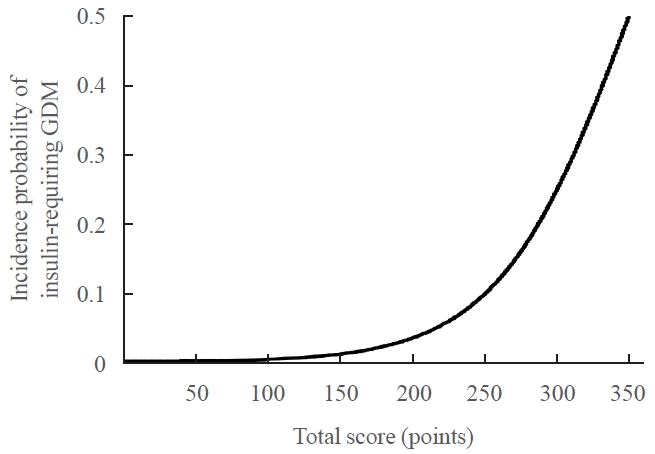
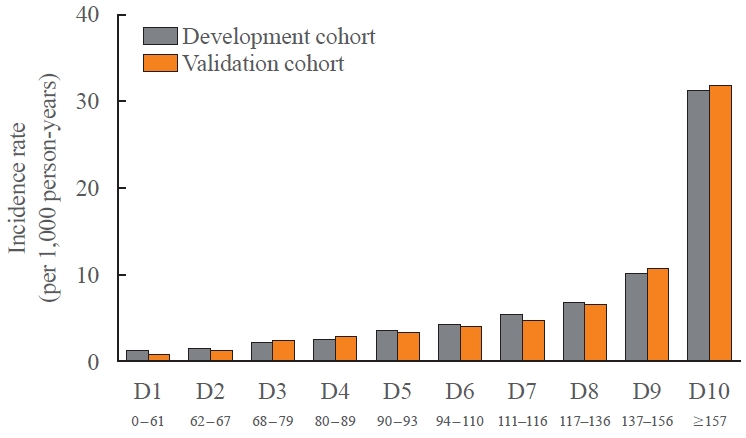
- To calculate the risk of developing insulin- requiring GDM, a nomogram based on the risk prediction model was developed (Fig. 2). The total risk score, the sum of the scores for six variables, ranged from 0 to 335 (Table 3). Among the variables, old age, high BMI, and high FBG level were the main contributors to an increased risk of insulin-requiring GDM. For example, a nonsmoking (0 points) 34-year-old (55 points) woman who had a BMI of 29.0 kg/m2 (59 points), FBG level of 116 mg/dL (100 points), TC level of 220 mg/dL (10 points), and γ-GTP level of 24 IU/L (35 points) would have a total risk score of 259. This score corresponds to an 11.5% incidence probability of insulin-requiring GDM (Fig. 3). For more user-friendly clinical applications, an interactive web-based platform that evaluates risk automatically is available at http://connect.koobian.com/gdm. We compared the incidence rate of insulin-requiring GDM in accordance with the decile groups of the total risk score for the internal validation of the created risk model. The incidence rates of insulin-requiring GDM in the validation cohort matched those anticipated by the risk model (Fig. 4).
RESULTS
- This study developed a model for predicting GDM during the prepregnancy period in Korean women by using the Korean NHIS claims and health examination database. Among the variables, old age, high BMI, and a high FBG level before pregnancy were the main contributors to an increased risk of insulin-requiring GDM. Additionally, an easily applicable web-based risk calculator was generated. A simple model-based on clinical characteristics and laboratory measurements commonly available at health checkups could identify women at risk of developing GDM, especially GDM requiring insulin therapy.
- It is well known that elevated glucose may be a significant driving force for the progression of glucose dysregulation in subjects with prediabetes [20,21]. In the current study, we observed that high FBG before pregnancy was the most substantial risk factor for developing severe GDM. The risk of GDM in women with FBG 110 to 125 mg/dL was 9.2 times higher than that in women with FBG <90 mg/dL. The risk of GDM in women with FBG 90 to 99 mg/dL was also 1.8 times higher than that in women with FBG <90 mg/dL. Alterations in glucose metabolism precede pregnancy, even at the levels of hyperglycemia below overt DM [22]. It was reported that FBG levels at the start of pregnancy, first trimester, were independently and continuously related to the risk of GDM and large for gestational age [23]. Both International Association of Diabetes and Pregnancy Study Groups and the World Health Organization have proposed using FBG levels at the first prenatal visit ≥92 and <126 mg/dL for the diagnosis of early GDM [24]. However, the diagnosis of GDM in early pregnancy by FBG levels is still a matter of debate. According to the gestational week, specific glucose cutoffs should be defined since metabolic changes in pregnancy result in a decrease in glucose levels of approximately 2 mg/dL between 6 and 10 weeks [25]. Our study is unique in that the risk of developing GDM is predicted according to the FBG levels measured at a health checkup before pregnancy.
- Obesity is well known to increase the risk of GDM by influencing insulin resistance, maternal metabolism, and the production of an inflammatory response in pregnant women. Our study was consistent with previous studies in that the incidence of GDM increased as BMI increased [26-28]. In our study, the risk of GDM in women with a BMI of 23 to 25 kg/m2 (overweight range in Koreans) was 1.76 times higher than that in women with normal weight. Additionally, the risk of GDM in women with BMI 25–30 and ≥30 kg/m2 was 2.36 times and 3.30 higher than that in women with normal weight, respectively. BMI criteria were set differently in other studies, such as 25, 27, or 30 kg/m2. Still, one study [27] assigned a cutoff for BMI 23 kg/m2 as a risk factor for GDM, which shows that GDM risk increases with increasing BMI, not only in obesity but also in overweight women. The results of our study encompass the results of previous studies by giving risk factor weighted scores through BMI stratification.
- It was recently reported that elevated γ-GTP, alanine aminotransferase levels, or both before pregnancy were independent risk factors for GDM in a subsequent pregnancy [29]. Recent evidence suggests that nonalcoholic fatty liver disease (NAFLD) in early pregnancy is an independent risk factor for GDM and that GDM is a substantial risk marker for future NAFLD [30]. Because γ-GTP has an antioxidant property by catabolizing extracellular glutathione, the levels may be elevated to produce more glutathione in response to oxidative stress, which is the condition of increased free radical activity and high lipid oxidation that induces insulin resistance in peripheral tissues and impairs insulin secretion from pancreatic β-cells [31]. In our study, a positive linear relationship between γ-GTP levels and the risk of incident insulin-requiring GDM was found, which is consistent with other studies [32].
- During pregnancy, TC, low-density lipoprotein, and very low-density lipoprotein increase overall. Although hyperlipidemia is thought to result in a stable nutrient supply to the fetus, it is still debated whether these changes are physiological or pathological [33]. Many studies have shown an association between TG levels and GDM [33,34]. In our study, we used TC as a predictor, and a linear relationship with GDM was shown. When TG and HDL-cholesterol levels were used instead of TC, the predictive performance was similar, consistent with other studies showing TG and GDM relationships.
- The average age of new mothers is rising, and several studies have revealed that there are various obstetric complications and GDM according to the mother’s age through meta-analysis [35,36]. Consistent with other studies, advanced maternal age was a strong risk factor for GDM requiring insulin during pregnancy.
- Although numerous risk factors for GDM have been identified as described, the ability to accurately identify women at risk for developing GDM before or early in pregnancy remains limited. Previous models primarily rely on prior history of GDM as the strongest predictor of subsequent GDM, which does not apply to earlier pregnant women [2,10,37]. One study made a prediction model using mid-upper arm circumference (MUAC), previous stillbirth, and family history of type 2 DM, but this information may not be readily identifiable [8]. There was a similar prediction model made with four variables in Chinese women, which used a nomogram. The predictive power of that study was 0.70, and our study had a higher C-statistic value [9]. Our risk model has strength in that we could predict the risk of GDM before pregnancy, which allows more preemptive intervention to minimize the development of GDM in high-risk women. We focused on insulin-requiring GDM, which needs much more attention and intensive care than mild GDM and will aid in identifying women who need immediate management. Our model was generated using a large-sized database of the general population, allowing application to a wide range of subjects. However, some limitations should be acknowledged. First, a direct comparison was not possible because the variables used in the model are not identical to other models. However, internal validation was performed to confirm that the actual incidence rate was similar to the predicted value. Second, this model was created based on the data of Korean women, and additional verification is needed to confirm it applies to other countries or ethnic groups. Third, other predictive models used the history of GDM as an important predictor, but we did not have information on this parameter.
- In conclusion, our risk model with six basic factors will help predict patients with insulin-requiring GDM before pregnancy. Estimating a woman’s risk for GDM requiring insulin treatment during pregnancy through model-based incorporation of risk factors accurately identifies those at high-risk who could benefit from preventive intervention encouraging immediate incorporation of this tool into preconception and prenatal care. This risk assessment approach would improve the quality of care for women preparing for pregnancy and ultimately reduce adverse maternal or fetal outcomes.
DISCUSSION
-
CONFLICTS OF INTEREST
No potential conflict of interest relevant to this article was reported.
-
AUTHOR CONTRIBUTIONS
Conception or design: S.H.L., K.H., M.K.K. Acquisition, analysis, or interpretation of data: S.H.L., J.Y., K.H., S.W.L., M.K.K. Drafting the work or revising: S.H.L., J.Y., M.K.K. Final approval of the manuscript: S.H.L., J.Y., K.H., S.W.L., S.Y.Y., H.S.K., J.H.C., K.H.Y., M.K.K.
Article information
-
Acknowledgements
- This study was performed using the database from the National Health Insurance System, and the results do not necessarily represent the opinion of the National Health Insurance Corporation.
- This study was supported by the 2019 research fund of Seoul St. Mary’s Hospital, The Catholic University of Korea.

| Variable | No. of events (%) | Univariate | Multivariatea | |
|---|---|---|---|---|
| Age, yr | ||||
| <25 | 29 (0.2) | 1 (reference) | 1 (reference) | |
| 25–29 | 447 (0.39) | 1.92 (1.32–2.80) | 2.02 (1.39–2.95) | |
| 30–34 | 946 (0.74) | 3.71 (2.57–5.38) | 3.36 (2.32–4.87) | |
| ≥35 | 602 (1.76) | 8.87 (6.11–12.88) | 6.18 (4.25–9.00) | |
| Body mass index, kg/m2 | ||||
| <18.5 | 124 (0.27) | 0.55 (0.46–0.66) | 0.64 (0.53–0.77) | |
| 18.5–22.9 | 952 (0.5) | 1 (reference) | 1 (reference) | |
| 23–24.9 | 355 (1.17) | 2.36 (2.08–2.66) | 1.76 (1.56–2.00) | |
| 25–29.9 | 443 (2.06) | 4.20 (3.75–4.71) | 2.36 (2.09–2.67) | |
| ≥30 | 150 (3.99) | 8.30 (6.97–9.89) | 3.30 (2.73–3.98) | |
| Smoking status | ||||
| No | 1,879 (0.67) | 1 (reference) | 1 (reference) | |
| Current | 145 (1.39) | 2.10 (1.77–2.48) | 1.62 (1.36,1.93) | |
| Fasting blood glucose, mg/dL | ||||
| <90 | 637 (0.36) | 1 (reference) | 1 (reference) | |
| 90–99 | 697 (0.78) | 2.16 (1.94–2.40) | 1.82 (1.63–2.03) | |
| 100–109 | 409 (1.93) | 5.41 (4.77–6.13) | 3.72 (3.27–4.23) | |
| 110–125 | 281 (5.42) | 15.77 (13.67–18.20) | 9.15 (7.88–10.64) | |
| Total cholesterol, mg/dL | ||||
| <160 | 415 (0.5) | 1 (reference) | 1 (reference) | |
| 160–199 | 925 (0.62) | 1.25 (1.11–1.40) | 1.02 (0.91–1.15) | |
| 200–239 | 527 (1.05) | 2.13 (1.87–2.42) | 1.26 (1.10–1.44) | |
| ≥240 | 157 (1.96) | 4.01 (3.33–4.83) | 1.62 (1.34–1.97) | |
| γ-GTP, IU/L | ||||
| <10 | 121 (0.35) | 1 (reference) | 1 (reference) | |
| 10–19 | 1,110 (0.55) | 1.56 (1.29–1.88) | 1.37 (1.13–1.65) | |
| ≥20 | 793 (1.47) | 4.24 (3.50–5.14) | 2.17 (1.78–2.65) | |
- 1. Cho NH, Shaw JE, Karuranga S, Huang Y, da Rocha Fernandes JD, Ohlrogge AW, et al. IDF Diabetes Atlas: global estimates of diabetes prevalence for 2017 and projections for 2045. Diabetes Res Clin Pract 2018;138:271–81.ArticlePubMed
- 2. Lee KW, Ching SM, Ramachandran V, Yee A, Hoo FK, Chia YC, et al. Prevalence and risk factors of gestational diabetes mellitus in Asia: a systematic review and meta-analysis. BMC Pregnancy Childbirth 2018;18:494.ArticlePubMedPMCPDF
- 3. Jung CH, Jung SH, Choi D, Kim BY, Kim CH, Mok JO. Gestational diabetes in Korea: temporal trends in prevalence, treatment, and short-term consequences from a national health insurance claims database between 2012 and 2016. Diabetes Res Clin Pract 2021;171:108586.ArticlePubMed
- 4. Plows JF, Stanley JL, Baker PN, Reynolds CM, Vickers MH. The pathophysiology of gestational diabetes mellitus. Int J Mol Sci 2018;19:3342.ArticlePubMedPMC
- 5. HAPO Study Cooperative Research Group. The Hyperglycemia and Adverse Pregnancy Outcome (HAPO) study. Int J Gynaecol Obstet 2002;78:69–77.ArticlePubMedPDF
- 6. Hong S, Lee SM, Kwak SH, Kim BJ, Koo JN, Oh IH, et al. A comparison of predictive performances between old versus new criteria in a risk-based screening strategy for gestational diabetes mellitus. Diabetes Metab J 2020;44:726–36.ArticlePubMedPMCPDF
- 7. Kim MH, Kwak SH, Kim SH, Hong JS, Chung HR, Choi SH, et al. Pregnancy outcomes of women additionally diagnosed as gestational diabetes by the International Association of the Diabetes and Pregnancy Study Groups Criteria. Diabetes Metab J 2019;43:766–75.ArticlePubMedPMCPDF
- 8. Nombo AP, Mwanri AW, Brouwer-Brolsma EM, Ramaiya KL, Feskens EJM. Gestational diabetes mellitus risk score: a practical tool to predict gestational diabetes mellitus risk in Tanzania. Diabetes Res Clin Pract 2018;145:130–7.ArticlePubMed
- 9. Guo F, Yang S, Zhang Y, Yang X, Zhang C, Fan J. Nomogram for prediction of gestational diabetes mellitus in urban, Chinese, pregnant women. BMC Pregnancy Childbirth 2020;20:43.ArticlePubMedPMCPDF
- 10. Schaefer KK, Xiao W, Chen Q, He J, Lu J, Chan F, et al. Prediction of gestational diabetes mellitus in the Born in Guangzhou Cohort Study, China. Int J Gynaecol Obstet 2018;143:164–71.ArticlePubMedPDF
- 11. Ramos-Levi AM, Perez-Ferre N, Fernandez MD, Del Valle L, Bordiu E, Bedia AR, et al. Risk factors for gestational diabetes mellitus in a large population of women living in Spain: implications for preventative strategies. Int J Endocrinol 2012;2012:312529.PubMedPMC
- 12. Zheng T, Ye W, Wang X, Li X, Zhang J, Little J, et al. A simple model to predict risk of gestational diabetes mellitus from 8 to 20weeks of gestation in Chinese women. BMC Pregnancy Childbirth 2019;19:252.ArticlePubMedPMCPDF
- 13. Chi Z, Zhang S, Wang Y, Yang L, Yang Y, Li X. Research of gestational diabetes mellitus risk evaluation method. Technol Health Care 2016;24 Suppl 2:S499–503.ArticlePubMed
- 14. Kim HK, Song SO, Noh J, Jeong IK, Lee BW. Data configuration and publication trends for the Korean National Health Insurance and Health Insurance Review & Assessment Database. Diabetes Metab J 2020;44:671–8.ArticlePubMedPMCPDF
- 15. Kim MK, Han K, Lee SH. Current trends of big data research using the Korean National Health Information Database. Diabetes Metab J 2022;46:552–63.ArticlePubMedPMCPDF
- 16. Kim MK, Han K, You SY, Kwon HS, Yoon KH, Lee SH. Prepregnancy smoking and the risk of gestational diabetes requiring insulin therapy. Sci Rep 2020;10:13901.ArticlePubMedPMCPDF
- 17. Seo MH, Lee WY, Kim SS, Kang JH, Kang JH, Kim KK, et al. 2018 Korean Society for the Study of Obesity guideline for the management of obesity in Korea. J Obes Metab Syndr 2019;28:40–5.ArticlePubMedPMC
- 18. Cho Y, Han K, Kim DH, Park YM, Yoon KH, Kim MK, et al. Cumulative exposure to metabolic syndrome components and the risk of dementia: a nationwide population-based study. Endocrinol Metab (Seoul) 2021;36:424–35.ArticlePubMedPMCPDF
- 19. Lee SH, Han K, Kim HS, Cho JH, Yoon KH, Kim MK. Predicting the development of myocardial infarction in middleaged adults with type 2 diabetes: a risk model generated from a nationwide population-based cohort study in Korea. Endocrinol Metab (Seoul) 2020;35:636–46.ArticlePubMedPMCPDF
- 20. Weir GC, Laybutt DR, Kaneto H, Bonner-Weir S, Sharma A. Beta-cell adaptation and decompensation during the progression of diabetes. Diabetes 2001;50 Suppl 1:S154–9.ArticlePubMedPDF
- 21. Kim MK, Han K, Koh ES, Hong OK, Baek KH, Song KH, et al. Cumulative exposure to impaired fasting glucose and future risk of type 2 diabetes mellitus. Diabetes Res Clin Pract 2021;175:108799.ArticlePubMed
- 22. Corrado F, D’Anna R, Cannata ML, Interdonato ML, Pintaudi B, Di Benedetto A. Correspondence between first-trimester fasting glycaemia, and oral glucose tolerance test in gestational diabetes diagnosis. Diabetes Metab 2012;38:458–61.ArticlePubMed
- 23. Riskin-Mashiah S, Younes G, Damti A, Auslender R. Firsttrimester fasting hyperglycemia and adverse pregnancy outcomes. Diabetes Care 2009;32:1639–43.ArticlePubMedPMCPDF
- 24. International Association of Diabetes and Pregnancy Study Groups Consensus Panel, Metzger BE, Gabbe SG, Persson B, Buchanan TA, Catalano PA, et al. International association of diabetes and pregnancy study groups recommendations on the diagnosis and classification of hyperglycemia in pregnancy. Diabetes Care 2010;33:676–82.ArticlePubMedPMCPDF
- 25. Mills JL, Jovanovic L, Knopp R, Aarons J, Conley M, Park E, et al. Physiological reduction in fasting plasma glucose concentration in the first trimester of normal pregnancy: the diabetes in early pregnancy study. Metabolism 1998;47:1140–4.ArticlePubMed
- 26. Torloni MR, Betran AP, Horta BL, Nakamura MU, Atallah AN, Moron AF, et al. Prepregnancy BMI and the risk of gestational diabetes: a systematic review of the literature with meta-analysis. Obes Rev 2009;10:194–203.ArticlePubMed
- 27. Ogonowski J, Miazgowski T, Kuczynska M, KrzyzanowskaSwiniarska B, Celewicz Z. Pregravid body mass index as a predictor of gestational diabetes mellitus. Diabet Med 2009;26:334–8.ArticlePubMed
- 28. Kouhkan A, Khamseh ME, Moini A, Pirjani R, Arabipoor A, Zolfaghari Z, et al. Diagnostic accuracy of body mass index and fasting glucose for the prediction of gestational diabetes mellitus after assisted reproductive technology. Int J Fertil Steril 2019;13:32–7.PubMedPMC
- 29. Kim WJ, Chung Y, Park J, Park JY, Han K, Park Y, et al. Influences of pregravid liver enzyme levels on the development of gestational diabetes mellitus. Liver Int 2021;41:743–53.ArticlePubMedPDF
- 30. You SY, Han K, Lee SH, Kim MK. Nonalcoholic fatty liver disease and the risk of insulin-requiring gestational diabetes. Diabetol Metab Syndr 2021;13:90.ArticlePubMedPMCPDF
- 31. Zhang H, Forman HJ, Choi J. Gamma-glutamyl transpeptidase in glutathione biosynthesis. Methods Enzymol 2005;401:468–83.PubMed
- 32. Zhao W, Zhang L, Zhang G, Varkaneh HK, Rahmani J, Clark C, et al. The association of plasma levels of liver enzymes and risk of gestational diabetes mellitus: a systematic review and dose-response meta-analysis of observational studies. Acta Diabetol 2020;57:635–44.ArticlePubMedPDF
- 33. Li Y, Wang X, Jiang F, Chen W, Li J, Chen X. Serum lipid levels in relation to clinical outcomes in pregnant women with gestational diabetes mellitus: an observational cohort study. Lipids Health Dis 2021;20:125.ArticlePubMedPMCPDF
- 34. Ryckman KK, Spracklen CN, Smith CJ, Robinson JG, Saftlas AF. Maternal lipid levels during pregnancy and gestational diabetes: a systematic review and meta-analysis. BJOG 2015;122:643–51.ArticlePubMedPDF
- 35. Li Y, Ren X, He L, Li J, Zhang S, Chen W. Maternal age and the risk of gestational diabetes mellitus: a systematic review and meta-analysis of over 120 million participants. Diabetes Res Clin Pract 2020;162:108044.ArticlePubMed
- 36. Lean SC, Derricott H, Jones RL, Heazell AE. Advanced maternal age and adverse pregnancy outcomes: a systematic review and meta-analysis. PLoS One 2017;12:e0186287.ArticlePubMedPMC
- 37. Badon SE, Zhu Y, Sridhar SB, Xu F, Lee C, Ehrlich SF, et al. A pre-pregnancy biomarker risk score improves prediction of future gestational diabetes. J Endocr Soc 2018;2:1158–69.ArticlePubMedPMC
References
Figure & Data
References
Citations
- Establishment and validation of a nomogram to predict the neck contracture after skin grafting in burn patients: A multicentre cohort study
Rui Li, Yangyang Zheng, Xijuan Fan, Zilong Cao, Qiang Yue, Jincai Fan, Cheng Gan, Hu Jiao, Liqiang Liu
International Wound Journal.2023; 20(9): 3648. CrossRef - Predicting the Need for Insulin Treatment: A Risk-Based Approach to the Management of Women with Gestational Diabetes Mellitus
Anna S. Koefoed, H. David McIntyre, Kristen S. Gibbons, Charlotte W. Poulsen, Jens Fuglsang, Per G. Ovesen
Reproductive Medicine.2023; 4(3): 133. CrossRef - Prepregnancy Glucose Levels Within Normal Range and Its Impact on Obstetric Complications in Subsequent Pregnancy: A Population Cohort Study
Ho Yeon Kim, Ki Hoon Ahn, Geum Joon Cho, Soon-Cheol Hong, Min-Jeong Oh, Hai-Joong Kim
Journal of Korean Medical Science.2023;[Epub] CrossRef - Risk of Cause-Specific Mortality across Glucose Spectrum in Elderly People: A Nationwide Population-Based Cohort Study
Joonyub Lee, Hun-Sung Kim, Kee-Ho Song, Soon Jib Yoo, Kyungdo Han, Seung-Hwan Lee
Endocrinology and Metabolism.2023; 38(5): 525. CrossRef - The CHANGED Score—A New Tool for the Prediction of Insulin Dependency in Gestational Diabetes
Paul Rostin, Selina Balke, Dorota Sroka, Laura Fangmann, Petra Weid, Wolfgang Henrich, Josefine Theresia Königbauer
Journal of Clinical Medicine.2023; 12(22): 7169. CrossRef
 PubReader
 ePub Link
 Cite
Cite


