
 KES

Articles
- Page Path
- HOME > Endocrinol Metab > Volume 38(1); 2023 > Article
-
Original ArticleDiabetes, obesity and metabolism Impact of Post-Transplant Diabetes Mellitus on Survival and Cardiovascular Events in Kidney Transplant Recipients
 Keypoint
In a retrospective cohort study of kidney transplant recipients, the clinical outcomes of patients with and without post-transplant diabetes mellitus were compared. The study found that patient survival and four-point major atherosclerotic cardiovascular events were similar in both groups. However, patients with a long duration of post-transplant diabetes mellitus had a higher incidence of four-point major atherosclerotic cardiovascular events. -
Ja Young Jeon1
 , Shin Han-Bit2, Bum Hee Park2,3, Nami Lee1, Hae Jin Kim1, Dae Jung Kim1, Kwan-Woo Lee1, Seung Jin Han1
-
Endocrinology and Metabolism 2023;38(1):139-145.
DOI: https://doi.org/10.3803/EnM.2022.1594
Published online: February 6, 2023
1Department of Endocrinology and Metabolism, Ajou University School of Medicine, Suwon, Korea
2Department of Biomedical Informatics, Ajou University School of Medicine, Suwon, Korea
3Office of Biostatistics, Medical Research Collaboration Center, Ajou Research Institute for Innovation, Ajou University Medical Center, Suwon, Korea
- Corresponding author: Seung Jin Han. Department of Endocrinology and Metabolism, Ajou University School of Medicine, 164 World cup-ro, Yeongtong-gu, Suwon 16499, Korea Tel: +82-31-219-5126, Fax: +82-31-219-4497, E-mail: hsj@ajou.ac.kr
Copyright © 2023 Korean Endocrine Society
This is an Open Access article distributed under the terms of the Creative Commons Attribution Non-Commercial License (http://creativecommons.org/licenses/by-nc/4.0/) which permits unrestricted non-commercial use, distribution, and reproduction in any medium, provided the original work is properly cited.

ABSTRACT
-
Background
- Post-transplant diabetes mellitus (PTDM) is a risk factor for poor outcomes after kidney transplantation (KT). However, the outcomes of KT have improved recently. Therefore, we investigated whether PTDM is still a risk factor for mortality, major atherosclerotic cardiovascular events (MACEs), and graft failure in KT recipients.
-
Methods
- We studied a retrospective cohort of KT recipients (between 1994 and 2017) at a single tertiary center, and compared the rates of death, MACEs, overall graft failure, and death-censored graft failure after KT between patients with and without PTDM using Kaplan-Meier analysis and a Cox proportional hazard model.
-
Results
- Of 571 KT recipients, 153 (26.8%) were diagnosed with PTDM. The mean follow-up duration was 9.6 years. In the Kaplan- Meier analysis, the PTDM group did not have a significantly increased risk of death or four-point MACE compared with the non-diabetes mellitus group (log-rank test, P=0.957 and P=0.079, respectively). Multivariate Cox proportional hazard models showed that PTDM did not have a negative impact on death or four-point MACE (P=0.137 and P=0.181, respectively). In addition, PTDM was not significantly associated with overall or death-censored graft failure. However, patients with a long duration of PTDM had a higher incidence of four-point MACE.
-
Conclusion
- Patient survival and MACEs were comparable between groups with and without PTDM. However, PTDM patients with long duration diabetes were at higher risk of cardiovascular disease.
- Kidney transplantation (KT) is the recommended treatment for selected patients with end-stage renal disease (ESRD), because it improves survival and quality of life compared with long-term dialysis [1]. However, there are many complications related to the surgery and immunosuppressant medications following KT. Post-transplant diabetes mellitus (PTDM), i.e., diabetes newly detected after transplantation, is a common complication (incidence of 10% to 25%) [2-4]. PTDM is associated with a poor prognosis after KT [2,5,6]. This can be explained by the fact that chronic hyperglycemia leads to micro- and macrovascular complications and death. As outcomes of KT, long-term graft and patient survival have recently improved in both deceased and living donor KT recipients, despite unfavorable changes in donor and recipient factors [7]. This improved prognosis after KT may be experienced by KT recipients with PTDM.
- Some recent studies of patients who underwent KT after 2000 reported no unfavorable impact on clinical outcomes, including coronary artery disease and graft failure [6,8]. Therefore, this study investigated whether PTDM was associated with incident mortality, major atherosclerotic cardiovascular events (MACEs), and graft failure in KT recipients during the last 20 years.
INTRODUCTION
- Study design
- This 27-year observational cohort study of KT recipients was conducted at a single tertiary center in Korea. Subjects were excluded if they had diabetes before KT, were aged <18 years at the time of KT, were lost to follow-up, or had received two or more graft transplantations. The study analyzed 571 of 810 KT recipients who underwent transplantation from 1994 to 2017 and were followed until 2021. The Institutional Review Board of Ajou University Hospital approved the study protocol (AJOUIRB-MDB-2019-145). Informed consent was waived by the board. This study conformed to the guidelines of the Declaration of Helsinki. Medical records were obtained from the institutional electronic database.
- The definition of PTDM was based on the American Diabetes Association criteria: fasting plasma glucose ≥126 mg/dL; 2-hour plasma glucose ≥200 mg/dL during an oral glucose tolerance test; or the requirement for glucose-lowering drugs, including oral hypoglycemic agents and insulin injection. The duration of PTDM was calculated starting from the date of diagnosis. The outcome measures were the four-point MACE (cardiovascular death, nonfatal myocardial infarction, nonfatal stroke, or hospitalization for unstable angina), all-cause mortality, overall graft failure, and death-censored graft failure rates. Death or the requirement for dialysis due to failed kidney transplant was considered to indicate overall graft failure. Cases requiring dialysis after KT were classified as death-censored graft failure. As a baseline comorbidity, cardiovascular disease (CVD) included a history of coronary heart disease (CHD), cerebrovascular disease, and peripheral arterial disease. The causes of ESRD were determined by a kidney transplant specialist.
- Immunosuppressive protocol
- Prior to 2001, induction therapy did not always feature administration of anti-thymocyte globulin and an anti-CD3 antibody. The maintenance immunosuppressant combination was cyclosporine, mycophenolate mofetil, and corticosteroids. Since 2001, the immunosuppressive regimen consisted of basiliximab as induction therapy, a calcineurin inhibitor (tacrolimus or cyclosporine), mycophenolate mofetil, and corticosteroids. Highdose glucocorticoids were administered intravenously for several days after transplantation and the dose was reduced gradually. When acute rejection was suspected and confirmed by liver biopsy, high-dose glucocorticoid was given and then tapered.
- Statistical analyses
- All statistical tests were performed using SPSS software version 19.0 (IBM Co., Armonk, NY, USA) or R version 4.0.5 (R Foundation for Statistical Computing, Vienna, Austria). Continuous variables are expressed as means±standard deviations or medians with interquartile ranges, and were compared between two groups using Student’s t test and the Mann-Whitney U test. Categorical variables are presented as numbers and percentages and were assessed using the chi-square test or Fisher’s exact test. KaplanMeier curves were used to analyze four-point MACE and allcause death, and the log-rank test was used to compare the curves. Multivariate-adjusted hazard ratios (HRs) for kidney transplant outcomes, such as four-point MACE, all-cause death, overall graft failure, and death-censored graft failure, were analyzed using Cox proportional hazard models. The assumptions for the Cox proportional hazards model were examined with the Schoenfeld test (1980), i.e., whether the Schoenfeld residuals scattered randomly around zero after regressing those for each time t was determined. For a model violating the assumptions, a “time-dependent” proportional hazards model was constructed by adding time-dependent covariates (Supplemental Fig. S1). Two-sided P values <0.05 were considered statistically significant.
METHODS
- Characteristics of the PTDM and non-PTDM groups
- The study population was followed for a mean of 9.6 years. At the time of KT, the mean age of the subjects was 43.6 years and 69.4% had hypertension as a comorbidity (n=396). The main causes of ESRD were glomerulonephritis (21.5%), polycystic kidney disease (3.9%), and hypertension (3.7%) (Table 1). FK506 (60.2%) was the calcineurin inhibitor used most after KT, followed by cyclosporine (39.8%). Half of the subjects received a kidney from a living donor (51.3%) (Table 1). The KT recipients who developed PTDM were older and more likely to be obese, smoke, and have hypertension, but did not differ in terms of donor characteristics from KT recipients who did not develop PTDM (Table 1). The cumulative incidence of PTDM was similar between the two transplant periods (1994 to 2007, 28%; 2008 to 2017, 26%).
- Comparison of KT outcomes between the PTDM and non-PTDM groups
- During follow-up, 153 (26.8%) KT recipients were diagnosed with PTDM, 64 (11.2%) had four-point MACE, and 48 (8.4%) died. The main causes of death were infectious disease (n=18; 37.5% of deaths), CVD (n=15; 31.3%), and cancer (n=5; 10.4%).
- Regarding the Kaplan-Meier curves (Fig. 1), the PTDM group did not have poorer in terms of all-cause death or fourpoint MACE (P=0.957 and P=0.079, respectively), although they exhibited a higher risk trend for MACE. To identify risk factors for MACEs and all-cause death, a Cox proportional hazard model was constructed including the duration of PTDM and variables affecting KT outcomes, according to the Kaplan-Meier curves of all-cause death and four-point MACE for both groups (which began to diverge as follow-up progressed). Older age was positively associated with a higher risk of all-cause death (HR, 1.06; P<0.001) and transplantation from 2008 to 2017 with a lower risk of all-cause death (HR, 0.35; P=0.007) (Table 2). Old age (HR, 1.05; P=0.003), history of smoking (HR, 2.25; P=0.018), CVD (HR, 5.09; P<0.001), and transplantation from a deceased donor (HR, 3.41; P<0.001) were all associated with a high risk of four-point MACE (Table 2). PTDM was not a risk factor for all-cause death (HR, 3.72; P=0.137), four-point MACE (HR, 0.60; P=0.181), overall graft failure (HR, 2.33; P=0.054), or death-censored graft failure (HR, 2.11; P=0.140) (Tables 2, 3). However, a long duration of PTDM was associated with a higher risk of four-point MACE (HR, 1.10; P=0.009) (Table 2).
RESULTS
- This study followed 571 KT recipients at a single tertiary center over 27 years. PTDM was not a significant risk factor for major adverse outcomes of KT recipients, such as all-cause death and four-point MACE. In addition, PTDM was not strongly associated with increased long-term graft loss, such as overall and death-censored graft failure. However, long duration PTDM was a potential risk factor for four-point MACE. The cumulative incidence of PTDM was 26.8% (153/571) during the 10-year follow-up period. Subjects who developed PTDM were older and more likely to be obese, smokers, and hypertensive, similar to patients with pretransplant DM. The incidence of PTDM did not differ significantly according to transplant era.
- Although KT reduces the risk of CVD and mortality compared with remaining on the transplant waiting list, KT recipients still have higher CVD and mortality risks than the general population [9]. In this study, the risk factors for all-cause mortality were old age and early, rather than recent, KT. Despite the KT recipients being older and having more comorbidities, improved management of KT recipients with comorbidities and advanced perioperative care and surgical techniques have improved the KT success and survival rates. In one long follow-up study, the survival of KT recipients improved by 20% compared with 10 years earlier [10]. In an analysis of Korean data, the 1-year mortality rate after KT showed improvement over time [11]. In the present study, factors associated with an increased risk of CVD in KT recipients were old age, smoking, prior CVD, transplantation from a deceased donor, and long duration PTDM. Old age, smoking, and prior CVD are traditional risk factors for four-point MACE in KT recipients, as in the general population [12]. Transplantation from deceased donors is a risk factor for post-transplant myocardial infarction in KT patients [13].
- The effect of PTDM on the development of CVD and death remains unclear. Numerous studies have reported negative effects of PTDM on CVD and mortality [14,15]. However, the risk posed by PTDM for poor clinical KT outcomes may have decreased relative to previous studies [6,16]. As the outcomes of diabetes have recently improved; appropriate treatment of PTDM and strict management of other risk factors may be a contributing factor. In addition, the studies differ in terms of the KT populations, study designs, immunosuppression regimens, follow-up durations, transplantation eras, and race.
- Regarding the Kaplan-Meier curves for four-point MACE in this study, the curves began to diverge between the two groups after prolonged follow-up. The duration of diabetes is the most important factor when assessing CVD risk in patients with this comorbidity. The European Society of Cardiology and European Association for the Study of Diabetes used the duration of diabetes as a criterion for risk stratification of CVD in patients with diabetes [17]. Patients with diabetes for ≥10 years were at higher risk of CVD than those with diabetes for <10 years. The CHD risk in patients with diabetes increased significantly with diabetes duration, and long duration diabetes was strongly associated with a higher risk of coronary artery events [18,19]. Specifically, a long duration of diabetes, rather than diabetes itself, was suggested as a risk factor for coronary artery disease [18]. The association between diabetes duration and elevated CHD risk could be explained by longer exposure to chronic hyperglycemia. Gaynor et al. [6] suggested that the time taken for PTDM to negatively influence KT outcomes is considerable. In this context, we reported, in a cohort study, that pretransplant diabetes, which implies a longer exposure to chronic hyperglycemia than PTDM, was a risk factor for four-point MACE and post-transplant mortality [4]. The present study suggests that PTDM patients with long duration diabetes have a significantly elevated risk of CVD.
- Unlike four-point MACE, long duration PTDM was not risk factor for all-cause mortality. The time taken for PTDM to negatively impact mortality may be longer compared with four-point MACE. In our study, the Kaplan-Meier curves of all-cause mortality diverged between the two groups later than that of four-point MACE. In addition, unlike Western populations, in this study, cardiovascular death represented a small proportion of deaths after KT. The death rate was also lower than that of four-point MACE.
- The purpose of this study was to investigate the effect of PTDM on the outcomes of KT, such as four-point MACE, death after KT, and graft failure, using data from a long-term, single-center follow-up study of Korean patients who underwent KT using a standard protocol. This study had several limitations. First it was a single-center retrospective cohort study, and may not represent the general transplant recipient population. Moreover, the incidence of events was low because the number of subjects was relatively small, although they were followed for a long period. It is necessary to collect more data and perform a large, multicenter prospective study. Second, we focused on Korean kidney recipients, so our findings might not be generalizable to other populations and ethnic groups.
- In summary, this long-term follow-up cohort study provided no evidence that PTDM is a risk factor for four-point MACE and mortality in KT recipients. The negative effects of PTDM have been reduced through close monitoring of PTDM onset, and proper management of the disease and related risk factors (hypertension and dyslipidemia). However, long duration PTDM, rather than simply the disease itself, was associated with an increased risk of four-point MACE. Since the complications of diabetes, such as four-point MACE, are associated with prolonged exposure to hyperglycemia, close attention and appropriate management are required for glycemic control of KT recipients with PTDM.
DISCUSSION
Supplementary material
Supplementary Fig 1.
-
CONFLICTS OF INTEREST
No potential conflict of interest relevant to this article was reported.
-
AUTHOR CONTRIBUTIONS
Conception or design: J.Y.J., S.J.H. Acquisition, analysis, or interpretation of data: J.Y.J., S.H.B., B.H.P., S.J.H. Drafting the work or revising: J.Y.J., N.L., H.J.K., D.J.K., K.W.L., S.J.H. Final approval of the manuscript: J.Y.J., S.H.B., B.H.P., N.L., H.J.K., D.J.K., K.W.L., S.J.H.
Article information
-
Acknowledgements
- This work was supported by a Korean Endocrine Society of EnM Research Award 2020.
- This work was supported by grant no. NRF2020R1I1A1- A01075337 from the National Research Foundation of Korea, awarded to Ja Young Jeon.
- This work was supported by grant no. NRF2022R1F1- A1064336 from the National Research Foundation of Korea, awarded to Seung Jin Han.

| Characteristic | No PTDM (n = 418) | PTDM (n = 153) | P value | |
|---|---|---|---|---|
| Age, yr | 42.6 ± 10.4 | 46.4 ± 9.0 | < 0.001 | |
| Male sex | 236 (56.5) | 82 (53.6) | 0.569 | |
| BMI, kg/m2 | 21.8 (20–24) | 23.0 (21–25) | < 0.001 | |
| Glucose, mg/dLa | 93.3 ± 12.2 | 96.5 ± 12.4 | 0.007 | |
| HbA1c, %b | 5.16 ± 0.42 | 5.30 ± 0.54 | 0.023 | |
| Type of dialysis | ||||
| Peritoneal dialysis | 67 (16.0) | 24 (15.7) | 0.936 | |
| Hemodialysis | 347 (83.0) | 128 (83.7) | ||
| Preemptive | 4 (1.0) | 1 (0.7) | ||
| Smoking | 22 (13.2) | 48 (31.4) | < 0.001 | |
| Comorbidities | ||||
| HTN | 271 (64.8) | 125 (81.7) | < 0.001 | |
| CVD | 12 (2.9) | 6 (3.9) | 0.589 | |
| Waiting time, mo | 35.7 (5–70) | 34.5 (3–66) | 0.708 | |
| Immunosuppressive drugs | ||||
| Tacrolimus | 242 (57.9) | 102 (66.7) | 0.067 | |
| Cyclosporine A | 176 (42.1) | 51 (33.3) | ||
| Cause of ESRD | ||||
| GNc | 103 (24.6) | 20 (13.1) | 0.049 | |
| Hypertension | 15 (3.6) | 6 (3.9) | ||
| Lupus | 7 (1.7) | 4 (2.6) | ||
| PCKD | 13 (3.1) | 9 (5.9) | ||
| Miscellaneousd | 5 (1.2) | 1 (0.7) | ||
| Unknown | 275 (65.8) | 113 (73.9) | ||
| Donor characteristics | ||||
| Age, yr | 42.7 (31–52) | 43.4 (30–51) | 0.893 | |
| Male sex | 249 (59.6) | 62 (40.5) | 0.999 | |
| ABO incompatible | 7 (1.7) | 3 (2.0) | 0.730 | |
| Living | 208 (49.9) | 85 (56.3) | 0.185 | |
| Transplant era | ||||
| 1994–2007 | 116 (27.8) | 46 (30.1) | 0.601 | |
| 2008–2017 | 302 (76.5) | 107 (69.9) | ||
Values are expressed as mean±standard deviation, number (%), or median (interquartile range).
PTDM, post-transplant diabetes mellitus; BMI, body mass index; HbA1c, hemoglobin A1c; HTN, hypertension; CVD, cardiovascular disease; ESRD, end-stage renal disease; GN, glomerulonephritis; PCKD, polycystic kidney disease.
a Includes random or fasting blood glucose levels measured in 565 subjects of the total of 571;
b From 337 subjects of the total of 571;
c Includes immunoglobulin A nephropathy, focal segmental glomerulosclerosis, membranoproliferative glomerulonephritis, and membranous glomerulonephritis;
d Includes Alport syndrome, interstitial nephritis, pyelonephritis, and post-streptococcal glomerulonephritis.
| Variable | Hazard ratio |
95% CI |
P value | ||
|---|---|---|---|---|---|
| Lower | Upper | ||||
| All-cause mortalitya | |||||
| Age (per year increase) | 1.064 | 1.027 | 1.102 | < 0.001 | |
| Female sex | 1.881 | 0.948 | 3.733 | 0.071 | |
| Smoker | 2.330 | 0.964 | 5.631 | 0.060 | |
| BMI, kg/m2 (per 1 kg/m2 increase) | 1.055 | 0.946 | 1.177 | 0.338 | |
| Hypertension | 2.002 | 0.683 | 5.870 | 0.206 | |
| History of cardiovascular disease | 1.175 | 0.268 | 5.150 | 0.831 | |
| 2008–2017 transplant era (vs. 1994–2007) | 0.351 | 0.165 | 0.747 | 0.007 | |
| Donor age | 1.012 | 0.988 | 1.036 | 0.343 | |
| Deceased donor (vs. living donor) | 1.830 | 0.950 | 3.523 | 0.071 | |
| PTDM | 3.722 | 0.658 | 21.042 | 0.137 | |
| Duration of PTDM | 1.239 | 0.933 | 1.646 | 0.139 | |
| Four-point major adverse cardiovascular eventsb | |||||
| Age (per year increase) | 1.048 | 1.016 | 1.081 | 0.003 | |
| Female sex | 0.902 | 0.492 | 1.654 | 0.738 | |
| Smoker | 2.247 | 1.150 | 4.389 | 0.018 | |
| BMI, kg/m2 (per 1 kg/m2 increase) | 1.050 | 0.949 | 1.163 | 0.344 | |
| Hypertension | 1.411 | 0.765 | 2.603 | 0.271 | |
| History of cardiovascular disease | 5.091 | 2.255 | 11.494 | < 0.001 | |
| 2008–2017 transplant era (vs. 1994–2007) | 0.566 | 0.293 | 1.094 | 0.090 | |
| Donor age | 1.009 | 0.989 | 1.029 | 0.370 | |
| Deceased donor (vs. living donor) | 3.412 | 1.838 | 6.335 | < 0.001 | |
| PTDM | 0.600 | 0.284 | 1.268 | 0.181 | |
| Duration of PTDM | 1.101 | 1.024 | 1.183 | 0.009 | |
| Variable | Hazard ratio |
95% CI |
P value | ||
|---|---|---|---|---|---|
| Lower | Upper | ||||
| Overall graft failurea | |||||
| Age (per year increase) | 0.990 | 0.970 | 1.009 | 0.290 | |
| Female sex | 1.335 | 0.912 | 1.957 | 0.138 | |
| Smoker | 1.546 | 0.951 | 2.516 | 0.079 | |
| BMI, kg/m2 (per 1 kg/m2 increase) | 1.053 | 0.988 | 1.123 | 0.113 | |
| Hypertension | 1.655 | 0.888 | 3.084 | 0.113 | |
| History of cardiovascular disease | 2.041 | 0.923 | 4.513 | 0.078 | |
| 2008–2017 transplant era (vs. 1994–2007) | 0.640 | 0.415 | 0.988 | 0.044 | |
| Donor age | 1.028 | 1.014 | 1.043 | < 0.001 | |
| Deceased donor (vs. living donor) | 1.480 | 1.008 | 2.173 | 0.046 | |
| PTDM | 2.331 | 0.945 | 5.520 | 0.054 | |
| Duration of PTDM | 1.121 | 0.985 | 1.276 | 0.084 | |
| Death-censored graft failureb | |||||
| Age (per year increase) | 0.965 | 0.944 | 0.987 | 0.002 | |
| Female sex | 1.195 | 0.762 | 1.874 | 0.439 | |
| Smoker | 1.566 | 0.905 | 2.710 | 0.109 | |
| BMI, kg/m2 (per 1 kg/m2 increase) | 1.053 | 0.977 | 1.134 | 0.177 | |
| Hypertension | 1.798 | 1.110 | 2.914 | 0.017 | |
| History of cardiovascular | 2.686 | 1.124 | 6.422 | 0.026 | |
| 2008–2017 transplant era (vs. 1994–2007) | 0.754 | 0.455 | 1.249 | 0.273 | |
| Donor age | 1.034 | 1.017 | 1.051 | < 0.001 | |
| Deceased donor (vs. living donor) | 1.436 | 0.915 | 2.253 | 0.116 | |
| PTDM | 2.109 | 0.783 | 5.684 | 0.140 | |
| Duration of PTDM | 1.111 | 0.961 | 1.285 | 0.154 | |
- 1. Wolfe RA, Ashby VB, Milford EL, Ojo AO, Ettenger RE, Agodoa LY, et al. Comparison of mortality in all patients on dialysis, patients on dialysis awaiting transplantation, and recipients of a first cadaveric transplant. N Engl J Med 1999;341:1725–30.ArticlePubMed
- 2. Kasiske BL, Snyder JJ, Gilbertson D, Matas AJ. Diabetes mellitus after kidney transplantation in the United States. Am J Transplant 2003;3:178–85.ArticlePubMedPDF
- 3. Ahmed SH, Biddle K, Augustine T, Azmi S. Post-transplantation diabetes mellitus. Diabetes Ther 2020;11:779–801.ArticlePubMedPMCPDF
- 4. Jeon JY, Kim SJ, Ha KH, Park JH, Park B, Oh CK, et al. Trends in the effects of pre-transplant diabetes on mortality and cardiovascular events after kidney transplantation. J Diabetes Investig 2021;12:811–8.ArticlePubMedPMCPDF
- 5. Lim WH, Lok CE, Kim SJ, Knoll G, Shah BR, Naylor K, et al. Impact of pretransplant and new-onset diabetes after transplantation on the risk of major adverse cardiovascular events in kidney transplant recipients: a population-based cohort study. Transplantation 2021;105:2470–81.ArticlePubMed
- 6. Gaynor JJ, Ciancio G, Guerra G, Sageshima J, Hanson L, Roth D, et al. Single-centre study of 628 adult, primary kidney transplant recipients showing no unfavourable effect of new-onset diabetes after transplant. Diabetologia 2015;58:334–45.ArticlePubMedPDF
- 7. Hariharan S, Israni AK, Danovitch G. Long-term survival after kidney transplantation. N Engl J Med 2021;385:729–43.ArticlePubMed
- 8. Choi JY, Kwon OJ. Post-transplant diabetes mellitus: is it associated with poor allograft outcomes in renal transplants? Transplant Proc 2013;45:2892–8.ArticlePubMed
- 9. Schnuelle P, Lorenz D, Trede M, Van Der Woude FJ. Impact of renal cadaveric transplantation on survival in end-stage renal failure: evidence for reduced mortality risk compared with hemodialysis during long-term follow-up. J Am Soc Nephrol 1998;9:2135–41.PubMed
- 10. Ying T, Shi B, Kelly PJ, Pilmore H, Clayton PA, Chadban SJ. Death after kidney transplantation: an analysis by era and time post-transplant. J Am Soc Nephrol 2020;31:2887–99.ArticlePubMedPMC
- 11. Park S, Kim M, Kim JE, Kim K, Park M, Kim YC, et al. Characteristics of kidney transplantation recipients over time in South Korea. Korean J Intern Med 2020;35:1457–67.ArticlePubMedPMCPDF
- 12. Jardine AG, Fellstrom B, Logan JO, Cole E, Nyberg G, Gronhagen-Riska C, et al. Cardiovascular risk and renal transplantation: post hoc analyses of the Assessment of Lescol in Renal Transplantation (ALERT) Study. Am J Kidney Dis 2005;46:529–36.ArticlePubMed
- 13. Lentine KL, Brennan DC, Schnitzler MA. Incidence and predictors of myocardial infarction after kidney transplantation. J Am Soc Nephrol 2005;16:496–506.ArticlePubMed
- 14. Cosio FG, Pesavento TE, Kim S, Osei K, Henry M, Ferguson RM. Patient survival after renal transplantation: IV. Impact of post-transplant diabetes. Kidney Int 2002;62:1440–6.ArticlePubMed
- 15. Cole EH, Johnston O, Rose CL, Gill JS. Impact of acute rejection and new-onset diabetes on long-term transplant graft and patient survival. Clin J Am Soc Nephrol 2008;3:814–21.ArticlePubMedPMC
- 16. Kuo HT, Sampaio MS, Vincenti F, Bunnapradist S. Associations of pretransplant diabetes mellitus, new-onset diabetes after transplant, and acute rejection with transplant outcomes: an analysis of the Organ Procurement and Transplant Network/United Network for Organ Sharing (OPTN/UNOS) database. Am J Kidney Dis 2010;56:1127–39.ArticlePubMed
- 17. Cosentino F, Grant PJ, Aboyans V, Bailey CJ, Ceriello A, Delgado V, et al. 2019 ESC guidelines on diabetes, pre-diabetes, and cardiovascular diseases developed in collaboration with the EASD. Eur Heart J 2020;41:255–323.PubMed
- 18. Wannamethee SG, Shaper AG, Whincup PH, Lennon L, Sattar N. Impact of diabetes on cardiovascular disease risk and all-cause mortality in older men: influence of age at onset, diabetes duration, and established and novel risk factors. Arch Intern Med 2011;171:404–10.PubMed
- 19. Kim JJ, Hwang BH, Choi IJ, Choo EH, Lim S, Kim JK, et al. Impact of diabetes duration on the extent and severity of coronary atheroma burden and long-term clinical outcome in asymptomatic type 2 diabetic patients: evaluation by Coronary CT angiography. Eur Heart J Cardiovasc Imaging 2015;16:1065–73.ArticlePubMed
References
Figure & Data
References
Citations

- Kidney transplantation beyond immunosuppression: shifting the focus from graft survival to patient health
Gabriella Moroni, Francesco Reggiani, Claudio Ponticelli
Frontiers in Immunology.2026;[Epub] CrossRef - Impact of Glucagon‐Like Peptide‐1 Receptor Agonists on Proteinuria in Kidney Transplant Recipients
Stephanie Shabanowitz, Ryan Clark, Rachel Bassett Allen, Mary Chandran, Anita Yang
Pharmacotherapy: The Journal of Human Pharmacology and Drug Therapy.2026;[Epub] CrossRef - Cardiovascular and Renal Outcomes Among Kidney Transplant Recipients With Metabolic Syndrome: A Systematic Review and Meta‐Analysis
Min Yie Lim, Loke Yuan Shee, Zhi Yong Wong, Wei Kei Wong, Ka Ting Ng, Foong Ming Moy, Soo Kun Lim
Clinical Transplantation.2026;[Epub] CrossRef - Impact of Tacrolimus Intra‐Patient Variability on Toxicity Development Among Lung Transplant Recipients
Rita Nogueiras‐Álvarez, Víctor Manuel Mora‐Cuesta, José Manuel Cifrián‐Martínez, María del Mar García‐Saiz
Basic & Clinical Pharmacology & Toxicology.2026;[Epub] CrossRef - Randomized Controlled Trial of Dapagliflozin for Post-Transplant Diabetes Mellitus in Renal Transplant Recipients
Lu Lin, Jinghui Li, Junwei Zhou, Xia Gao, Siyin Lin, Dong Wang, Pin Chen
Kidney International Reports.2026; 11(7): 106559. CrossRef - Impact of Early Post-Transplantation Diabetes Mellitus and Changes in Diabetic Status on Graft Failure and Mortality in Kidney Transplant Recipients
Junseok Jeon, Hye Ryoun Jang, Yebin Park, Kyungho Lee, Jung Eun Lee, Kyungdo Han, Wooseong Huh
Transplant International.2026;[Epub] CrossRef - Computed tomography-based intermuscular adipose tissue analysis and its role in predicting post-kidney transplantation diabetes mellitus
Yang Feng, Yuechen Shi, Kexin Ma, Jiaming Xiao, Ming Liu, Yuqing Yi, Xiaoyu Zhang, Ke Wang, Zhenming Gao
Asian Journal of Surgery.2025; 48(1): 221. CrossRef - Prognostic impact of post-transplant diabetes mellitus in kidney allograft recipients: a meta-analysis
Mehmet Kanbay, Dimitrie Siriopol, Mustafa Guldan, Lasin Ozbek, Ahmet U Topcu, Ianis Siriopol, Katherine Tuttle
Nephrology Dialysis Transplantation.2025; 40(3): 554. CrossRef -
Understanding the Impact of Calcineurin Inhibitors on T Cell Regulation: Mechanisms and Clinical Implications
Vijaykumar D. Nimbarte, Shreya S. Sonak, Sharda Ishwarkar
Critical Reviews in Immunology.2025; 45(4): 43. CrossRef - Stratifying Post‐Transplant Diabetes: Prognostic Impact of Insulin Dependence and Treatment Duration
Beatriz Rodríguez‐Cubillo, Alejandro Morales, Rómulo Katsu, Yunaika Díaz Enamorado, M. Ángeles Moreno de la Higuera, Natividad Calvo Romero, María Muñiz, Arianne S. Aiffil, Cristina Riaza, Pilar Matía, Isabel Pérez‐Flores, Raquel Jiménez Ortego, Marina Pu
Clinical Transplantation.2025;[Epub] CrossRef - Management of Type 2 and Post-Transplant Diabetes in Kidney Transplant Recipients: A Single-Center Clinical Experience with GLP-1 Receptor Agonists and SGLT-2 Inhibitors
Ricardo E. T. Navarrete, Joana C. Freitas, Isabel Fonseca, Ana Cunha, Joao Roberto Sa, La Salete Martins
Diabetology.2025; 6(12): 158. CrossRef - Effect of post-transplant diabetes mellitus on cardiovascular events and mortality: a single‐center retrospective cohort study
Uğur Ünlütürk, Tolga Yıldırım, Merve Savaş, Seda Hanife Oğuz, Büşra Fırlatan, Deniz Yüce, Nesrin Damla Karakaplan, Cemile Selimova, Rahmi Yılmaz, Yunus Erdem, Miyase Bayraktar
Endocrine.2024; 85(2): 695. CrossRef - Prevalence of new-onset diabetes mellitus after kidney transplantation: a systematic review and meta-analysis
Qiufeng Du, Tao Li, Xiaodong Yi, Shuang Song, Jing Kang, Yunlan Jiang
Acta Diabetologica.2024; 61(7): 809. CrossRef - Safety and efficacy of semaglutide in post kidney transplant patients with type 2 diabetes or Post-Transplant diabetes
Moeber Mohammed Mahzari, Omar Buraykan Alluhayyan, Mahdi Hamad Almutairi, Mohammed Abdullah Bayounis, Yazeed Hasan Alrayani, Amir A. Omair, Awad Saad Alshahrani
Journal of Clinical & Translational Endocrinology.2024; 36: 100343. CrossRef
 PubReader
 ePub Link
 Cite
 XML Download
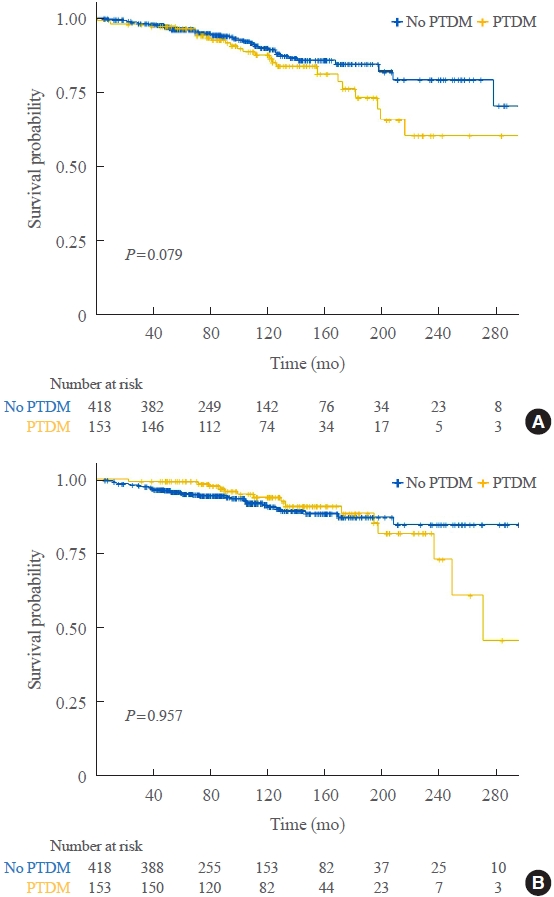
Fig. 1.
| Characteristic | No PTDM (n = 418) | PTDM (n = 153) | P value | |
|---|---|---|---|---|
| Age, yr | 42.6 ± 10.4 | 46.4 ± 9.0 | < 0.001 | |
| Male sex | 236 (56.5) | 82 (53.6) | 0.569 | |
| BMI, kg/m2 | 21.8 (20–24) | 23.0 (21–25) | < 0.001 | |
| Glucose, mg/dL |
93.3 ± 12.2 | 96.5 ± 12.4 | 0.007 | |
| HbA1c, % |
5.16 ± 0.42 | 5.30 ± 0.54 | 0.023 | |
| Type of dialysis | ||||
| Peritoneal dialysis | 67 (16.0) | 24 (15.7) | 0.936 | |
| Hemodialysis | 347 (83.0) | 128 (83.7) | ||
| Preemptive | 4 (1.0) | 1 (0.7) | ||
| Smoking | 22 (13.2) | 48 (31.4) | < 0.001 | |
| Comorbidities | ||||
| HTN | 271 (64.8) | 125 (81.7) | < 0.001 | |
| CVD | 12 (2.9) | 6 (3.9) | 0.589 | |
| Waiting time, mo | 35.7 (5–70) | 34.5 (3–66) | 0.708 | |
| Immunosuppressive drugs | ||||
| Tacrolimus | 242 (57.9) | 102 (66.7) | 0.067 | |
| Cyclosporine A | 176 (42.1) | 51 (33.3) | ||
| Cause of ESRD | ||||
| GN |
103 (24.6) | 20 (13.1) | 0.049 | |
| Hypertension | 15 (3.6) | 6 (3.9) | ||
| Lupus | 7 (1.7) | 4 (2.6) | ||
| PCKD | 13 (3.1) | 9 (5.9) | ||
| Miscellaneous |
5 (1.2) | 1 (0.7) | ||
| Unknown | 275 (65.8) | 113 (73.9) | ||
| Donor characteristics | ||||
| Age, yr | 42.7 (31–52) | 43.4 (30–51) | 0.893 | |
| Male sex | 249 (59.6) | 62 (40.5) | 0.999 | |
| ABO incompatible | 7 (1.7) | 3 (2.0) | 0.730 | |
| Living | 208 (49.9) | 85 (56.3) | 0.185 | |
| Transplant era | ||||
| 1994–2007 | 116 (27.8) | 46 (30.1) | 0.601 | |
| 2008–2017 | 302 (76.5) | 107 (69.9) | ||
| Variable | Hazard ratio | 95% CI |
P value | ||
|---|---|---|---|---|---|
| Lower | Upper | ||||
| All-cause mortality |
|||||
| Age (per year increase) | 1.064 | 1.027 | 1.102 | < 0.001 | |
| Female sex | 1.881 | 0.948 | 3.733 | 0.071 | |
| Smoker | 2.330 | 0.964 | 5.631 | 0.060 | |
| BMI, kg/m2 (per 1 kg/m2 increase) | 1.055 | 0.946 | 1.177 | 0.338 | |
| Hypertension | 2.002 | 0.683 | 5.870 | 0.206 | |
| History of cardiovascular disease | 1.175 | 0.268 | 5.150 | 0.831 | |
| 2008–2017 transplant era (vs. 1994–2007) | 0.351 | 0.165 | 0.747 | 0.007 | |
| Donor age | 1.012 | 0.988 | 1.036 | 0.343 | |
| Deceased donor (vs. living donor) | 1.830 | 0.950 | 3.523 | 0.071 | |
| PTDM | 3.722 | 0.658 | 21.042 | 0.137 | |
| Duration of PTDM | 1.239 | 0.933 | 1.646 | 0.139 | |
| Four-point major adverse cardiovascular events |
|||||
| Age (per year increase) | 1.048 | 1.016 | 1.081 | 0.003 | |
| Female sex | 0.902 | 0.492 | 1.654 | 0.738 | |
| Smoker | 2.247 | 1.150 | 4.389 | 0.018 | |
| BMI, kg/m2 (per 1 kg/m2 increase) | 1.050 | 0.949 | 1.163 | 0.344 | |
| Hypertension | 1.411 | 0.765 | 2.603 | 0.271 | |
| History of cardiovascular disease | 5.091 | 2.255 | 11.494 | < 0.001 | |
| 2008–2017 transplant era (vs. 1994–2007) | 0.566 | 0.293 | 1.094 | 0.090 | |
| Donor age | 1.009 | 0.989 | 1.029 | 0.370 | |
| Deceased donor (vs. living donor) | 3.412 | 1.838 | 6.335 | < 0.001 | |
| PTDM | 0.600 | 0.284 | 1.268 | 0.181 | |
| Duration of PTDM | 1.101 | 1.024 | 1.183 | 0.009 | |
| Variable | Hazard ratio | 95% CI |
P value | ||
|---|---|---|---|---|---|
| Lower | Upper | ||||
| Overall graft failure |
|||||
| Age (per year increase) | 0.990 | 0.970 | 1.009 | 0.290 | |
| Female sex | 1.335 | 0.912 | 1.957 | 0.138 | |
| Smoker | 1.546 | 0.951 | 2.516 | 0.079 | |
| BMI, kg/m2 (per 1 kg/m2 increase) | 1.053 | 0.988 | 1.123 | 0.113 | |
| Hypertension | 1.655 | 0.888 | 3.084 | 0.113 | |
| History of cardiovascular disease | 2.041 | 0.923 | 4.513 | 0.078 | |
| 2008–2017 transplant era (vs. 1994–2007) | 0.640 | 0.415 | 0.988 | 0.044 | |
| Donor age | 1.028 | 1.014 | 1.043 | < 0.001 | |
| Deceased donor (vs. living donor) | 1.480 | 1.008 | 2.173 | 0.046 | |
| PTDM | 2.331 | 0.945 | 5.520 | 0.054 | |
| Duration of PTDM | 1.121 | 0.985 | 1.276 | 0.084 | |
| Death-censored graft failure |
|||||
| Age (per year increase) | 0.965 | 0.944 | 0.987 | 0.002 | |
| Female sex | 1.195 | 0.762 | 1.874 | 0.439 | |
| Smoker | 1.566 | 0.905 | 2.710 | 0.109 | |
| BMI, kg/m2 (per 1 kg/m2 increase) | 1.053 | 0.977 | 1.134 | 0.177 | |
| Hypertension | 1.798 | 1.110 | 2.914 | 0.017 | |
| History of cardiovascular | 2.686 | 1.124 | 6.422 | 0.026 | |
| 2008–2017 transplant era (vs. 1994–2007) | 0.754 | 0.455 | 1.249 | 0.273 | |
| Donor age | 1.034 | 1.017 | 1.051 | < 0.001 | |
| Deceased donor (vs. living donor) | 1.436 | 0.915 | 2.253 | 0.116 | |
| PTDM | 2.109 | 0.783 | 5.684 | 0.140 | |
| Duration of PTDM | 1.111 | 0.961 | 1.285 | 0.154 | |
Values are expressed as mean±standard deviation, number (%), or median (interquartile range). PTDM, post-transplant diabetes mellitus; BMI, body mass index; HbA1c, hemoglobin A1c; HTN, hypertension; CVD, cardiovascular disease; ESRD, end-stage renal disease; GN, glomerulonephritis; PCKD, polycystic kidney disease. Includes random or fasting blood glucose levels measured in 565 subjects of the total of 571; From 337 subjects of the total of 571; Includes immunoglobulin A nephropathy, focal segmental glomerulosclerosis, membranoproliferative glomerulonephritis, and membranous glomerulonephritis; Includes Alport syndrome, interstitial nephritis, pyelonephritis, and post-streptococcal glomerulonephritis.
CI, confidence interval; BMI, body mass index; PTDM, post-transplant diabetes mellitus. Time-varying covariate: hypertension, PTDM, duration of PTDM; There are no time-dependent covariates because all variables satisfy the proportional hazard assumptions.
CI, confidence interval; BMI, body mass index; PTDM, post-transplant diabetes mellitus. Time-varying covariates: hypertension, PTDM, and duration of PTDM; Time-varying covariates: PTDM, duration of PTDM.


