Articles
- Page Path
- HOME > Endocrinol Metab > Volume 38(3); 2023 > Article
-
Original ArticleDiabetes, obesity and metabolism Effects of Weight Loss and Interaction with Physical Activity on Risks of Cardiovascular Outcomes in Individuals with Type 2 Diabetes
 Keypoint
This study on type 2 diabetes patients found that weight loss of 5% or more significantly lowered the risk of total cardiovascular events. This effect was most pronounced in physically active individuals. Weight loss of less than 5% showed no significant impact. Over two years, 19.2% of participants lost 5% or more of their weight, 27.6% lost less than 5%, and 53.1% gained weight. During an additional median follow-up of 9.3 years, 188 patients had cardiovascular events, and 106 died from cardiovascular causes. The study concludes that weight loss of 5% or more, especially when combined with regular physical activity, may be beneficial for cardiovascular disease prevention in type 2 diabetes patients. -
Claudia R. L. Cardoso
 , Nathalie C. Leite, Gil F. Salles
 -
Endocrinology and Metabolism 2023;38(3):305-314.
DOI: https://doi.org/10.3803/EnM.2023.1690
Published online: May 31, 2023
Department of Internal Medicine, University Hospital Clementino Fraga Filho, School of Medicine, Federal University of Rio de Janeiro, Rio de Janeiro, Brazil
- Corresponding author: Claudia R. L. Cardoso. Department of Internal Medicine, University Hospital Clementino Fraga Filho, School of Medicine, Federal University of Rio de Janeiro, Rua Croton 72, Rio de Janeiro 222750240, Brazil Tel: +55-21-3938-2513, Fax: +55-21-3938-2514 E-mail: claudiacardoso@hucff.ufrj.br
Copyright © 2023 Korean Endocrine Society
This is an Open Access article distributed under the terms of the Creative Commons Attribution Non-Commercial License (http://creativecommons.org/licenses/by-nc/4.0/) which permits unrestricted non-commercial use, distribution, and reproduction in any medium, provided the original work is properly cited.
ABSTRACT
-
Background
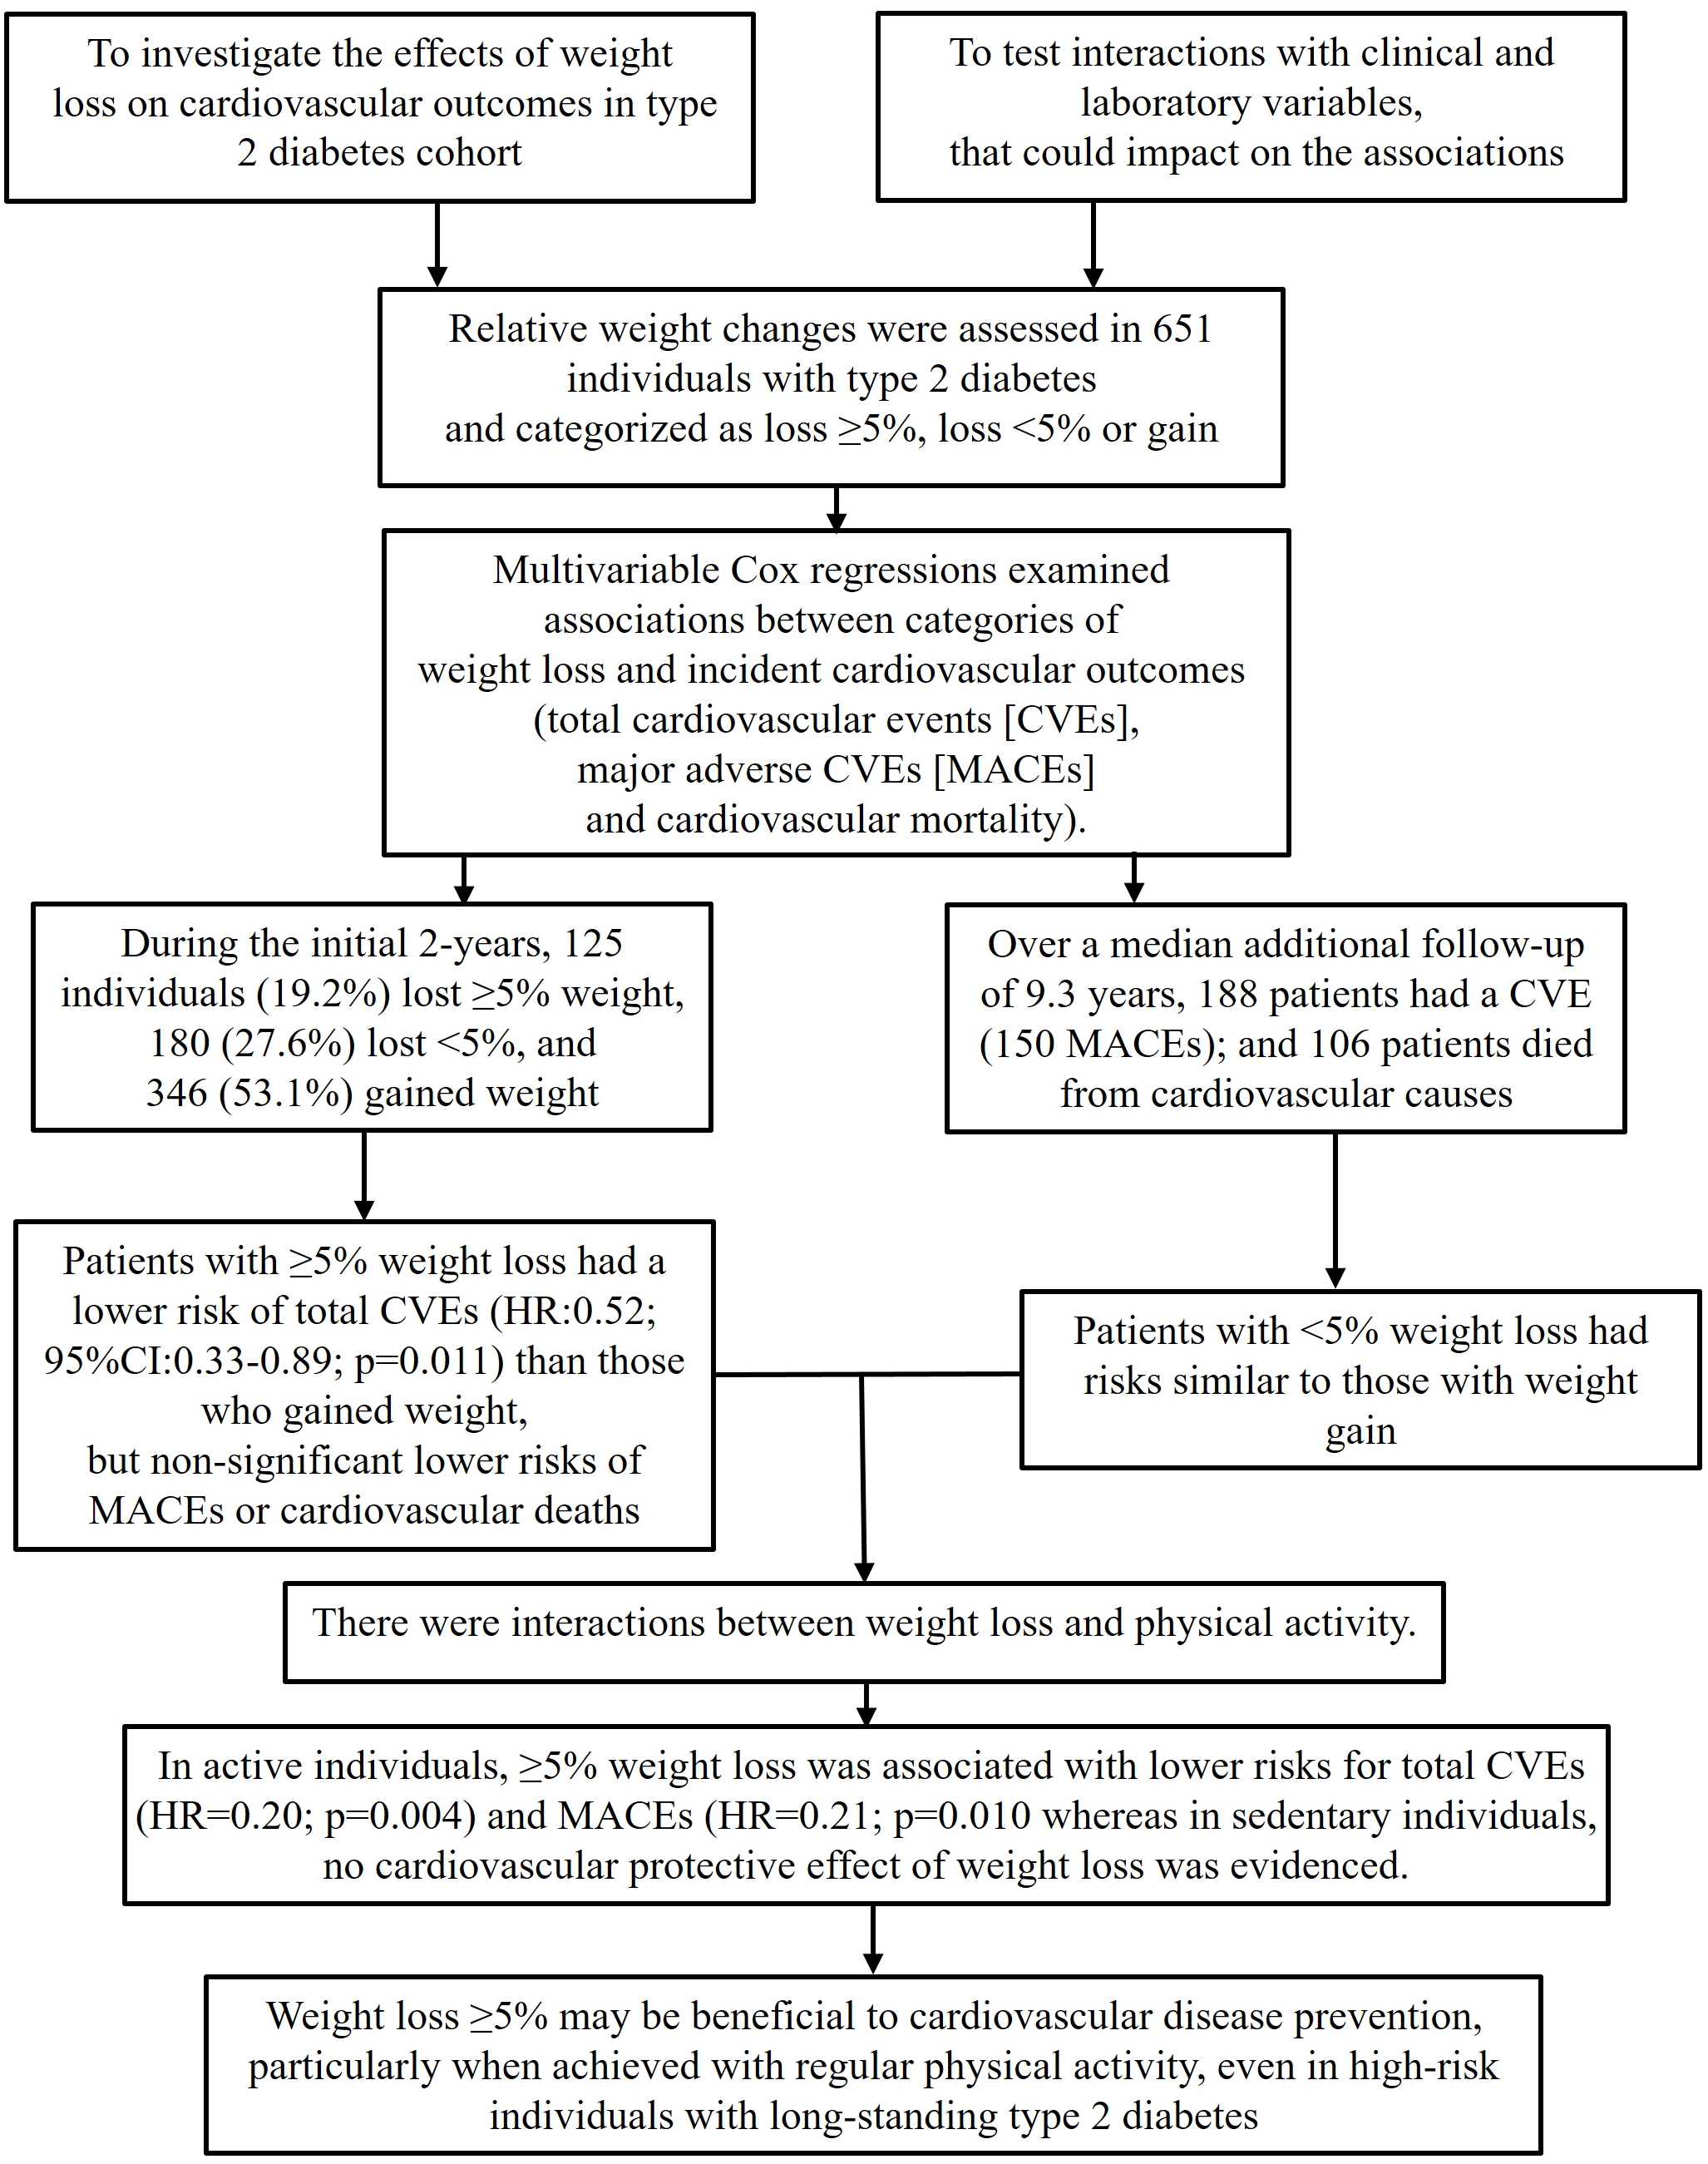
- This study investigated the effects of weight loss during follow-up on cardiovascular outcomes in a type 2 diabetes cohort and tested interactions with clinical and laboratory variables, particularly physical activity, that could impact the associations.
-
Methods
- Relative weight changes were assessed in 651 individuals with type 2 diabetes and categorized as ≥5% loss, <5% loss, or gain. Associations between weight loss categories and incident cardiovascular outcomes (total cardiovascular events [CVEs], major adverse cardiovascular events [MACEs], and cardiovascular mortality) were assessed using multivariable Cox regression with interaction analyses.
-
Results
- During the initial 2 years, 125 individuals (19.2%) lost ≥5% of their weight, 180 (27.6%) lost <5%, and 346 (53.1%) gained weight. Over a median additional follow-up of 9.3 years, 188 patients had CVEs (150 MACEs) and 106 patients died from cardiovascular causes. Patients with ≥5% weight loss had a significantly lower risk of total CVEs (hazard ratio [HR], 0.52; 95% confidence interval, 0.33 to 0.89; P=0.011) than those who gained weight, but non-significant lower risks of MACEs or cardiovascular deaths. Patients with <5% weight loss had risks similar to those with weight gain. There were interactions between weight loss and physical activity. In active individuals, ≥5% weight loss was associated with significantly lower risks for total CVEs (HR, 0.20; P=0.004) and MACEs (HR, 0.21; P=0.010), whereas in sedentary individuals, no cardiovascular protective effect of weight loss was evidenced.
-
Conclusion
- Weight loss ≥5% may be beneficial for cardiovascular disease prevention, particularly when achieved with regular physical activity, even in high-risk individuals with long-standing type 2 diabetes.
- Despite the increasing amount of evidence for the advantages of weight loss in improving cardiovascular risk factors in the short term, there is no consensus on the effect of weight loss by behavioral changes in providing better long-term cardiovascular outcomes in individuals with type 2 diabetes [1]. A recent systematic review including 17 studies, most of which had observational designs, showed that weight gain was associated with increased risks of incident cardiovascular disease; however, there was a lack of data to support weight loss interventions for preventing adverse cardiovascular outcomes [1]. Most of the observational studies in that systematic review assessed weight changes over a period of 1 to 2 years [2-10], and most of them did not show associations between weight loss and mortality [2,6,8,10]. However, weight measurements were variably obtained in these previous studies, which might have affected their concordance. In some studies, data on weight changes were obtained from patients’ medical records [3,4,7-9], while other studies conducted objective weight measurements [4,5,10-12]. Additionally, in a few studies, weight was only self-reported by participants [2,13,14] or no information was provided on how weight was ascertained [15]. Furthermore, although weight loss has been recommended for obese patients with type 2 diabetes, unintentional weight change might be detrimental, particularly in elderly people [16]. Finally, some studies showed that regardless of weight changes, sustained physical activity may be associated with improved survival, but not weight loss itself [7,17]. Ideally, together with encouraging weight loss in obese and overweight individuals, clinical interventions should aim at healthy lifestyle behaviors, particularly regular physical activity [7].
- Therefore, long-term follow-up studies investigating behavioral changes and their relationships with weight loss are still needed to understand the effects of such changes on cardiovascular disease and mortality. In particular, it is still necessary to investigate the possible interactions between weight changes and regular physical activity on cardiovascular outcomes in patients with type 2 diabetes, which is a high-cardiovascular-risk condition [7,17]. Taking this previous evidence into perspective, the current study utilized data from a middle-aged type 2 diabetes cohort with a long-term follow-up, in which most of the subjects had microvascular or macrovascular complications. The aims were (1) to investigate the effects of weight loss on adverse cardiovascular outcomes and (2) to explore the possible interactions between weight changes and regular physical activity on these cardiovascular outcomes.
INTRODUCTION
- Patients and baseline procedures
- This prospective study included 690 individuals with type 2 diabetes from the Rio de Janeiro Type 2 Diabetes Cohort Study, enrolled between August 2004 and December 2008 and re-evaluated annually until December 2019 in the diabetes outpatient clinic of the School of Medicine and University Hospital, Federal University of Rio de Janeiro, Brazil. The study was approved by the Research Ethics Committee of the School of Medicine and University Hospital, Federal University of Rio de Janeiro, Brazil (number124/2004), and all participants gave written informed consent. The characteristics of this cohort, the baseline procedures, and the diagnostic definitions and criteria for chronic complications of diabetes have been described previously and are further detailed in the Supplemental Methods [18-21]. In summary, the inclusion criteria were all adults with type 2 diabetes up to 80 years old with either any microvascular or macrovascular complication, or with at least two other modifiable cardiovascular risk factors. The exclusion criteria were morbid obesity (body mass index [BMI] ≥40 kg/m2), advanced renal failure (serum creatinine >180 μmol/L or estimated glomerular filtration rate <30 mL/min/1.73 m2), or the presence of any serious concomitant disease limiting life expectancy. For this analysis, we excluded 39 participants who had a cardiovascular event (CVE) during the initial 2 years after cohort entry (period of weight change assessment), totaling 651 individuals in this study. For all participants, a standard baseline protocol was used that included a thorough clinical-laboratory evaluation. Blood pressure (BP) in the clinic was measured three times using a digital oscillometric BP monitor (HEM-907XL, Omron Healthcare, Kyoto, Japan) with a suitable-sized cuff on two occasions 2 weeks apart at study entry. The first measure of each visit was discarded, and the mean BP recorded at the last two readings of each visit was used for further analysis. Arterial hypertension was diagnosed if the mean systolic blood pressure (SBP) was ≥140 mm Hg, the mean diastolic blood pressure was ≥90 mm Hg, or if antihypertensive drugs had been prescribed. The laboratory evaluation included fasting glycemia, glycated hemoglobin (HbA1c), and serum creatinine and lipid levels. Albuminuria was evaluated in two non-consecutive sterile 24-hour urine collections.
- Weight changes assessment
- Body weight was measured at baseline and at each clinic visit (three to four times per year) during the initial 2-year period after cohort entry, using the same digital scale device (Filizola Ltd., São Paulo, Brazil) with participants barefoot and wearing light clothing. Relative weight changes during the first 2 years were calculated as the last weight measured in the second year minus the baseline weight divided by the baseline weight multiplied by 100%. Weight changes were evaluated into three categories: weight loss ≥5%, weight loss between 0% to <5%, and weight gain. During this initial 2-year period of weight change assessment, variables potentially associated with weight change (BP, HbA1c, and serum lipids) were registered at each clinic visit and their mean values were considered. Self-reported physical activity was also recorded at each visit. Participants were considered physically active if at least in 10 months of each year of the first 2 years of follow-up they reported having regularly performed ≥150 minutes per week of moderate-intensity aerobic activity over 5 days a week, or 20 minutes of vigorous-intensity aerobic activity spread over 3 days/week, with no more than 2 consecutive days without activity [22]. On a 10-point scale, where sitting is 0 and all-out effort is 10, moderate-intensity activity is a 5 or 6, and vigorous-intensity activity is 7 or 8. Hence, this amount of aerobic activity did not include routine activities of daily living of light intensity (e.g., self-care, cooking, casual walking, or shopping) or moderate-intensity activities lasting less than 10 minutes in duration (e.g., walking around the home or office, or walking from the parking lot) [22].
- Follow-up and outcome assessment
- The follow-up for this report began after the initial 2-year body weight assessment period. The patients were followed up regularly at least three to four times a year until December 2019 while receiving standardized treatment. The observation period was considered as the number of months from the date of the last 2nd year weight measurement to the date of the last clinic visit in 2019 or the first endpoint, whichever came first. The primary outcome was the occurrence of any CVE (fatal or non-fatal myocardial infarctions [MIs], sudden cardiac death, new-onset heart failure, death from progressive heart failure, any myocardial revascularization procedure, fatal or non-fatal stroke, any aortic or lower limb revascularization procedure, any amputation above the ankle, and death from aortic or peripheral arterial disease). Major adverse cardiovascular events (MACEs; non-fatal MIs and strokes, as well as cardiovascular deaths), and cardiovascular mortality were considered as secondary outcomes [18].
- Statistical analyses
- Continuous data were described as mean±standard deviation or as median (interquartile range [IQR]). In the initial exploratory analysis, baseline characteristics were compared according to the categories of weight change by analysis of variance, the Kruskal-Wallis test, or the chi-square test, as appropriate. Kaplan-Meier curves for the incidence of cumulative endpoints during follow-up, compared by the log-rank test, were used to assess differences in the incidence of outcomes among weight change subgroups. To assess the independent prognostic value of categories of body weight change for each cardiovascular outcome, time-to-event multivariate Cox analyses were conducted with progressively increasing statistical adjustments for confounding. Model 1 was adjusted for age, sex, baseline BMI, smoking status, diabetes duration, the presence of macrovascular and microvascular complications, and the use of insulin, statins and the number of antihypertensive drugs. Model 2 was further adjusted for potential mediators of the effects of weight changes (physical activity and mean SBP, HbA1c, high-density lipoprotein cholesterol, and low-density lipoprotein cholesterol in the first 2-year period). These results were presented as hazard ratios (HRs) with their 95% confidence intervals (CIs). Because the current recommendation is that obese/overweight individuals with type 2 diabetes should lose weight, we estimated the HRs of the two subgroups with weight loss (≥5% and 0% to <5%) in relation to the category with weight gain as the reference. The proportional hazards assumption was tested by inspecting logminus-log curves, and no violation was observed. In sensitivity analyses, interactions between weight change subgroups and age (>60/≤60 years), sex, baseline BMI (≥30/<30 kg/m2), diabetes duration (≤5/>5 years), physical activity (active/sedentary), the absence or presence of microvascular and macrovascular complications, and glycemic control (mean HbA1c ≥7.5/<7.5%, ≥ 58/<58 mmol/mol) were tested for all outcomes, and whenever there was evidence of interaction (P<0.10 for the interaction term), a stratified analysis for this covariate were performed. The statistical analysis was performed with SPSS version 19.0 (IBM Corp., Armonk, NY, USA), and a two-tailed P value <0.05 was considered significant.
METHODS
- Baseline characteristics according to relative body weight changes
- In total, 651 individuals with type 2 diabetes were followed up and re-evaluated regularly at 3 to 4 months during the first 2 years after cohort entry. Over this period, 125 individuals (19.2%) lost ≥5% of their body weight, 180 (27.6%) lost <5% of their weight, and 346 (53.1%) gained weight. Table 1 outlines the baseline characteristics of all evaluated individuals and of cohort participants divided into these categories of relative body weight changes. Patients with ≥5% weight loss had greater baseline BMI and abdominal circumference, had a shorter diabetes duration, were less frequently treated with insulin, and had lower HbA1c and serum triglyceride levels than those who gained weight.
- Follow-up and incidence of adverse outcomes
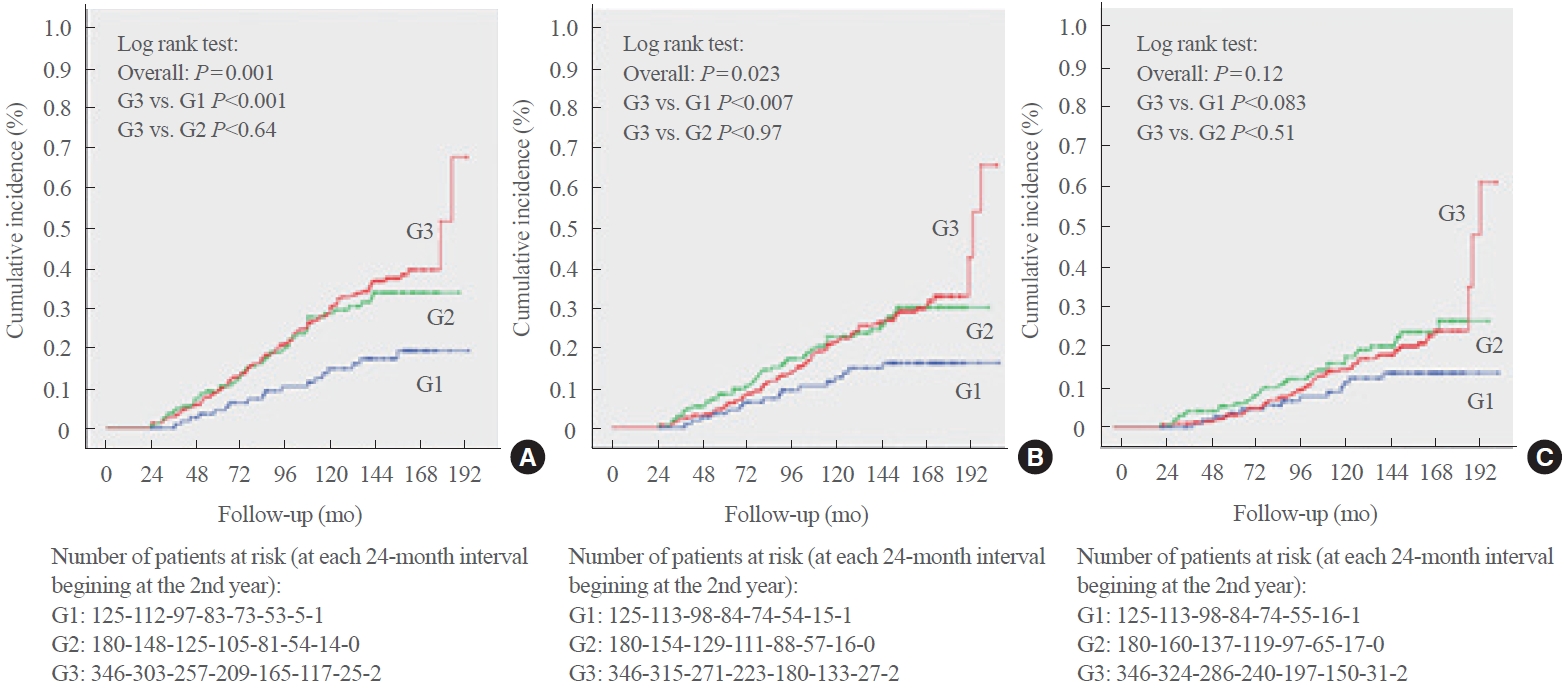
- After the 2-year body weight measurement period, patients were further followed up for a median of 9.3 years (IQR, 5.4 to 11.3; maximum 14.3), which corresponded to 5,198 personyears (PY) of follow-up, over which there were 188 total CVEs (incidence rate, 31.6 per 1,000 PY), 150 MACEs (24.3 per 1,000 PY), and 106 deaths from cardiovascular causes (16.5 per 1,000 PY). Table 2 shows that the incidence rates of total CVEs and MACEs were lowest in the subgroup with greater weight loss (≥5%) and similar between the other two subgroups (weight loss <5% and weight gain). These significantly lower cumulative incidence rates of total CVEs and MACEs during follow-up in the subgroup with greater weight loss were further confirmed in the Kaplan-Meier curves shown in Fig. 1. There were no significant differences among the subgroups of weight changes in relation to cardiovascular mortality incidence.
- Adjusted risks associated with changes in body weight
- Table 3 outlines the adjusted risks associated with relative body weight change subgroups. Patients with ≥5% weight loss had a significant risk reduction (by 48%) for total CVEs and non-significant reductions of 34% and 15% in risk for MACEs and cardiovascular mortality, respectively, compared to those who gained weight during the first 2 years of follow-up. Patients with <5% weight loss had risks similar to those who gained weight for the three outcomes.
- There was evidence of interaction (P for interaction <0.10) between body weight change subgroups and physical activity during the initial 2-year period (Table 4). In the subgroup of patients who were physically active during the initial 2-year period (224 individuals, 34.4%), loosing ≥5% of body weight was associated with markedly significant reductions, by 80% and 79%, in risk for total CVEs and MACEs, respectively, and a marginally significant (P=0.07) risk reduction of 72% for cardiovascular death in relation to the subgroup that gained weight. Otherwise, in the subgroup that remained sedentary during the initial 2-year period (427 participants, 65.6%) there were no significant protective effects of weight loss for any of the cardiovascular outcomes. Physical activity per se was not significantly associated with lower risks of cardiovascular outcomes (HR, 0.76; 95% CI, 0.54 to 1.05; P=0.10 for total CVEs) (HR, 0.78; 95% CI, 0.54 to 1.13; P=0.19 for MACEs) (HR, 0.69; 95% CI, 0.44 to 1.09; P=0.11 for cardiovascular mortality), in fully-adjusted analyses.
- No other evidence was found for interactions of body weight changes with age, sex, baseline BMI, diabetes duration, the presence of microvascular and macrovascular complications, and glycemic control (all P for interaction values >0.30), indicating that the risks associated with body weight changes were similar between older and younger participants, men and women, and obese and non-obese participants, as well as in those with a shorter or longer diabetes duration, with or without complications or with poorer or better glycemic control.
RESULTS
- This long-term prospective cohort study with middle-aged to elderly individuals with long-standing type 2 diabetes demonstrated that ≥5% weight loss during the initial 2-year period of follow-up provided significant cardiovascular protection, particularly when this was achieved with concomitant regular physical activity. Otherwise, smaller weight losses did not appear to have any beneficial effect on cardiovascular disease prevention in relation to individuals who gained weight. Overall, these findings support that weight loss of ≥5%, coupled with encouraging regular physical activity, may be a therapeutic goal in the clinical management of overweight and obese individuals with type 2 diabetes to reduce the cardiovascular disease burden, regardless of age, diabetes duration or the absence or presence of complications.
- Fourteen observational cohort studies [2-15] have evaluated the effects of weight changes on cardiovascular and mortality outcomes in people with type 2 diabetes, as recently summarized in a systematic review [1]. Only two of these studies [6,10], like ours, demonstrated a protective association between greater weight loss over the initial 1 to 2 years of follow-up and adverse cardiovascular outcomes. In the first one, an observational post hoc analysis of the Action for Health in Diabetes (Look AHEAD) trial with 4,834 overweight/obese individuals with type 2 diabetes (mean duration, 5 years) who were followed up for 10 years, those who lost ≥10% of their body weight in the 1st year had significantly lower (by 21% to 24%) risks of cardiovascular outcomes than those who had stable weight or gained weight, whereas improvement in physical fitness was marginally associated with better outcomes [6]. In the second study, a cohort analysis from the Anglo-Danish-Dutch Study of Intensive Treatment in People with Screen-Detected Diabetes in Primary Care (ADDITION)-Cambridge trial with 725 adults with recently detected type 2 diabetes who were followed up for 10 years, those who lost ≥5% of their body weight in the 1st year had 48% lower risk of future incident cardiovascular disease than those with <2.5% weight change [10]. We advance this evidence base by showing that this potential protective cardiovascular effect of a ≥5% weight loss in the first 2 years of follow-up (34% to 48% lower risk) was also observed in individuals with longer diabetes duration (median 8 years) and at higher cardiovascular risk (30% with established cardiovascular disease and 52% with microvascular complications at baseline), and also by demonstrating that engaging in regular physical activity during the period of weight loss markedly improved this protective effect (up to 72%–80% lower risks). However, some previous studies either did not demonstrate any beneficial effect of weight loss on cardiovascular outcomes [4,7,8,14] or even showed a possible detrimental effect [9]. These disparities can probably be explained by differences in studies’ protocols and analyses, such as different population characteristics (older or younger people, shorter or longer diabetes durations, lower or higher baseline cardiovascular risks), different methods of assessing weight changes over different time periods and with different definitions of weight loss, discrepancies in follow-up lengths, different adjustments for confounding, and differences between intentional and non-intentional weight loss, which could lead to reverse causality, particularly with all-cause mortality in elderly people [16]. Furthermore, only one [23] of the three published randomized controlled trials [23-25] on intensive behavioral interventions aiming at weight loss in people with type 2 diabetes demonstrated beneficial cardiovascular effects. In a meta-analysis, the overall effect of the intensive intervention was null for cardiovascular outcomes [1]. Therefore, the cardiovascular risk reduction associated with weight loss is still subject to debate; and new studies aiming to identify the clinical characteristics of individuals who may benefit from weight loss and how much weight loss should be achieved for reducing cardiovascular risk remain important [1]. Because of this, it is necessary to explore possible interactions between weight loss and clinical characteristics, particularly with regular physical activity, which might mediate at least part of the beneficial effect of weight loss.
- Few previous studies have investigated changes in weight and physical activity over time and their interactions with cardiovascular outcomes [17], and no study has done so in individuals with diabetes. A cohort study with 3,307 individuals with coronary artery disease observed a reduction in cardiovascular risk in those with sustained regular physical activity, but not in those who lost weight [17]. In a cohort study with 173,246 Korean individuals with newly-detected type 2 diabetes [7], weight loss was not associated with better cardiovascular prognosis, but the survivors had a significantly higher proportion of individuals who regularly engaged in physical activity. However, a formal interaction analysis between body weight changes and physical activity was not performed [7]. We demonstrated interactions between weight loss and regular physical activity for cardiovascular outcomes, in which sustained physical activity during the initial 2-year period of weight change assessment markedly accentuated the protective effect of greater weight loss on cardiovascular outcomes, although performing physical activity per se was not associated with cardiovascular risk reduction (non-significant 22% to 31% lower risks). These findings are novel and support that weight loss of ≥5%, coupled with regular physical activity, may be a therapeutic goal in clinical management of overweight and obese individuals with type 2 diabetes to reduce the cardiovascular disease burden.
- We acknowledge some limitations of this study. First, this study involved a prospective observational cohort; hence, no causal relationships nor pathophysiological inferences can be made; instead, any such inferences are speculative. Moreover, as with any cohort study, residual confounding due to unmeasured or unknown factors cannot be ruled out. Second, we could not ascertain whether weight loss in our cohort was intentional or non-intentional. Non-intentional weight loss may be associated with a worse prognosis, particularly all-cause mortality, because of reverse causality with pathological weight loss associated with severe chronic conditions and cancer. However, patients with these conditions that limited life expectancy were excluded from cohort entry. Moreover, because most (85%) of the participants were obese or overweight, it is plausible that weight loss was mainly intentional, recommended by the attending health team. Third, this cohort enrolled mainly middleaged to elderly individuals with long-standing type 2 diabetes followed up at a tertiary care university hospital. Hence, our results might not be generalizable to younger individuals with recent-onset type 2 diabetes or the setting of primary care management. Nonetheless, the main strength of this study is its well-documented cohort of individuals with type 2 diabetes under standardized care who received regular outcome evaluations over a long-term 10-year follow-up. Further, we gathered information on physical activity habits at each clinic visit, which allowed us to investigate interactions between weight loss and physical activity.
- In conclusion, in a middle-aged type 2 diabetes cohort with a long-term follow-up, we demonstrated the beneficial cardiovascular effects of ≥5% weight loss during the first 2 years of follow-up. The benefit was particularly marked when this weight loss was reached with concurrent regular physical activity. As a whole, these findings support that weight loss of ≥5%, in addition to regular physical activity, may be a therapeutic target in clinical management of overweight and obese individuals with type 2 diabetes for primary or secondary cardiovascular disease prevention, even in high-risk individuals with long-standing diabetes.
DISCUSSION
-
Acknowledgements
- This study was supported by grants from Conselho Brasileiro de Desenvolvimento Científico e Tecnológico (CNPq) and Fundação Carlos Chagas Filho de Amparo à Pesquisa do Estado do Rio de Janeiro (FAPERJ).
-
CONFLICTS OF INTEREST
No potential conflict of interest relevant to this article was reported.
-
AUTHOR CONTRIBUTIONS
Conception or design: C.R.L.C., N.C.L., G.F.S. Acquisition, analysis, or interpretation of data: C.R.L.C., N.C.L., G.F.S. Drafting the work or revising: C.R.L.C., N.C.L., G.F.S. Final approval of the manuscript: C.R.L.C., N.C.L., G.F.S.
Article information
SUPPLEMENTARY MATERIAL

| Characteristic | All patients (n=651) | Weight loss ≥5% (n=125) | Weight loss 0% to <5% (n=180) | Weight gain (n=346) | P value | |
|---|---|---|---|---|---|---|
| Age, yr | 59.9±9.5 | 60.0±10.1 | 59.9±9.8 | 59.9±9.2 | 0.990 | |
| Male sex, % | 38.1 | 31.2 | 39.4 | 39.9 | 0.210 | |
| Body mass index, kg/m2 | 29.7±4.9 | 30.9±4.8a | 29.9±5.1 | 29.1±4.7 | 0.002 | |
| Abdominal circumference, cm | 102±11 | 105±11a | 102±12 | 101±11 | 0.003 | |
| Smoking, current/past, % | 43.8 | 40.0 | 39.4 | 47.4 | 0.141 | |
| Physical activity, % active | 34.4 | 35.2 | 31.8 | 35.4 | 0.710 | |
| Diabetes duration, yr | 8 (3–15) | 5 (2–12)b | 7 (3–12) | 10 (4–18) | <0.001 | |
| Chronic diabetic complication, % | ||||||
| Cerebrovascular disease | 8.4 | 8.8 | 8.3 | 8.4 | 0.990 | |
| Coronary artery disease | 14.9 | 11.2 | 15.6 | 15.9 | 0.432 | |
| Peripheral artery disease | 16.3 | 12.0 | 16.8 | 17.6 | 0.341 | |
| Retinopathy | 31.9 | 26.4 | 27.0 | 36.3 | 0.038 | |
| Nephropathy | 30.8 | 23.8 | 31.4 | 32.9 | 0.170 | |
| Peripheral neuropathy | 28.1 | 21.1 | 27.0 | 31.3 | 0.092 | |
| Diabetes treatment, % | ||||||
| Metformin | 88.0 | 84.8 | 88.3 | 89.0 | 0.461 | |
| Sulfonylureas | 42.5 | 46.4 | 50.6a | 37.0 | 0.007 | |
| Insulin | 47.5 | 32.8b | 38.9b | 57.2 | <0.001 | |
| Other medicationsc | 5.3 | 5.7 | 5.1 | 5.2 | 0.971 | |
| Dyslipidemia, % | 87.1 | 82.4 | 88.3 | 88.2 | 0.220 | |
| Statin use | 77.1 | 70.4 | 78.3 | 78.9 | 0.141 | |
| Arterial hypertension, % | 86.3 | 87.2 | 85.6 | 86.4 | 0.921 | |
| Number of antihypertensive drugs | 3 (1–3) | 2 (1–3) | 3 (1–4) | 3 (1–3) | 0.601 | |
| ACE inhibitors/AR blockers, % | 81.0 | 80.8 | 78.3 | 82.4 | 0.531 | |
| Diuretics, % | 61.4 | 62.4 | 60.6 | 61.6 | 0.951 | |
| Calcium channel blockers, % | 28.1 | 25.6 | 29.4 | 28.3 | 0.760 | |
| Beta-blockers, % | 45.5 | 42.4 | 48.3 | 45.1 | 0.580 | |
| Mean 2-year SBP, mm Hg | 140±18 | 139±19 | 141±18 | 141±17 | 0.711 | |
| Mean 2-year DBP, mm Hg | 79±9 | 79±9 | 79±9 | 79±9 | 0.990 | |
| Laboratory variables | ||||||
| Mean fasting glycemia, mmol/L | 8.2±2.8 | 7.6±2.8 | 8.4±2.9 | 8.2±2.8 | 0.028 | |
| Mean HbA1c, % | 7.7±1.4 | 7.2±1.4b | 7.7±1.4 | 7.9±1.4 | <0.001 | |
| Mean HbA1c, mmol/mol | 61±15.3 | 55±15.3 | 61±15.3 | 63±15.3 | ||
| Mean triacylglycerol, mmol/L | 1.9±1.4 | 1.6±0.9a | 2.0±1.3 | 1.9±1.6 | 0.004 | |
| Mean HDL-C, mmol/L | 1.1±0.3 | 1.1±0.3 | 1.2±0.3 | 1.1±0.2 | 0.941 | |
| Mean LDL-C, mmol/L | 2.7±0.8 | 2.7±0.9 | 2.7±0.7 | 2.7±0.8 | 0.920 | |
| eGFR, mL/min/1.73 m2 | 80±18 | 81±17 | 82±18 | 79±17 | 0.151 | |
| Albuminuria, mg/day | 13 (7–40) | 11 (7–24) | 15 (7–40) | 13 (7–50) | 0.350 | |
Values are expressed as mean±standard deviation, percentage, or median (interquartile range).
ACE, angiotensin-converting enzyme; AR, angiotensin II receptor; SBP, systolic blood pressure; DBP, diastolic blood pressure; HbA1c, glycated hemoglobin; HDL-C, high-density lipoprotein cholesterol; LDL-C, low-density lipoprotein cholesterol; eGFR, estimated glomerular filtration rate.
Post hoc comparisons among subgroups were performed against the reference subgroup (weight gain) with the Bonferroni correction for multiple comparisons
a P<0.01;
b P<0.001;
c Other antidiabetic medications in use were acarbose, dipeptidyl peptidase 4 inhibitors, and thiazolidinediones—no individual was using glucagon-like peptide-1 agonists or sodium-glucose cotransporter 2 inhibitors.
| Outcomes incidence | All patients (n=651) | Weight loss ≥5% (n=125) | Weight loss 0% to <5% (n=180) | Weight gain (n=346) | P value |
|---|---|---|---|---|---|
| Total cardiovascular events | 188 (31.6) | 19 (15.3)a | 53 (33.7) | 116 (37.0) | 0.001 |
| Major adverse cardiovascular events | 150 (24.3) | 17 (13.6)b | 43 (26.3) | 90 (27.4) | 0.023 |
| Cardiovascular mortality | 106 (16.5) | 13 (10.3) | 33 (19.2) | 60 (17.4) | 0.121 |
Model 1 was adjusted for age, sex, baseline body mass index, smoking status, diabetes duration, presence of macrovascular and microvascular complications, use of insulin and statins, and number of antihypertensive drugs. Model 2 was further adjusted for the potential mediating covariates between weight loss during the initial 2-year period and outcomes: regular physical activity, and mean systolic blood pressure, glycated hemoglobin, low-density lipoprotein cholesterol, and high-density lipoprotein cholesterol.
HR, hazard ratio; CI, confidence interval.
HRs were adjusted for age, sex, baseline body mass index, smoking status, diabetes duration, presence of macrovascular and microvascular complications, use of insulin and statins, number of antihypertensive drugs, and mean systolic blood pressure, glycated hemoglobin, low-density lipoprotein cholesterol, and high-density lipoprotein cholesterol during the 2-year period of weight change (model 2 in Table 2).
HR, hazard ratio; CI, confidence interval.
- 1. Strelitz J, Lawlor ER, Wu Y, Estlin A, Nandakumar G, Ahern AL, et al. Association between weight change and incidence of cardiovascular disease events and mortality among adults with type 2 diabetes: a systematic review of observational studies and behavioural intervention trials. Diabetologia 2022;65:424–39.ArticlePubMedPMCPDF
- 2. Gregg EW, Gerzoff RB, Thompson TJ, Williamson DF. Trying to lose weight, losing weight, and 9-year mortality in overweight U.S. adults with diabetes. Diabetes Care 2004;27:657–2.ArticlePubMedPDF
- 3. Aucott LS, Philip S, Avenell A, Afolabi E, Sattar N, Wild S, et al. Patterns of weight change after the diagnosis of type 2 diabetes in Scotland and their relationship with glycaemic control, mortality and cardiovascular outcomes: a retrospective cohort study. BMJ Open 2016;6:e010836.ArticlePubMedPMC
- 4. Bodegard J, Sundstrom J, Svennblad B, Ostgren CJ, Nilsson PM, Johansson G. Changes in body mass index following newly diagnosed type 2 diabetes and risk of cardiovascular mortality: a cohort study of 8486 primary-care patients. Diabetes Metab 2013;39:306–13.ArticlePubMed
- 5. Doehner W, Erdmann E, Cairns R, Clark AL, Dormandy JA, Ferrannini E, et al. Inverse relation of body weight and weight change with mortality and morbidity in patients with type 2 diabetes and cardiovascular co-morbidity: an analysis of the PROactive study population. Int J Cardiol 2012;162:20–6.ArticlePubMed
- 6. Look AHEAD Research Group; Gregg EW, Jakicic JM, Blackburn G, Bloomquist P, Bray GA, et al. Association of the magnitude of weight loss and changes in physical fitness with long-term cardiovascular disease outcomes in overweight or obese people with type 2 diabetes: a post-hoc analysis of the Look AHEAD randomised clinical trial. Lancet Diabetes Endocrinol 2016;4:913–21.ArticlePubMedPMC
- 7. Kim MK, Han K, Koh ES, Kim ES, Lee MK, Nam GE, et al. Weight change and mortality and cardiovascular outcomes in patients with new-onset diabetes mellitus: a nationwide cohort study. Cardiovasc Diabetol 2019;18:36.ArticlePubMedPMCPDF
- 8. Køster-Rasmussen R, Simonsen MK, Siersma V, Henriksen JE, Heitmann BL, de Fine Olivarius N. Intentional weight loss and longevity in overweight patients with type 2 diabetes: a population-based cohort study. PLoS One 2016;11:e0146889.ArticlePubMedPMC
- 9. Nunes AP, Iglay K, Radican L, Engel SS, Yang J, Doherty MC, et al. Hypoglycaemia seriousness and weight gain as determinants of cardiovascular disease outcomes among sulfonylurea users. Diabetes Obes Metab 2017;19:1425–35.ArticlePubMedPDF
- 10. Strelitz J, Ahern AL, Long GH, Hare MJ, Irving G, Boothby CE, et al. Moderate weight change following diabetes diagnosis and 10 year incidence of cardiovascular disease and mortality. Diabetologia 2019;62:1391–402.ArticlePubMedPMCPDF
- 11. Yeboah P, Hsu FC, Bertoni AG, Yeboah J. Body mass index, change in weight, body weight variability and outcomes in type 2 diabetes mellitus (from the ACCORD Trial). Am J Cardiol 2019;123:576–81.ArticlePubMed
- 12. Hanson RL, Jacobsson LT, McCance DR, Narayan KM, Pettitt DJ, Bennett PH, et al. Weight fluctuation, mortality and vascular disease in Pima Indians. Int J Obes Relat Metab Disord 1996;20:463–71.PubMed
- 13. Williamson DF, Thompson TJ, Thun M, Flanders D, Pamuk E, Byers T. Intentional weight loss and mortality among overweight individuals with diabetes. Diabetes Care 2000;23:1499–504.ArticlePubMedPDF
- 14. Cho E, Manson JE, Stampfer MJ, Solomon CG, Colditz GA, Speizer FE, et al. A prospective study of obesity and risk of coronary heart disease among diabetic women. Diabetes Care 2002;25:1142–8.ArticlePubMedPDF
- 15. Bangalore S, Fayyad R, DeMicco DA, Colhoun HM, Waters DD. Body weight variability and cardiovascular outcomes in patients with type 2 diabetes mellitus. Circ Cardiovasc Qual Outcomes 2018;11:e004724.ArticlePubMed
- 16. Beleigoli AM, Diniz MD, Boersma E, Silva JL, Lima-Costa MF, Ribeiro AL. The effects of weight and waist change on the risk of long-term mortality in older adults: the Bambui (Brazil) Cohort Study of Aging. J Nutr Health Aging 2017;21:861–6.ArticlePubMedPDF
- 17. Moholdt T, Lavie CJ, Nauman J. Sustained physical activity, not weight loss, associated with improved survival in coronary heart disease. J Am Coll Cardiol 2018;71:1094–101.ArticlePubMed
- 18. Cardoso CR, Leite NC, Ferreira MT, Salles GF. Prognostic importance of baseline and serial glycated hemoglobin levels in high-risk patients with type 2 diabetes: the Rio de Janeiro Type 2 Diabetes Cohort Study. Acta Diabetol 2015;52:21–9.ArticlePubMedPDF
- 19. Cardoso CR, Moran CB, Marinho FS, Ferreira MT, Salles GF. Increased aortic stiffness predicts future development and progression of peripheral neuropathy in patients with type 2 diabetes: the Rio de Janeiro Type 2 Diabetes Cohort Study. Diabetologia 2015;58:2161–8.ArticlePubMedPDF
- 20. Cardoso CR, Leite NC, Dib E, Salles GF. Predictors of development and progression of retinopathy in patients with type 2 diabetes: importance of blood pressure parameters. Sci Rep 2017;7:4867.ArticlePubMedPMCPDF
- 21. Cardoso CR, Leite NC, Salles GC, Ferreira MT, Salles GF. Aortic stiffness and ambulatory blood pressure as predictors of diabetic kidney disease: a competing risks analysis from the Rio de Janeiro Type 2 Diabetes Cohort Study. Diabetologia 2018;61:455–65.ArticlePubMedPDF
- 22. Nelson ME, Rejeski WJ, Blair SN, Duncan PW, Judge JO, King AC, et al. Physical activity and public health in older adults: recommendation from the American College of Sports Medicine and the American Heart Association. Circulation 2007;116:1094–105.ArticlePubMed
- 23. Sone H, Tanaka S, Iimuro S, Tanaka S, Oida K, Yamasaki Y, et al. Long-term lifestyle intervention lowers the incidence of stroke in Japanese patients with type 2 diabetes: a nationwide multicentre randomised controlled trial (the Japan Diabetes Complications Study). Diabetologia 2010;53:419–28.ArticlePubMedPMC
- 24. Hanefeld M, Fischer S, Schmechel H, Rothe G, Schulze J, Dude H, et al. Diabetes intervention study. Multi-intervention trial in newly diagnosed NIDDM. Diabetes Care 1991;14:308–17.ArticlePubMedPDF
- 25. Look AHEAD Research Group; Wing RR, Bolin P, Brancati FL, Bray GA, Clark JM, et al. Cardiovascular effects of intensive lifestyle intervention in type 2 diabetes. N Engl J Med 2013;369:145–54.ArticlePubMedPMC
References
Figure & Data
References
Citations
- Weight change in patients with new‐onset type 2 diabetes mellitus and its association with remission: Comprehensive real‐world data
Jinyoung Kim, Bongseong Kim, Mee Kyoung Kim, Ki‐Hyun Baek, Ki‐Ho Song, Kyungdo Han, Hyuk‐Sang Kwon
Diabetes, Obesity and Metabolism.2024; 26(2): 567. CrossRef - Cardiovascular Risk Reduction in Type 2 Diabetes: Further Insights into the Power of Weight Loss and Exercise
Seung-Hwan Lee
Endocrinology and Metabolism.2023; 38(3): 302. CrossRef - Effects of body weight variability on risks of macro- and microvascular outcomes in individuals with type 2 diabetes: The Rio de Janeiro type 2 diabetes cohort
Claudia R.L. Cardoso, Nathalie C. Leite, Gil F. Salles
Diabetes Research and Clinical Practice.2023; 205: 110992. CrossRef
 PubReader
 ePub Link
 Cite
Cite