Articles
- Page Path
- HOME > Endocrinol Metab > Volume 38(3); 2023 > Article
-
Original ArticleDiabetes, obesity and metabolism Association between Serum Amyloid A Levels and Type 2 Diabetes Mellitus: A Systematic Review and Meta-Analysis
 Keypoint
A meta-analysis of 21 studies found a significant association between higher serum amyloid A (SAA) levels and type 2 diabetes mellitus (T2DM). T2DM patients had notably higher SAA levels than healthy groups, with variation influenced by participants’ mean age and geographic location. SAA levels in T2DM patients also positively correlated with body mass index, triglycerides, fasting plasma glucose, hemoglobin A1c, insulin resistance, C-reactive protein, and interleukin-6, but negatively correlated with high-density lipoprotein cholesterol. The study suggests that elevated SAA levels could be linked to T2DM, lipid metabolism imbalance, and inflammation. -
Ting Liu1,2,3*, Meng Li4*, Chunying Cui1,2,3, Jielin Zhou5

-
Endocrinology and Metabolism 2023;38(3):315-327.
DOI: https://doi.org/10.3803/EnM.2023.1621
Published online: June 7, 2023
1Department of Pharmaceutics, School of Pharmaceutical Sciences, Capital Medical University, Beijing, China
2Beijing Area Major Laboratory of Peptide and Small Molecular Drugs, Beijing, China
3Engineering Research Center of Endogenous Prophylactic of Ministry of Education of China, Beijing, China
4Institute of Pharmacology and Toxicology of Academy of Military Medical Sciences, Beijing, China
5Department of Oncology, Anhui Provincial Cancer Hospital, The First Affiliated Hospital of the University of Science and Technology of China, Hefei, China
- Corresponding authors: Chunying Cui. Department of Pharmaceutics, School of Pharmaceutical Sciences, Capital Medical University, No. 10 You’anmenwai Xitoutiao, Fengtai District, Beijing 100069, China Tel: +86-10-83911532, Fax: +86-10-83911533, E-mail: ccy@ccmu.edu.cn
- Jielin Zhou. Department of Oncology, Anhui Provincial Cancer Hospital, The First Affiliated Hospital of the University of Science and Technology of China, No. 107 Huanhu East Road, Hefei 230031, China Tel: +86-551-65327618, Fax: +86-551-65320572, E-mail: zhoujielin12@163.com
- *These authors contributed equally to this work.
Copyright © 2023 Korean Endocrine Society
This is an Open Access article distributed under the terms of the Creative Commons Attribution Non-Commercial License (http://creativecommons.org/licenses/by-nc/4.0/) which permits unrestricted non-commercial use, distribution, and reproduction in any medium, provided the original work is properly cited.
ABSTRACT
-
Background
- To date, consistent data have not been reported on the association between serum amyloid A (SAA) levels and type 2 diabetes mellitus (T2DM). The purpose of this study was to systematically summarize their relationship.
-
Methods
- Databases including PubMed, Cochrane Library, Embase, Web of Science, and MEDLINE were searched until August 2021. Cross-sectional and case-control studies were included.
-
Results
- Twenty-one studies with 1,780 cases and 2,070 controls were identified. SAA levels were significantly higher in T2DM patients than in healthy groups (standardized mean difference [SMD], 0.68; 95% confidence interval [CI], 0.39 to 0.98). A subgroup analysis showed that the mean age of participants and the continent that participants were from were related to differences in SAA levels between cases and controls. Furthermore, in T2DM patients, SAA levels were positively associated with body mass index (r=0.34; 95% CI, 0.03 to 0.66), triglycerides (r=0.12; 95% CI, 0.01 to 0.24), fasting plasma glucose (r=0.26; 95% CI, 0.07 to 0.45), hemoglobin A1c (r=0.24; 95% CI, 0.16 to 0.33), homeostasis model assessment for insulin resistance (r=0.22; 95% CI, 0.10 to 0.34), C-reactive protein (r=0.77; 95% CI, 0.62 to 0.91), and interleukin-6 (r=0.42; 95% CI, 0.31 to 0.54), but negatively linked with highdensity lipoprotein cholesterol (r=–0.23; 95% CI, –0.44 to –0.03).
-
Conclusion
- The meta-analysis suggests that high SAA levels may be associated with the presence of T2DM, as well as lipid metabolism homeostasis and the inflammatory response.
- Type 2 diabetes mellitus (T2DM) has become the most common chronic disease worldwide; the number of cases and the significance of T2DM both continue to rise as economic development and urbanization lead to changing lifestyles characterized by reduced physical activity and increased obesity [1]. Previous research has shown that T2DM increases the risk of many diseases, such as cardiovascular diseases, some cancers, and eye and kidney diseases [2]. In particular, lipid metabolism disorders are a common but severe complication of T2DM that could further lead to the development of atherosclerosis [3]. Extensive evidence has demonstrated that inflammation could play a vital role in the pathogenesis of T2DM [4,5]. Serum amyloid A (SAA) has been identified as a protein involved in acute-phase inflammation in humans and many mammals, and it has been extensively studied [6,7].
- SAA regularly acts as an allele cluster on chromosome 11 in humans and is mainly synthesized in white adipose tissues and hepatocytes [7], and is an essential component of apolipoprotein and high-density lipoprotein (HDL) particles [8]. Increasing evidence indicates that high SAA levels in vitro have a number of adverse effects, including mediating the binding of HDL to differentiated macrophages and endothelial cells [9] and impairing the capacity of HDL to promote cholesterol efflux from macrophages, which could potentially promote dyslipidemia and even atherosclerosis [10]. Free SAA in vitro also has been shown to induce expression of extracellular matrix-degrading metalloproteinases and promote chemotaxis and adhesion of both monocytes and T lymphocytes [11,12].
- Studies have documented that high levels of SAA are independently associated with a series of chronic diseases, including obesity, rheumatoid arthritis, coronary heart disease, and cancer [7,13-15]. However, consistent findings regarding the relationship between SAA levels and T2DM have not been published. The aim of this study was to synthesize a large number of reports about SAA levels and T2DM to further elucidate their relationship.
INTRODUCTION
- The present analysis was performed based on the Preferred Reporting Items for Systematic Reviews and Meta-Analyses guidelines and was registered on the PROSPERO registry for systematic reviews (registration number: CRD 42020203008).
- Data sources and searches
- We searched the following databases from inception up to August 2021 for studies reporting on relationships between SAA and T2DM: PubMed, Cochrane Library, Embase, Web of Science, and MEDLINE. The keywords consisted of “serum amyloid A” OR “SAA” OR “amyloid protein AA” OR “amyloid A protein-related serum component” OR “amyloid protein AA precursor” OR “serum A related protein” AND “type 2 diabetes” OR “type 2 diabetes mellitus” OR “T2DM” OR “Non-insulin dependent diabetes mellitus.” All search results were screened by title and abstract, and potentially relevant full text articles were retrieved and assessed. Reference lists were also searched for additional relevant publications.
- Inclusion and exclusion criteria
- Studies were selected for the meta-analysis according to whether they met the following criteria: (1) the study investigated the potential association between SAA levels and T2DM; (2) complete data were available on SAA concentrations in both patients and controls or the correlations of SAA with some factors; (3) the study was a cross-sectional or case-control study; and (4) the language of publication was English. If an article had been published more than one time, we only used the latest edition. Articles were excluded based on the following criteria: (1) review or commentary articles; (2) repeated publications or similar studies; (3) animal experiments rather than human research; and (4) studies with incomplete and/or unavailable data.
- Quality assessment
- The quality of studies was separately evaluated by two independent authors (T.L. and M.L.). The Newcastle-Ottawa Quality Assessment Scale was used to evaluate the quality of included observational studies [16]. Only those studies for which the majority of the questions were deemed satisfactory (i.e., with a score of 6 or higher) were categorized as being of high methodological quality.
- Data extraction and data conversion
- Two investigators (T.L. and J.Z.) filtered the abstracts and collected data independently. When divergences appeared, we strived to reach an agreement after panel discussion. The following characteristics of the selected articles are shown in Table 1: (1) publication details, including the first author and the publication year; (2) study design; (3) characteristics of the study population, such as sample size, age, sex, continent (country); (4) SAA detection method; (5) the SAA levels in cases and controls, or the correlations of SAA levels to body mass index (BMI), total cholesterol (TC), triglyceride (TG), high-density lipoprotein cholesterol (HDL-C), low-density lipoprotein cholesterol (LDL-C), fasting plasma glucose (FPG), hemoglobin A1c (HbA1c), homeostasis model assessment for insulin resistance (HOMA-IR), C-reactive protein (CRP), and interleukin-6 (IL-6) in patients with T2DM.
- Since SAA levels sometimes showed a skewed distribution, some studies reported the mean and standard deviation of SAA levels in the original data, while others reported the median and quartiles. Therefore, it was necessary to convert the original data into usable means and standard deviations prior to analysis. The interquartile ranges of SAA levels were converted to the mean and standard deviation in accordance with methods reported in the literature [17-20].
- Statistical methods
- All statistical analyses were carried out using Stata version 12.0 (StataCorp LLC, College Station, TX, USA). Standardized mean differences (SMDs) were used to explore SAA differences in SAA levels between T2DM and healthy control groups. Heterogeneity between studies was assessed with the I2 statistic (0%<I2 <50%, no heterogeneity; I2 >50%, large heterogeneity) [21]. If heterogeneity was significant (I2 >50%, P<0.05), a randomeffect model was adopted to pool the SMD values; otherwise, a fixed-effect model was used. Sensitivity analyses were performed to assess the stability of our results. In order to identify the sources of heterogeneity, subgroup and meta-regression analyses were performed by the sex, mean age, and BMI of participants; study design; SAA detection method; and the continents that participants were from.
- Using the pooled statistical values, the Spearman correlation coefficient (r) was utilized to assess the correlations of SAA levels to BMI, TC, TG, HDL-C, LDL-C, FPG, HbA1c, HOMA-IR, CRP, and IL-6 levels in patients with T2DM. The Egger and Begg tests were used to detect potential publication bias. A P value less than 0.05 was set as the threshold for statistical significance.
METHODS
- Characteristics of included studies
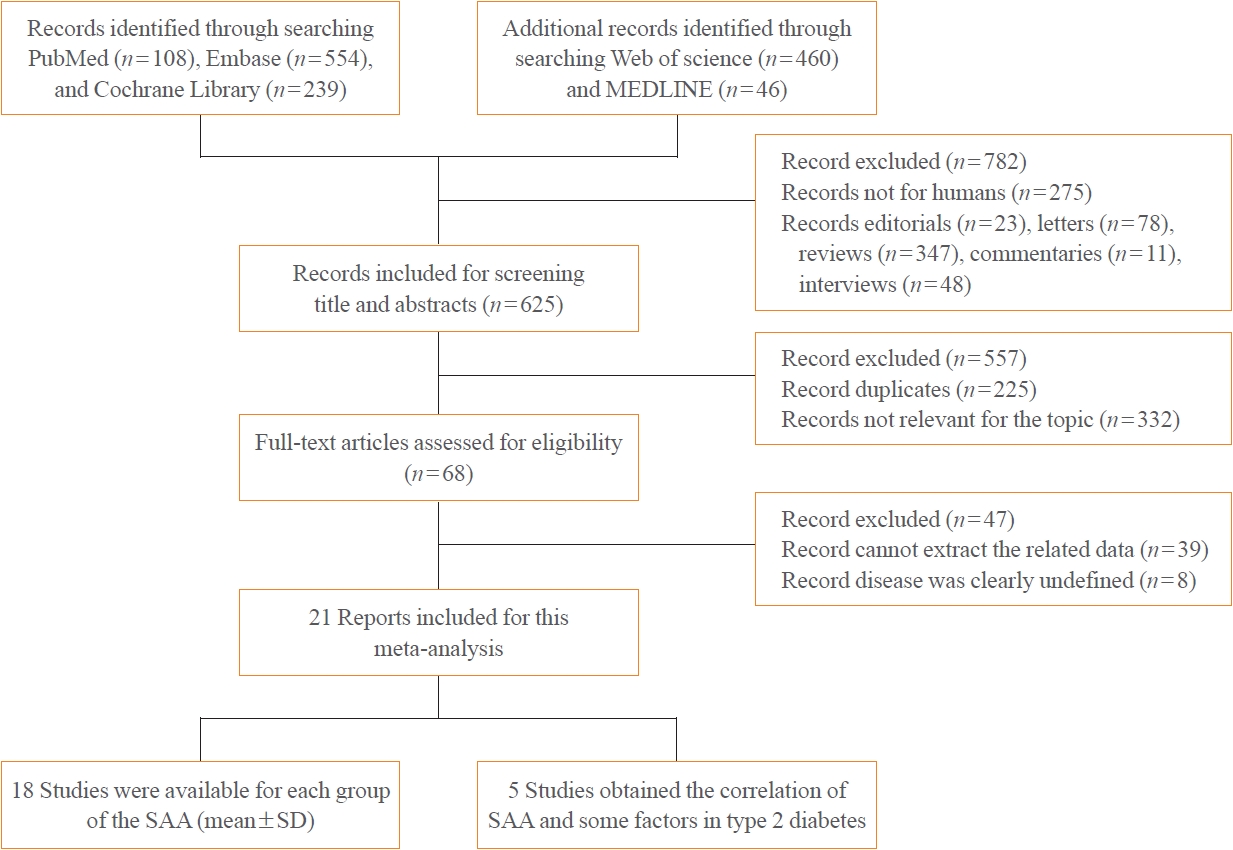
- A total of 1,407 articles were retrieved from PubMed, Cochrane Library, Embase, Web of Science, and MEDLINE, of which 782 articles were filtered out because they were editorials, letters, reviews, commentaries, interviews, or studies of non-human subjects. After carefully examining each article’s title, abstract, and full text, 587 studies were excluded due to being duplicates, having an irrelevant topic or incomplete data, or dealing with an undefined disease. Eventually, 21 articles with 1,780 patients and 2,070 healthy controls were included in this meta-analysis (Fig. 1). Of these, 18 studies contained data on SAA levels (mean± standard deviation) in cases and controls, while five studies reported the correlations of SAA levels with BMI, TC, TG, LDL-C, HDL-C, FPG, HbA1c, HOMA-IR, CRP, and IL-6 levels in T2DM.
- The basic features of the articles included in this meta-analysis are displayed in Table 1. The studies were published between 1994 and 2017. Sixteen studies indicated that they included both men and women, one study contained only men, two studies included only women, and two studies did not indicate participants’ sex. Five studies were conducted in China (Asia), one in Germany (Europe), two in the USA (North America), one in Sweden (Europe), two each in Ireland (Europe), Brazil (South America), and Japan (Asia), one each in Netherlands (Europe), Finland (Europe), Italy (Europe), Turkey (Asia), and Spain (Europe), and one in multiple countries, including Australia, New Zealand, and Finland (Oceania and Europe). Eleven cross-sectional and 10 case-control studies were included in the current meta-analysis. SAA levels were detected using enzyme-linked immunosorbent assays in 16 studies and immunonephelometry in four studies, while one study did not provide this information. Nine of the studies included in the meta-analysis were considered to be good quality [22-30], while 12 studies were categorized as poor quality [31-42].
- Meta-analyses of SAA and T2DM
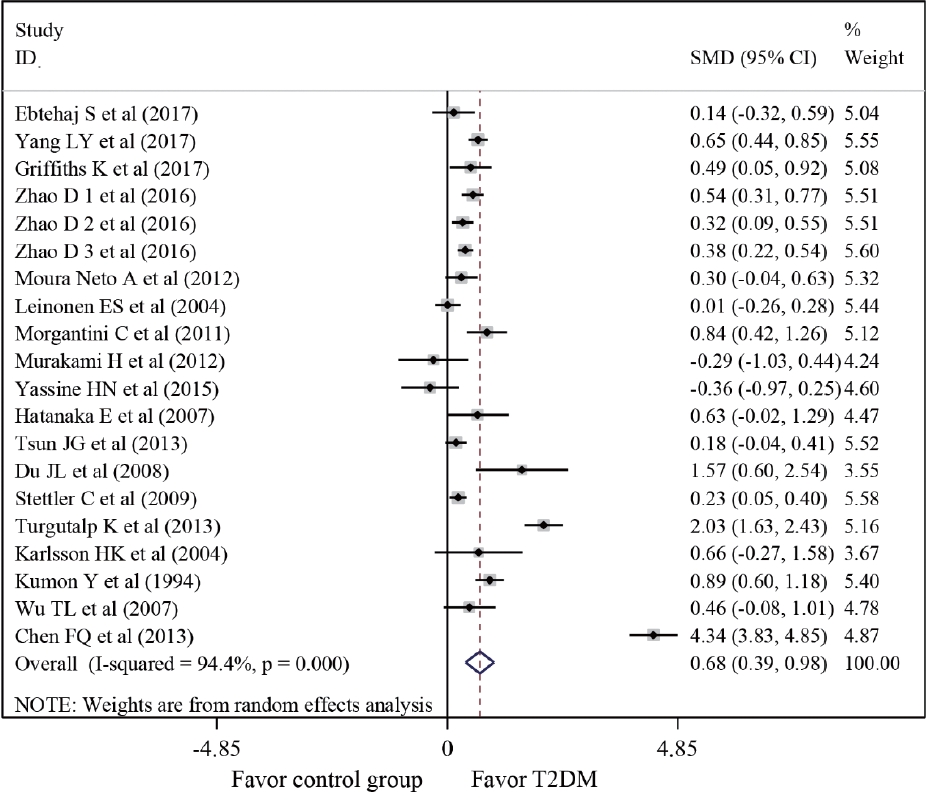
- A meta-analysis was conducted of differences in SAA levels between T2DM patients and healthy controls. The average SAA levels in T2DM patients were obviously higher than those in healthy individuals (SMD, 0.68; 95% confidence interval [CI], 0.39 to 0.98), although a forest plot visually conveyed significant heterogeneity (I2=94.4%, P<0.001) (Fig. 2). In order to identify the source of heterogeneity, subgroup analyses were conducted according to the sex, mean age, and BMI of participants; the study design, the SAA detection method, and the continents that participants were from (Table 2). The SAA levels of T2DM patient groups who had mean ages of 50 to 59 years or over 60 years were remarkably higher than those of healthy controls (SMD, 0.69; 95% CI, 0.24 to 1.15; and SMD, 0.50; 95% CI, 0.13 to 0.87, respectively). Markedly higher SAA levels in T2DM patients than in normal controls were found among participants from Europe (SMD, 0.33; 95% CI, 0.09 to 0.56), Asia (SMD, 1.04; 95% CI, 0.53 to 1.54), and South America (SMD, 0.37; 95% CI, 0.07 to 0.66). To further clarify the source of heterogeneity, meta-regression analysis was also performed. The results of meta-regression indicated that the sex, mean age and BMI of participants; study type; SAA detection method; and continents where participants were from could not explain the origin of heterogeneity (Table 3).
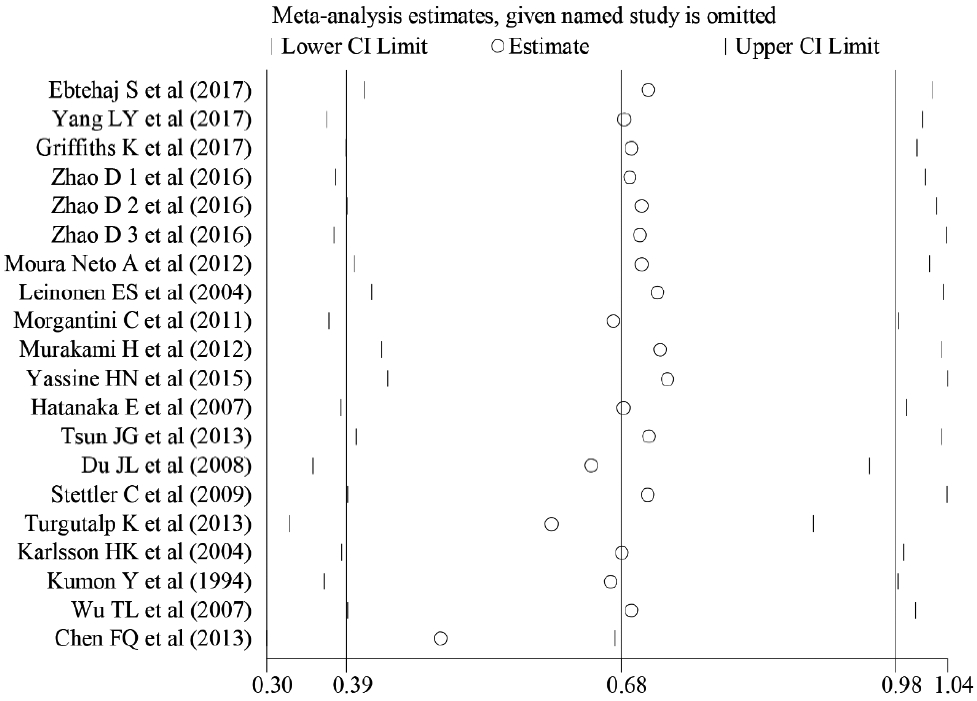
- Sensitivity analyses also showed that removing studies individually did not substantially change the associations (Fig. 3). Therefore, the overall magnitude of differences in SAA levels between T2DM patients and healthy controls was stable.
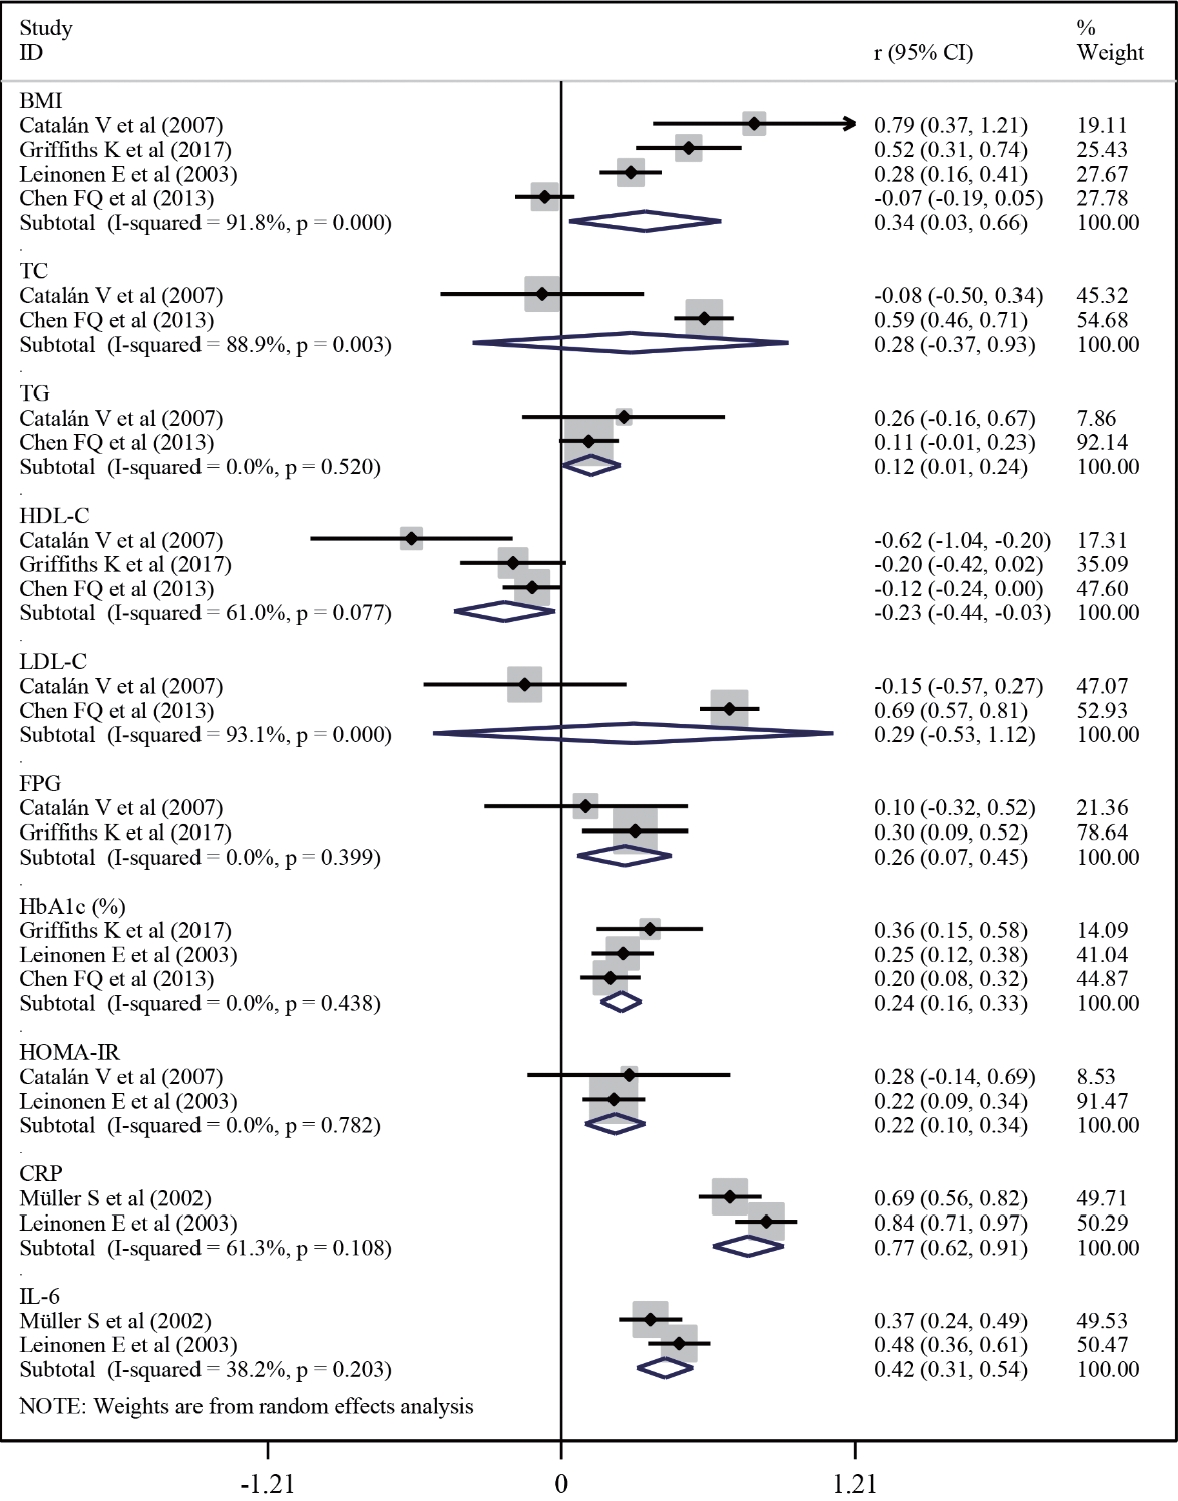
- Meta-analysis of correlations between SAA and several factors in T2DM
- Next, a meta-analysis of the correlations between SAA levels and cardiometabolic risk factors, glucose metabolic homeostasis indexes, and inflammation factors was conducted to further explore the associations of SAA levels with T2DM (Fig. 4). The result revealed that, in T2DM patients, SAA levels were positively linked with the levels of BMI (r=0.34; 95% CI, 0.03 to 0.66) and TG (r=0.12; 95% CI, 0.01 to 0.24), but negatively associated with HDL-C (r=–0.23; 95% CI, –0.44 to –0.03) levels. Furthermore, the pooled analysis suggested that, in T2DM patients, SAA levels were positively associated with FPG (r=0.26; 95% CI, 0.07 to 0.45), HbA1c (r=0.24; 95% CI, 0.16 to 0.33), HOMA-IR (r=0.22; 95% CI, 0.10 to 0.34), CRP (r=0.77; 95% CI, 0.62 to 0.91), and IL-6 (r=0.42; 95% CI, 0.31 to 0.54) levels.
- Publication biases
- The Begg’s correlation test and the Egger’s regression test indicated no evidence of significant publication bias in these studies (all P>0.05) (Table 4).
RESULTS
- The findings of the present meta-analysis indicated that high SAA levels showed statistically significant associations with the presence of T2DM, which is consistent with the studies of Ebtehaj et al. [22], Yang et al. [23], and Griffiths et al. [24]. More importantly, our study found that SAA levels were positively correlated with BMI, TG, FPG, HbA1c, HOMA-IR, CRP, and IL-6 levels in T2DM patients, suggesting that measuring SAA may be beneficial for assessing impaired lipid metabolism homeostasis and the inflammatory response in patients with T2DM. These findings enhance our knowledge of the usefulness of SAA as a marker of inflammation and may also provide evidence of a mechanistic link between inflammation and lipid metabolism dysregulation in T2DM patients.
- SAA has been found to be expressed at high levels in vivo under conditions of decreased insulin sensitivity [43], which can activate the neutrophil nuclear factor κB, inhibitory factor, kinase β signaling pathway in the liver, skeletal muscle, and adipose tissue, inducing liver and systemic local insulin resistance [44,45]. Furthermore, long-term insulin resistance increases glycosylation end products that stimulate macrophages and monocytes to release more inflammatory factors, inducing a chronic low-grade inflammatory state in the body [44,45] and accelerating the progression of T2DM and its complications. In addition, animal evidence has demonstrated that the administration of recombinant A-SAA (the acute-phase isoform) in the adipocytes of mice resulted in the downregulation of genes that were critical for insulin sensitivity in the treated cells [46].
- We observed that the average SAA levels in T2DM patients were notably higher than those in healthy controls. However, subgroup analyses showed that this difference was associated with the mean age of participants and the continent that they were from, with particularly strong relationships in studies with a mean age of more than 50 years and those from Europe, Asia, or South America. A previous study showed that age was tightly correlated with obesity and T2DM [47,48], and that SAA was associated with obesity [13]. Moreover, obesity was reported to increase the risk of T2DM in numerous studies [49,50]. However, previous studies placed less emphasis on differences in SAA levels between T2DM cases and normal controls in different continents. We assumed that environmental, genetic, and lifestyle-related factors may be responsible for these differences. However, a meta-regression model indicated that the source of heterogeneity could not be explained by the sex, mean age, and BMI of participants; study type; SAA detection method; or the continents that participants were from.
- The meta-analysis of correlations found that SAA levels were positively linked with cardiometabolic risk factors (BMI and TG) in T2DM patients, which is in line with previous studies [13,51-53]. Elevated FPG is the most common indicator of T2DM, and HbA1c and insulin resistance are the two key indicators in the pathogenesis of T2DM. This meta-analysis found that SAA levels were positively associated with FPG, HbA1c, and insulin resistance, indicating a link between SAA levels and the occurrence and development of T2DM. These data further support the association of SAA levels with T2DM. SAA is an acute-phase response protein and can serve as a sensitive marker of the acute inflammatory response [15]. Its acute-phase isoform (A-SAA) is up-regulated up to 1,000-fold in response to inflammatory stimuli such as trauma, infection, injury, and stress [54], thereby stimulating the production of CRP, IL-6, and other inflammatory mediators [13], as exhibited in our study.
- This study has some strengths. First, the meta-analysis was conducted based on a comprehensive search of the literature and addressed concerns about professionally determined SAA levels and T2DM. Second, the sensitivity analysis revealed that excluding any study did not affect the pooled effect of differences in SAA levels between T2DM patients and healthy controls, suggesting that our results are robust. Third, considering some potential confounding factors, the meta-analysis was stratified by age, sex, BMI, and other variables, which could increase the stability and accuracy of the results. Fourth, the findings of a systematic review and meta-analysis using secondary data are valuable and can provide new directions for future studies. Direct measurements of SAA will be necessary to demonstrate whether it may be of pathological significance in T2DM.
- Nonetheless, this article is also subject to some unavoidable limitations. Foremost, correlation does not mean causation in terms of T2DM. Second, the large amount of heterogeneity was a weakness of the present study, although it could be explained by various subgroup analyses. Therefore, caution in interpreting these results is necessary for research focusing on these aspects. Third, a small number of participants may experience worsened symptoms of T2DM, and these outliers are not well represented in sample means. Fourth, participants’ age, sex, and BMI were inconsistent in the reported articles. These factors could not be adjusted to calculate the pooled effect due to the limited data. Finally, the specific mechanism underlying the relationship between SAA levels and T2DM must be validated through animal experiments in the future.
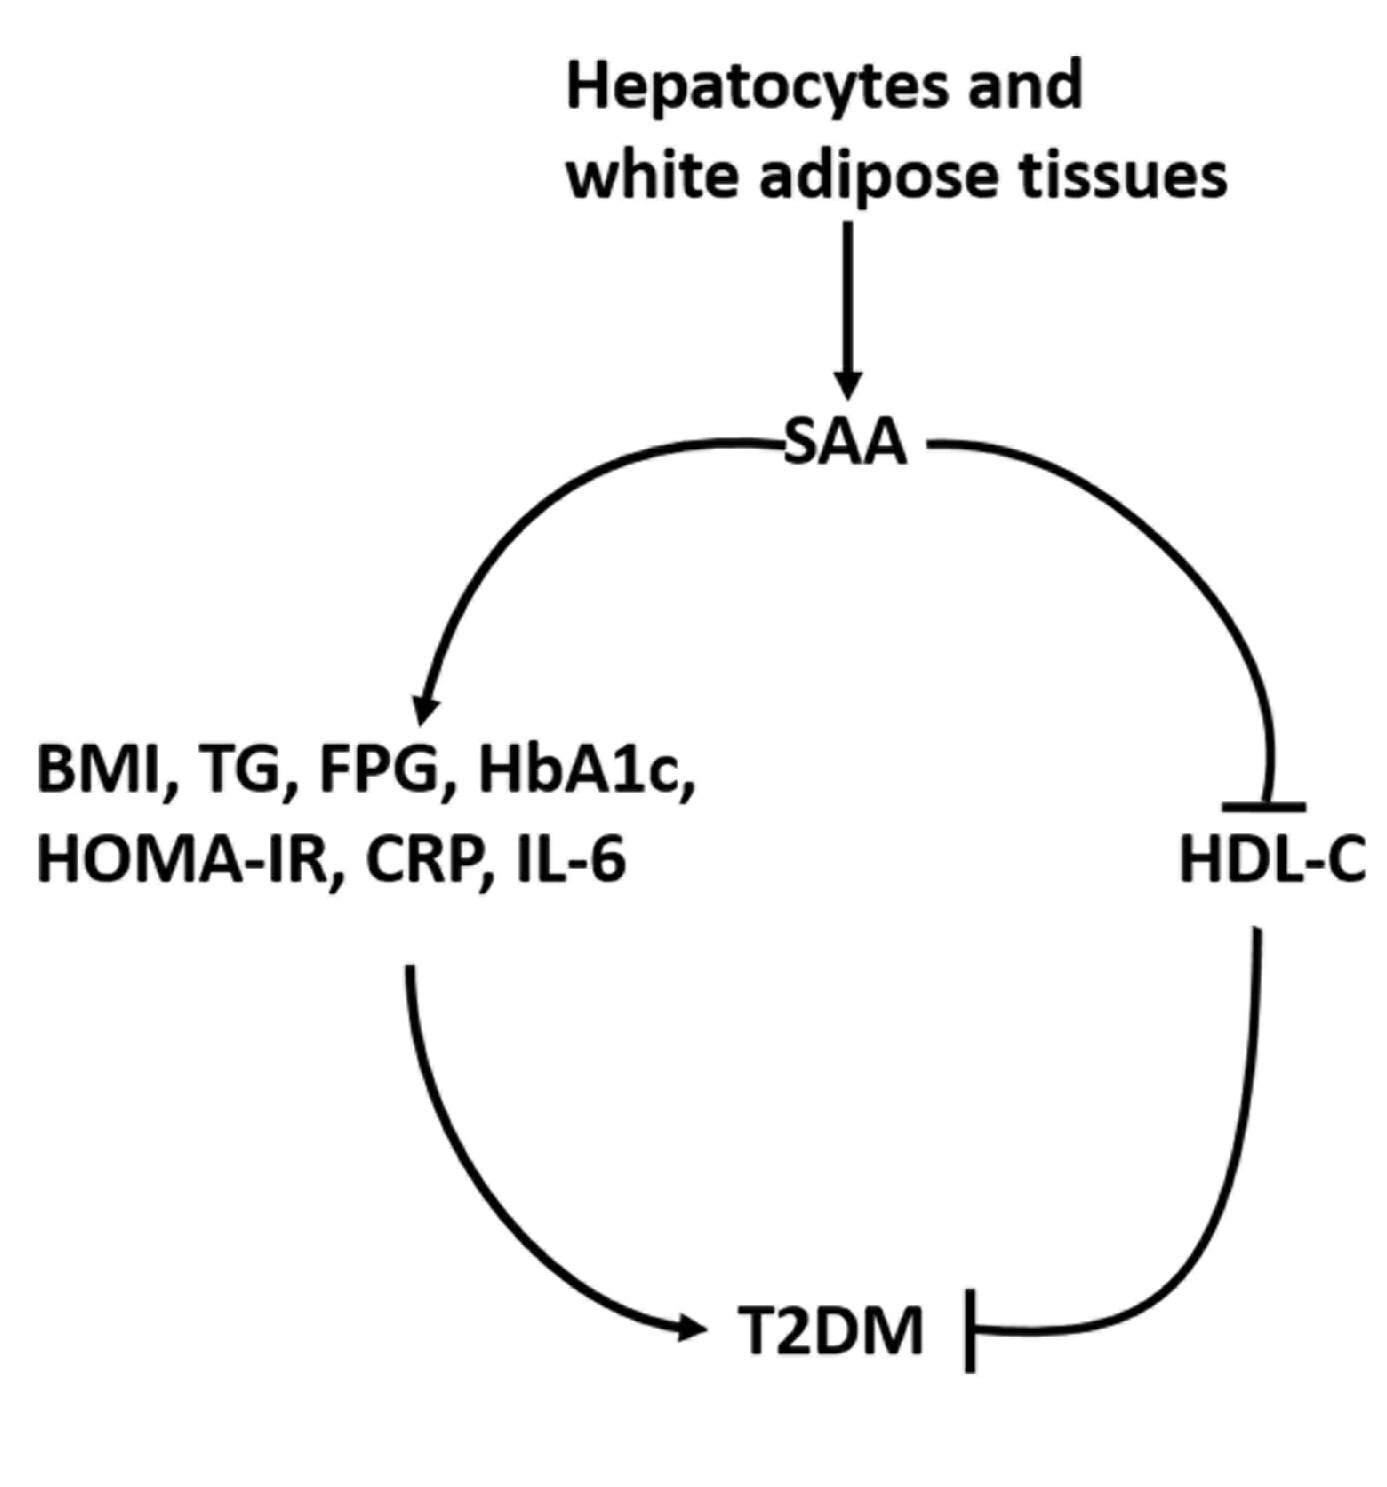
- In summary, high SAA levels were found to show statistically significant associations with the presence of T2DM. Furthermore, these findings demonstrate that SAA may have an impact on the development of T2DM by elevating the levels of BMI, TG, FPG, HbA1c, HOMA-IR, CRP, and IL-6, or by decreasing HDL-C levels. However, firm confirmation of the role played by SAA in T2DM will require direct testing in both transgenic and SAA-deficient animal models.
DISCUSSION
-
CONFLICTS OF INTEREST
No potential conflict of interest relevant to this article was reported.
-
AUTHOR CONTRIBUTIONS
Conception or design: T.L., J.Z. Acquisition, analysis, or interpretation of data: T.L., M.L. Drafting the work or revising: C.C., J.Z. Final approval of the manuscript: T.L., M.L., C.C., J.Z.
Article information


| Study | Sex | Age (mean) | Continent (country) | Group (n; SAA level mean±SD/ median value [IQR]) | BMI in T2DM patients (mean±SD), kg/m2 | Correlation of SAA with other factors in T2DM patients | Study type | Method | Quality assessment |
|---|---|---|---|---|---|---|---|---|---|
| Ebtehaj et al. (2017) [22] | 27 Men and 49 women | 43–70 (59) | Europe (Netherlands) | Case (40; 1.71 [1.25–2.48] mg/L) | 28.9±4.9 | NA | Cross-sectional | ELISA | ****** |
| Control (36; 1.58 [0.82–2.18] mg/L) | |||||||||
| Yang et al. (2017) [23] | 125 Men and 261 women | 44–63 (54) | Asia (China) | Case (185; 892 [537–1,129] μg/L) | 26.8±4.0 | NA | Case-control | NA | ****** |
| Control (201; 657 [462–831] μg/L) | |||||||||
| Griffiths et al. (2017) [24] | 84 Women | 28–49 (37) | Europe (Ireland) | Case (42; 13 [8–29] μg/L) | 35.88±7.72 | SAA and BMI, FPG, HbA1c, HDL-C (r=0.48, 0.294, 0.348, –0.197) | Case-control | ELISA | ******* |
| Control (42; 6 [3–13] μg/L) | |||||||||
| Zhao et al. (2016) [25] | 299 Men and 299 women | 45–65 (54) | Asia (China) | Case (300; 928.5±326.8 μg/L) | 26.4±3.7 | NA | Case-control | ELISA | ****** |
| Control (298; 811.9±286.8 μg/L) | |||||||||
| Moura Neto et al. (2014) [26] | 52 Men and 88 women | 50–63 (57) | South America (Brazil) | Case (70; 14.68 [5.92–26.04] μg/mL) | 30.0±6.44 | NA | Cross-sectional | ELISA | ******* |
| Control (70; 10.72 [3.67–19.11] μg/mL) | |||||||||
| Leinonen et al. (2004) [31] | 144 Men and 102 women | 52–67 (60) | Europe (Finland) | Case (168; 23 [4.8–2,082] μg/mL) | 30.4±5.4 | NA | Cross-sectional | ELISA | **** |
| Control (78; 19 [5.1–153] μg/mL) | |||||||||
| Morgantini et al. (2011) [32] | 22 Men and 28 women | 52–74 (62) | Europe (Italy) | Case (26; 48.2±35.1 μg/dL) | 34.0±8.0 | NA | Cross-sectional | ELISA | ***** |
| Control (24; 22.7±1.5 μg/dL) | |||||||||
| Murakami et al. (2013) [33] | 25 Men and 20 women | 30–73 (54) | Asia (Japan) | Case (36; 2.69±1.75 μg/mL) | NA | NA | Cross-sectional | ELISA | **** |
| Control (9; 3.22±2.05 μg/mL) | |||||||||
| Yassine et al. (2015) [34] | 76 Men and 84 women | 36–69 (53) | North America (USA) | Case (91; 21.2 [9.9–38.6] ng/mL) | 33.9±8.4 | NA | Cross-sectional | ELISA | ***** |
| Control (69; 28.7 [17.3–44.5] ng/mL) | |||||||||
| Hatanaka et al. (2007) [27] | 17 Men and 21 women | 43–75 (60) | South America (Brazil) | Case (18; 3,443.4±5,036.0 pg/mL) | 26.5±3.5 | NA | Case-control | ELISA | ****** |
| Control (20; 1,179±1,235.2 pg/mL) | |||||||||
| Tsun et al. (2013) [35] | 90 Men and 295 women | 38–59 (47) | Asia (China) | Case (110; 115.6 [66.1–151.1] ng/mL) | 25.2±3.7 | NA | Cross-sectional | ELISA | ***** |
| Control (275; 106.5 [79.4–137.2] ng/mL) | |||||||||
| Du et al. (2008) [36] | 7 Men and 15 women | 60–72 (66) | Asia (China) | Case (10; 3.34±2.32 g/mL) | 26.5±1.83 | NA | Case-control | ELISA | ***** |
| Control (12; 0.95±0.41 g/mL) | |||||||||
| Stettler et al. (2009) [] | 553 Men and 158 women | 53–70 (61) | Europe (Ireland) | Case (159; 3.15 [2.05–4.9] mg/L) | 29.2±4.63 | NA | Cross-sectional | Immunonephelometry | ***** |
| Control (552; 2.65 [1.60–4.60] mg/L) | |||||||||
| Turgutalp et al. (2013) [38] | 74 Men and 72 women | 40–45 (42) | Asia (Turkey) | Case (62; 5.8±1.33 mg/mL) | NA | NA | Cross-sectional | Immunonephelometry | *** |
| Control (84; 3.8±1.33 mg/mL) | |||||||||
| Karlsson et al. (2004) [28] | 21 Men | 56–60 (58) | Europe (Sweden) | Case (10; 3.16±1.71 mg/mL) | 28.0±1.0 | NA | Case-control | Immunonephelometry | ****** |
| Control (11; 2.22±1.03 mg/mL) | |||||||||
| Kumon et al. (1994) [39] | 89 Men and 107 women | 46–74 (59) | Asia (Japan) | Case (105; 2.1±1.3 mg/L) | NA | NA | Case-control | ELISA | **** |
| Control (91; 1.2±0.5 mg/L) | |||||||||
| Wu et al. (2007) [40] | NA | NA | North America (USA) | Case (31; 5.25±7.9 mg/L) | NA | NA | Cross-sectional | ELISA | ***** |
| Control (23; 2.4±2.1 mg/L) | |||||||||
| Chen et al. (2013) [41] | NA | 42–58 (55) | Asia (China) | Case (112; 318.31±34.35 μg/L) | 26.3±3.7 | SAA and BMI, TG, HDL-C, LDL-C, TC, HbA1c, SBP, DBP (r=–0.069, 0.112, –0.120, 0.559, 0.527, 0.198, 0.615, 0.507) | Case-control | ELISA | **** |
| Control (86; 163.90±37.31 μg/L) | |||||||||
| Muller et al. (2002) [29] | 145 Men and 87 women | 60–71 (65) | Europe (Germany) | NA | 29.7±6.65 | SAA and IL-6, CRP (r=0.35, 0.6) | Case-control | Immunonephelometry | ****** |
| Leinonen et al. (2003) [42] | 163 Men and 76 women | 54–67 (61) | Oceania, Europe (Australia, New Zealand and Finland) | NA | 30.51±5.63 | SAA and BMI, WC, HbA1c, HOMA-IR, CRP, IL-6 (r=0.277, 0.347, 0.232, 0.307, 0.687, 0.449) | Cross-sectional | ELISA | ***** |
| Catalan et al. (2007) [30] | 25 Women | 33–46 (38) | Europe (Spain) | NA | 39.77±10.01 | SAA and BMI, FPG, insulin, HOMA-IR, TG, TC, LDL-C, HDL-C (r=0.66, 0.10, 0.40, 0.27, 0.25, –0.08, –0.15, –0.55) | Case-control | ELISA | ****** |
SAA, serum amyloid A; SD, standard deviation; IQR, interquartile range; BMI, body mass index; T2DM, type 2 diabetes mellitus; NA, not applicable; ELISA, enzyme-linked immune sorbent assay; FPG, fasting plasma glucose; HbA1c, hemoglobin A1c; HDL-C, high-density lipoprotein cholesterol; TG, triglyceride; LDL-C, low-density lipoprotein cholesterol; TC, total cholesterol; SBP, systolic blood pressure; DBP, diastolic blood pressure; IL-6, interleukin-6; CRP, C-reactive protein; WC, waist circumference; HOMA-IR, homeostasis model assessment for insulin resistance.
| Covariates | β | SE | T | P>| T | | 95% CI | Tau2 | I2 | Adjusted R2, %a |
|---|---|---|---|---|---|---|---|---|
| Sex | 0.12 | 0.37 | 0.33 | 0.74 | –0.65 to 0.90 | 1.00 | 94.65 | –5.21 |
| Mean age | –0.04 | 0.30 | –0.15 | 0.88 | –0.68 to 0.59 | 1.01 | 94.52 | –5.79 |
| BMI | –0.33 | 0.30 | –1.10 | 0.29 | –0.97 to 0.30 | 0.94 | 93.85 | 1.74 |
| Study design | –0.34 | 0.22 | –0.53 | 0.15 | –0.79 to 0.13 | 0.90 | 94.29 | 6.28 |
| SAA detection method | 0.24 | 0.48 | 0.49 | 0.63 | –0.78 to 1.25 | 1.00 | 94.65 | –4.52 |
| Continent | 0.22 | 0.22 | 0.97 | 0.35 | –0.25 to 0.68 | 0.96 | 94.36 | –0.37 |
SAA, serum amyloid A; T2DM, type 2 diabetes mellitus; BMI, body mass index; TC, total cholesterol; TG, triglyceride; HDL-C, high-density lipoprotein cholesterol; LDL-C, low-density lipoprotein cholesterol; FPG, fasting plasma glucose; HbA1c, glycosylated hemoglobin A1c; HOMA-IR, homeostasis model assessment for insulin resistance; CRP, C-reactive protein; IL-6, interleukin-6.
- 1. Shaw JE, Sicree RA, Zimmet PZ. Global estimates of the prevalence of diabetes for 2010 and 2030. Diabetes Res Clin Pract 2010;87:4–14.ArticlePubMed
- 2. Tseng KH. Standards of medical care in diabetes 2006: response to the American Diabetes Association. Diabetes Care 2006;29:2563–4.
- 3. Tomkin GH. Atherosclerosis, diabetes and lipoproteins. Expert Rev Cardiovasc Ther 2010;8:1015–29.ArticlePubMed
- 4. Karstoft K, Pedersen BK. Exercise and type 2 diabetes: focus on metabolism and inflammation. Immunol Cell Biol 2016;94:146–50.ArticlePubMedPDF
- 5. Halim M, Halim A. The effects of inflammation, aging and oxidative stress on the pathogenesis of diabetes mellitus (type 2 diabetes). Diabetes Metab Syndr 2019;13:1165–72.ArticlePubMed
- 6. Zhang Y, Zhang J, Sheng H, Li H, Wang R. Acute phase reactant serum amyloid A in inflammation and other diseases. Adv Clin Chem 2019;90:25–80.ArticlePubMed
- 7. Zhou J, Sheng J, Fan Y, Zhu X, Tao Q, He Y, et al. Association between serum amyloid A levels and cancers: a systematic review and meta-analysis. Postgrad Med J 2018;94:499–507.ArticlePubMedPDF
- 8. Malle E, Sodin-Semrl S, Kovacevic A. Serum amyloid A: an acute-phase protein involved in tumour pathogenesis. Cell Mol Life Sci 2009;66:9–26.ArticlePubMedPMCPDF
- 9. Chen C, Chai H, Wang X, Jiang J, Jamaluddin MS, Liao D, et al. Soluble CD40 ligand induces endothelial dysfunction in human and porcine coronary artery endothelial cells. Blood 2008;112:3205–16.ArticlePubMedPMCPDF
- 10. Ronsein GE, Vaisar T. Inflammation, remodeling, and other factors affecting HDL cholesterol efflux. Curr Opin Lipidol 2017;28:52–9.ArticlePubMedPMC
- 11. Vallon R, Freuler F, Desta-Tsedu N, Robeva A, Dawson J, Wenner P, et al. Serum amyloid A (apoSAA) expression is up-regulated in rheumatoid arthritis and induces transcription of matrix metalloproteinases. J Immunol 2001;166:2801–7.ArticlePubMedPDF
- 12. Song C, Hsu K, Yamen E, Yan W, Fock J, Witting PK, et al. Serum amyloid A induction of cytokines in monocytes/macrophages and lymphocytes. Atherosclerosis 2009;207:374–83.ArticlePubMed
- 13. Zhao Y, He X, Shi X, Huang C, Liu J, Zhou S, et al. Association between serum amyloid A and obesity: a meta-analysis and systematic review. Inflamm Res 2010;59:323–34.ArticlePubMedPDF
- 14. Zhou J, Dai Y, Lin Y, Chen K. Association between serum amyloid A and rheumatoid arthritis: a systematic review and meta-analysis. Semin Arthritis Rheum 2022;52:151943.ArticlePubMed
- 15. Zhou J, Lu Y, Wang S, Chen K. Association between serum amyloid A levels and coronary heart disease: a systematic review and meta-analysis of 26 studies. Inflamm Res 2020;69:331–45.ArticlePubMedPDF
- 16. Stang A. Critical evaluation of the Newcastle-Ottawa scale for the assessment of the quality of nonrandomized studies in meta-analyses. Eur J Epidemiol 2010;25:603–5.ArticlePubMedPDF
- 17. Johnson BD, Kip KE, Marroquin OC, Ridker PM, Kelsey SF, Shaw LJ, et al. Serum amyloid A as a predictor of coronary artery disease and cardiovascular outcome in women: the National Heart, Lung, and Blood Institute-Sponsored Women’s Ischemia Syndrome Evaluation (WISE). Circulation 2004;109:726–32.ArticlePubMed
- 18. Liu T, Li G, Li L, Korantzopoulos P. Association between C-reactive protein and recurrence of atrial fibrillation after successful electrical cardioversion: a meta-analysis. J Am Coll Cardiol 2007;49:1642–8.PubMed
- 19. Liu T, Li L, Korantzopoulos P, Goudevenos JA, Li G. Meta-analysis of association between C-reactive protein and immediate success of electrical cardioversion in persistent atrial fibrillation. Am J Cardiol 2008;101:1749–52.ArticlePubMed
- 20. Hozo SP, Djulbegovic B, Hozo I. Estimating the mean and variance from the median, range, and the size of a sample. BMC Med Res Methodol 2005;5:13.ArticlePubMedPMCPDF
- 21. Zintzaras E, Ioannidis JP. Heterogeneity testing in meta-analysis of genome searches. Genet Epidemiol 2005;28:123–37.ArticlePubMed
- 22. Ebtehaj S, Gruppen EG, Parvizi M, Tietge UJ, Dullaart RP. The anti-inflammatory function of HDL is impaired in type 2 diabetes: role of hyperglycemia, paraoxonase-1 and low grade inflammation. Cardiovasc Diabetol 2017;16:132.ArticlePubMedPMCPDF
- 23. Yang LY, Yu CG, Wang XH, Yuan SS, Zhang LJ, Lang JN, et al. Angiopoietin-like protein 4 is a high-density lipoprotein (HDL) component for HDL metabolism and function in nondiabetic participants and type-2 diabetic patients. J Am Heart Assoc 2017;6:e005973.ArticlePubMedPMC
- 24. Griffiths K, Pazderska A, Ahmed M, McGowan A, Maxwell AP, McEneny J, et al. Type 2 diabetes in young females results in increased serum amyloid A and changes to features of high density lipoproteins in both HDL2 and HDL3. J Diabetes Res 2017;2017:1314864.ArticlePubMedPMCPDF
- 25. Zhao D, Yang LY, Wang XH, Yuan SS, Yu CG, Wang ZW, et al. Different relationship between ANGPTL3 and HDL components in female non-diabetic subjects and type-2 diabetic patients. Cardiovasc Diabetol 2016;15:132.ArticlePubMedPMCPDF
- 26. Moura Neto A, Parisi MC, Tambascia MA, Pavin EJ, Alegre SM, Zantut-Wittmann DE. Relationship of thyroid hormone levels and cardiovascular events in patients with type 2 diabetes. Endocrine 2014;45:84–91.ArticlePubMedPDF
- 27. Hatanaka E, Monteagudo PT, Marrocos MS, Campa A. Interaction between serum amyloid A and leukocytes: a possible role in the progression of vascular complications in diabetes. Immunol Lett 2007;108:160–6.ArticlePubMed
- 28. Karlsson HK, Tsuchida H, Lake S, Koistinen HA, Krook A. Relationship between serum amyloid A level and Tanis/SelS mRNA expression in skeletal muscle and adipose tissue from healthy and type 2 diabetic subjects. Diabetes 2004;53:1424–8.ArticlePubMedPDF
- 29. Muller S, Martin S, Koenig W, Hanifi-Moghaddam P, Rathmann W, Haastert B, et al. Impaired glucose tolerance is associated with increased serum concentrations of interleukin 6 and co-regulated acute-phase proteins but not TNF-alpha or its receptors. Diabetologia 2002;45:805–12.ArticlePubMedPDF
- 30. Catalan V, Gomez-Ambrosi J, Ramirez B, Rotellar F, Pastor C, Silva C, et al. Proinflammatory cytokines in obesity: impact of type 2 diabetes mellitus and gastric bypass. Obes Surg 2007;17:1464–74.ArticlePubMedPDF
- 31. Leinonen ES, Hiukka A, Hurt-Camejo E, Wiklund O, Sarna SS, Mattson Hulten L, et al. Low-grade inflammation, endothelial activation and carotid intima-media thickness in type 2 diabetes. J Intern Med 2004;256:119–27.ArticlePubMed
- 32. Morgantini C, Natali A, Boldrini B, Imaizumi S, Navab M, Fogelman AM, et al. Anti-inflammatory and antioxidant properties of HDLs are impaired in type 2 diabetes. Diabetes 2011;60:2617–23.ArticlePubMedPMCPDF
- 33. Murakami H, Tanabe J, Tamasawa N, Matsumura K, Yamashita M, Matsuki K, et al. Reduction of paraoxonase-1 activity may contribute the qualitative impairment of HDL particles in patients with type 2 diabetes. Diabetes Res Clin Pract 2013;99:30–8.ArticlePubMed
- 34. Yassine HN, Trenchevska O, He H, Borges CR, Nedelkov D, Mack W, et al. Serum amyloid A truncations in type 2 diabetes mellitus. PLoS One 2015;10:e0115320.ArticlePubMedPMC
- 35. Tsun JG, Shiu SW, Wong Y, Yung S, Chan TM, Tan KC. Impact of serum amyloid A on cellular cholesterol efflux to serum in type 2 diabetes mellitus. Atherosclerosis 2013;231:405–10.ArticlePubMed
- 36. Du JL, Sun CK, Lu B, Men LL, Yao JJ, An LJ, et al. Association of SelS mRNA expression in omental adipose tissue with Homa-IR and serum amyloid A in patients with type 2 diabetes mellitus. Chin Med J (Engl) 2008;121:1165–8.ArticlePubMed
- 37. Stettler C, Witt N, Tapp RJ, Thom S, Allemann S, Tillin T, et al. Serum amyloid A, C-reactive protein, and retinal microvascular changes in hypertensive diabetic and nondiabetic individuals: an Anglo-Scandinavian Cardiac Outcomes Trial (ASCOT) substudy. Diabetes Care 2009;32:1098–100.PubMedPMC
- 38. Turgutalp K, Ozhan O, Helvaci I, Ata A, Arican A, Boztepe B, et al. Serum levels of cancer biomarkers in diabetic and non-diabetic proteinuric patients: a preliminary study. Clin Chem Lab Med 2013;51:889–95.ArticlePubMed
- 39. Kumon Y, Suehiro T, Itahara T, Ikeda Y, Hashimoto K. Serum amyloid A protein in patients with non-insulin-dependent diabetes mellitus. Clin Biochem 1994;27:469–73.ArticlePubMed
- 40. Wu TL, Tsai IC, Chang PY, Tsao KC, Sun CF, Wu LL, et al. Establishment of an in-house ELISA and the reference range for serum amyloid A (SAA): complementarity between SAA and C-reactive protein as markers of inflammation. Clin Chim Acta 2007;376:72–6.PubMed
- 41. Chen FQ, Wang J, Liu XB, Ma XY, Zhang XB, Huang T, et al. Levels of inflammatory cytokines in type 2 diabetes patients with different urinary albumin excretion rates and their correlation with clinical variables. J Diabetes Res 2013;2013:138969.ArticlePubMedPMCPDF
- 42. Leinonen E, Hurt-Camejo E, Wiklund O, Hulten LM, Hiukka A, Taskinen MR. Insulin resistance and adiposity correlate with acute-phase reaction and soluble cell adhesion molecules in type 2 diabetes. Atherosclerosis 2003;166:387–94.ArticlePubMed
- 43. Poitou C, Viguerie N, Cancello R, De Matteis R, Cinti S, Stich V, et al. Serum amyloid A: production by human white adipocyte and regulation by obesity and nutrition. Diabetologia 2005;48:519–28.ArticlePubMedPDF
- 44. Engin A. The pathogenesis of obesity-associated adipose tissue inflammation. Adv Exp Med Biol 2017;960:221–45.ArticlePubMed
- 45. Permana PA, Menge C, Reaven PD. Macrophage-secreted factors induce adipocyte inflammation and insulin resistance. Biochem Biophys Res Commun 2006;341:507–14.ArticlePubMed
- 46. Scheja L, Heese B, Zitzer H, Michael MD, Siesky AM, Pospisil H, et al. Acute-phase serum amyloid A as a marker of insulin resistance in mice. Exp Diabetes Res 2008;2008:230837.ArticlePubMedPMCPDF
- 47. Fletcher B, Gulanick M, Lamendola C. Risk factors for type 2 diabetes mellitus. J Cardiovasc Nurs 2002;16:17–23.ArticlePubMed
- 48. Wright SM, Aronne LJ. Causes of obesity. Abdom Imaging 2012;37:730–2.ArticlePubMedPDF
- 49. Klil-Drori AJ, Azoulay L, Pollak MN. Cancer, obesity, diabetes, and antidiabetic drugs: is the fog clearing? Nat Rev Clin Oncol 2017;14:85–99.ArticlePubMedPDF
- 50. Niswender K. Diabetes and obesity: therapeutic targeting and risk reduction: a complex interplay. Diabetes Obes Metab 2010;12:267–87.ArticlePubMed
- 51. Du JL, Liu JF, Men LL, Yao JJ, Sun LP, Sun GH, et al. Effects of five-year intensive multifactorial intervention on the serum amyloid A and macroangiopathy in patients with shortduration type 2 diabetes mellitus. Chin Med J (Engl) 2009;122:2560–6.PubMed
- 52. Hu Y, Tong G, Xu W, Pan J, Ryan K, Yang R, et al. Anti-inflammatory effects of simvastatin on adipokines in type 2 diabetic patients with carotid atherosclerosis. Diab Vasc Dis Res 2009;6:262–8.ArticlePubMedPDF
- 53. Kluppelholz B, Thorand B, Koenig W, de Las Heras Gala T, Meisinger C, Huth C, et al. Association of subclinical inflammation with deterioration of glycaemia before the diagnosis of type 2 diabetes: the KORA S4/F4 study. Diabetologia 2015;58:2269–77.ArticlePubMedPDF
- 54. Urieli-Shoval S, Linke RP, Matzner Y. Expression and function of serum amyloid A, a major acute-phase protein, in normal and disease states. Curr Opin Hematol 2000;7:64–9.ArticlePubMed
References
Figure & Data
References
Citations
- Correlation between insulin resistance and the rate of neutrophils-lymphocytes, monocytes-lymphocytes, platelets-lymphocytes in type 2 diabetic patients
Yuanyuan Zhang, Huaizhen Liu
BMC Endocrine Disorders.2024;[Epub] CrossRef - Antioxidant and Anti-Inflammatory Functions of High-Density Lipoprotein in Type 1 and Type 2 Diabetes
Damien Denimal
Antioxidants.2023; 13(1): 57. CrossRef
 PubReader
 ePub Link
 Cite
Cite