Articles
- Page Path
- HOME > Endocrinol Metab > Volume 38(3); 2023 > Article
-
Original ArticleThyroid The Early Changes in Thyroid-Stimulating Immunoglobulin Bioassay over Anti-Thyroid Drug Treatment Could Predict Prognosis of Graves’ Disease
 Keypoint
A retrospective study assessed whether a baseline thyroid-stimulating immunoglobulin (TSI) bioassay or the response to anti-thyroid drug (ATD) treatment could predict the prognosis of Graves’ disease (GD). Among the 156 participants, the study found no significant difference in baseline TSI bioassay values between the groups experiencing relapse or persistence of GD and those in remission. However, early changes in the TSI bioassay, not thyrotropin-binding inhibitory immunoglobulin, were significantly associated with disease prognosis. Patients with relapsed or persistent GD showed a smaller TSI bioassay decrease in response to ATD, suggesting that TSI bioassay measurements at the beginning of treatment and during follow-up could help predict the prognosis of GD. -
Jin Yu1*
 , Han-Sang Baek1*, Chaiho Jeong2, Kwanhoon Jo3, Jeongmin Lee4, Jeonghoon Ha1, Min Hee Kim4, Jungmin Lee4, Dong-Jun Lim1
 -
Endocrinology and Metabolism 2023;38(3):338-346.
DOI: https://doi.org/10.3803/EnM.2023.1664
Published online: June 9, 2023
1Division of Endocrinology and Metabolism, Department of Internal Medicine, Seoul St. Mary’s Hospital, College of Medicine, The Catholic University of Korea, Seoul, Korea
2Division of Endocrinology and Metabolism, Department of Internal Medicine, Uijeongbu St. Mary’s Hospital, College of Medicine, The Catholic University of Korea, Uijeongbu, Korea
3Division of Endocrinology and Metabolism, Department of Internal Medicine, Incheon St. Mary’s Hospital, College of Medicine, The Catholic University of Korea, Incheon, Korea
4Division of Endocrinology and Metabolism, Department of Internal Medicine, Eunpyeong St. Mary’s Hospital, College of Medicine, The Catholic University of Korea, Seoul, Korea
- Corresponding author: Dong-Jun Lim. Division of Endocrinology and Metabolism, Department of Internal Medicine, Seoul St. Mary’s Hospital, College of Medicine, The Catholic University of Korea, 222 Banpo-daero, Seocho-gu, Seoul 06591, Korea Tel: +82-2-2258-6009, Fax: +82-2-599-3589, E-mail: ldj6026@catholic.ac.kr
- *These authors contributed equally to this work.
Copyright © 2023 Korean Endocrine Society
This is an Open Access article distributed under the terms of the Creative Commons Attribution Non-Commercial License (http://creativecommons.org/licenses/by-nc/4.0/) which permits unrestricted non-commercial use, distribution, and reproduction in any medium, provided the original work is properly cited.
ABSTRACT
-
Background
- To determine whether baseline thyroid-stimulating immunoglobulin (TSI) bioassay or its early response upon treatment with an anti-thyroid drug (ATD) can predict prognosis of Graves’ disease (GD) in real-world practice.
-
Methods
- This retrospective study enrolled GD patients who had previous ATD treatment with TSI bioassay checked at baseline and at follow-up from April 2010 to November 2019 in one referral hospital. The study population were divided into two groups: patients who experienced relapse or continued ATD (relapse/persistence), and patients who experienced no relapse after ATD discontinuation (remission). The slope and area under the curve at 1st year (AUC1yr) of thyroid-stimulating hormone receptor antibodies including TSI bioassay and thyrotropin-binding inhibitory immunoglobulin (TBII) were calculated as differences between baseline and second values divided by time duration (year).
-
Results
- Among enrolled 156 study subjects, 74 (47.4%) had relapse/persistence. Baseline TSI bioassay values did not show significant differences between the two groups. However, the relapse/persistence group showed less decremental TSI bioassay in response to ATD than the remission group (–84.7 [TSI slope, –198.2 to 8.2] vs. –120.1 [TSI slope, –204.4 to –45.9], P=0.026), whereas the TBII slope was not significantly different between the two groups. The relapse/persistence group showed higher AUC1yr of TSI bioassay and TBII in the 1st year during ATD treatment than the remission group (AUC1yr for TSI bioassay, P=0.0125; AUC1yr for TBII, P=0.001).
-
Conclusion
- Early changes in TSI bioassay can better predict prognosis of GD than TBII. Measurement of TSI bioassay at beginning and follow-up could help predict GD prognosis.
- Graves’ disease (GD) is an autoimmune disease and the most common cause of hyperthyroidism. It is caused by circulating autoantibodies that bind to and activate thyroid-stimulating hormone receptors (TSH-R) [1]. Diagnostic tools of GD include biochemical abnormalities of increased thyroid hormones, measurements of increased TSH-R antibody (TSH-R-Ab), and radioiodine scans [2,3].
- There are two assays to measure autoantibodies for evaluation of GD: thyrotropin-binding inhibitory immunoglobulin (TBII) assay and thyroid-stimulating immunoglobulin (TSI) bioassay. TBII is measured by immunoassays which measure the titer of a patient’s immunoglobulins that inhibit the binding of thyrotropin (TSH) to TSH-R. Therefore, this method measures all types of anti-TSH-R-Abs, including stimulating, blocking, and neutral antibodies [4]. The other method, TSI bioassay, could distinguish between stimulatory, neutral, and blocking autoantibodies by distinguishing their effects on cyclic adenosine monophosphate production in a cell line stably transfected with a receptor [5]. The TSI bioassay has a sensitivity of 96% and a specificity of 99% for the diagnosis of GD [6].
- Once diagnosed with GD, treatment options include the use of an anti-thyroid drug (ATD), surgery, and radioactive iodine (RAI) therapy [7,8]. ATDs have non-negligible benefits in that they do not destroy the thyroid structure. Thus, they could be used as a first line therapy for GD in most cases [1]. However, the recurrence rate after stopping ATD has been reported to be 30% to 70% [7,9,10]. In addition, ATD should be used for a long period due to a high rate of recurrence [11-15]. In this context, predicting recurrence of GD after ATD withdrawal is a very serious matter. Many studies have tried to find risk factors for recurrence and suggested that young age, men, smoking, goiter, presence of orbitopathy, and high thyroid hormone levels at diagnosis are associated with a higher risk of recurrence [9,13,16,17], although such findings remain controversial.
- Previous studies have indicated that high TSI bioassay measured just before ATD withdrawal could be a predictor of disease recurrence [9,17,18]. However, these studies were retrospective in nature with limited numbers of study subjects. One small study with a prospective setting has shown that TSI bioassay can predict the disease course and recurrence after ATD cessation more accurately than TBII [4]. However, that study used ATD for only 6 months and then observed outcome less than 18 months after ATD withdrawal, which were relatively short for complete evaluation of GD outcome. It could not reflect real-world practice.
- When to use a definite treatment rather than ATD has not been established yet. Especially, there have been few studies on the relationship between baseline TSI bioassay level or initial TSI bioassay change during ATD treatment and disease prognosis including recurrence. It can be assumed that more exposure to higher TSI bioassay would need longer duration of disease treatment with recurrence happening more common. However, research on this is insufficient. Thus, the objective of this study was to determine whether baseline TSI bioassay or its early response upon treatment with ATD could predict GD prognosis in real-world practice.
INTRODUCTION
- Study population
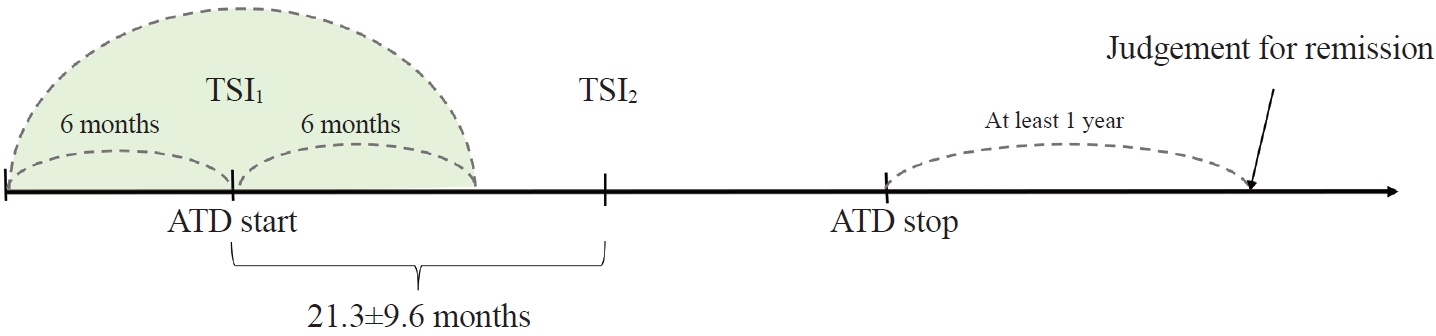
- Medical records of 671 consecutive patients with TSI bioassay measured at least twice from April 2010 to November 2019 were reviewed by professional medical staff. Patients who did not fit the study design were excluded. Among them, patients who have 1st TSI bioassay data over 6 months from ATD start were excluded (Fig. 1). Three patients whose final diagnosis was not GD, 81 patients with follow-up loss, 32 patients who underwent surgery or RAI, 107 patients with unclear drug start time, 26 patients with follow-up loss before 1 year after discontinuation of the drug, 194 patients whose TSI bioassay measurement period and ATD period did not match were excluded. Among 228 patients, those who had the time interval between the first TSI bioassay measurement (TSI1) and second TSI bioassay measurements (TSI2) of less than 6 months (n=50) and those with ATD discontinued after 6 months or more from the last TSI bioassay (n=18) were further excluded from the study. Patients who did not start ATD within 6 months after the first TSI bioassay measurement were also excluded (n=4). Finally, 156 patients were analyzed.
- Smoking history was recorded based on medical record. The presence of goiter was based on medical record as well as image recording such as thyroid scan or ultrasonography. The presence of Graves’ orbitopathy was based on physician’s medical records or documents from ophthalmology department.
- GD was diagnosed based on designated thyroid function test (TFT), which showed high free thyroxine (T4) and low TSH levels with increased TBII levels, thyroid scan with increased diffuse uptake, and clinical features such as diffuse goiter and orbitopathy. Priority of ATD was selected by the physician among carbimazole (CZ), methimazole (MZ), and propylthiouracil (PTU) according to the patient's clinical situation. Outpatient follow-up was regularly performed every 3 to 6 months. When the TFT level became euthyroid and clinical feature showed improvement, the drug was stopped after confirming that TBII or TSI bioassay was within normal range.
- Remission was defined as no experience of ATD re-start at least 1 year after stopping ATD. Relapse was defined as re-start of ATD after clinical decision of biochemical thyrotoxicosis and increased levels of TSH-R-Ab. Persistence was defined as no stop of the ATD during the study period. The study population was divided into two groups: a remission group (R group) and a relapse/persistent group (RP group).
- Laboratory test
- Free T4 and TSH levels were determined using a BECKMAN immunoradiometric assay (IRMA) kit (Immunotech, Prague, Czech Republic) and an ADIVA Centaur electrochemiluminescence immunoassay (ECLIA) kit (Siemens Healthcare Diagnostic Inc., Tarrytown, NY, USA). Normal ranges were as follows: TSH of 0.55 to 4.78 µIU/mL in ECLIA and 0.17 to 4.05 IU/mL in IRMA, free T4 of 0.89 to 1.76 ng/dL in ECLIA and of 0.89 to 1.79 ng/dL in IRMA (RRID: AB_2895179, AB_2895183 in ECLIA and AB_2895185, AB_2895187 in IRMA).
- Thyroid stimulating antibody (TRAb) was measured in two ways. First, a Elecsys/Cobas ECLIA kit (Roche Diagnostics, Mannheim, Germany), the third generation TBII assay, was used. This assay measures inhibition of binding of labeled monoclonal antibody clone M22 to TSH-R with a positive value greater than 1.75 IU/L (RRID: AB_2801453). Second, a TRAK Human radioimmunoassay (RIA) kit (BRAHMS Thermo Scientific, Henningsdorf, Germany), the second-generation TBII assay, was used. Detection was based on the ability of TRAb to prevent binding of labeled TSH to TSH-R with a positive value greater than 1.5 IU/L.
- The TSI bioassay titer was measured with a Thyretain TSI reporter bioassay (Diagnostic Hybrids Inc., Athens, OH, USA). This Thyretain kit is based on Chinese hamster ovary cells (CHO) transfected with chimeric TSH-R, which has amino acids 262-335 substituted with 73 amino acids from rat luteinizing hormone (LH) receptor (Mc4) [19,20]. Mc4 was designed to limit the effect of thyroid-blocking immunoglobulins that could exist coincidentally with TSI in up to 25% of patients with GD, which could interfere with TSI measurements. Results of the TSI bioassay are reported as specimen-to-reference ratio percentages (SRR%) calculated as follows: SRR%=(mean TSI specimen/mean TSI reference)×100. A specimen was considered positive if SRR was ≥140% [19].
- Definition of slope and area under the curve
- In this study, TSI bioassay and TBII were measured twice during the study period. The slope indicates the degree of change in the measured value. The slope was calculated as follows:
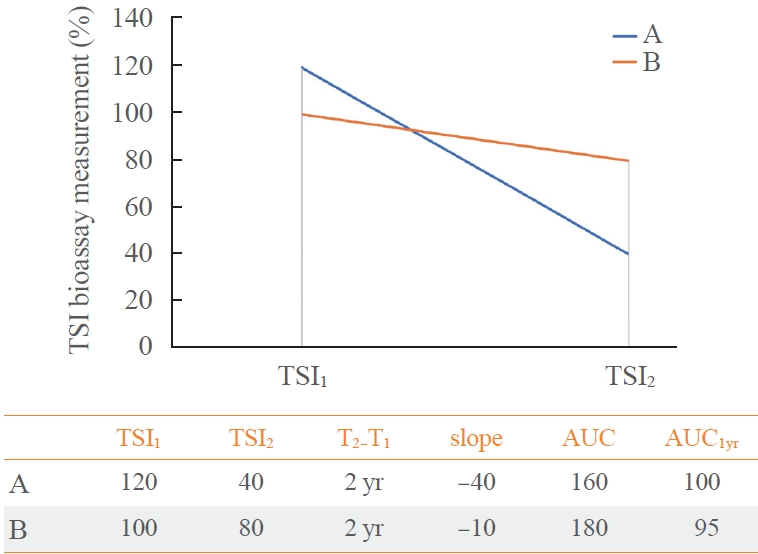
- The area under the curve (AUC) of TSI bioassay or TBII was defined as the area under the graph created by measured two values (Fig. 2). To evaluate the response after initiation of ATD treatment, we decided to obtain the AUC at 1st year (AUC1yr). Since there are a TSI1 and a TSI2, a linear function is assumed and integrated over time. In this way, we obtained the hypothetical value of TSI bioassay 1 year later from TSI1, and calculated AUC1yr. Assuming the TSI1 as the baseline and the slope of the linear function is equal to the slope defined above, the expression is: (Slope TSI bioassay)×time+TSI1. Then, the AUC1yr of ATD treatment is equal to 0.5×slope+TSI1 by following integral equation.
- If the slope is the same, the AUC1yr value of a person with a high baseline will be larger. If the baseline is the same, the AUC1yr value will be larger when the absolute value of the slope is smaller. Examples of calculation are described in Fig. 3. Unless otherwise noted, AUC1yr in this article refers to AUC for the 1st year from the ATD treatment begin.
- Statistical analysis
- A logistic regression model was used to adjust for confounders. In univariate analysis, disease recurrence odds ratio (OR) for each independent factor was calculated. In multivariate analysis, adjusted OR of slope of TBII or TSI bioassay and adjusted OR of AUC of TBII or TSI bioassay were calculated after adjusting for factors such as age, sex, smoking, and presence of goiter. The cutoff value for distinguishing remission or relapse/persistent was calculated using receiver operating characteristic (ROC) curve analysis. Statistical significance was set at P≤0.05. SPSS version 24 (IBM Co., Armonk, NY, USA) was used for all statistical analyses. Graphs were produced using Prism version 8.02 (GraphPad Software Inc., La Jolla, CA, USA). Categorical variables were reported as numbers and frequencies (%). Continuous variables were reported as mean±standard deviation. If the data were nonparametrically distributed, they are expressed as median values with interquartile ranges.
- Ethics approval and consent to participate
- The study adhered to the tenets of the Declaration of Helsinki. It was approved by the Institutional Review Board (IRB) of Seoul St. Mary’s hospital (IRB no. KC22RASI0712). Permission to use hospital data was granted by the IRB of Seoul St. Mary’s Hospital. Due to the retrospective nature of this study, the requirement to obtain informed consent was waived by the IRB of Seoul St. Mary’s Hospital
- Availability of data and materials
- Datasets generated and/or analyzed during the current study are not publicly available due to personal data protection legislation. They are available from the first author or corresponding author upon reasonable request.
METHODS
- Clinical characteristics of study population
- Of a total 156 patients, 82 were in the R group and 74 were in the RP group (Table 1). ATD treatment duration was 28.0 months in R group and 40.5 months in RP group, showing a significant difference between the two (P<0.001). The ATD type included MZ 45.1%, CZ 42.7%, and PTU 4.9% in the R group. It included MZ 29.7%, CZ 62.2%, and PTU 1.4% in the RP group. MZ use was more frequent in the R group than in the RP group. However, the difference between the two was not statistically significant (P=0.078). Female sex, goiter, smoking history, and taking concomitant T4 accounted for 81%, 61%, 6%, and 17%, respectively. These clinical parameters were not significantly different between R and RP groups. There was no significant difference in Graves orbitopathy (17.1% in R group and 24.3% in RP group, P=0.357). Those with a previous treatment history accounted for 13.4% in the R group and 17.9% in the RP group, showing no significant difference between the two (P=0.620).
- The mean duration between baseline TSI and ATD begin was less than 1 month in both groups. Also, the mean duration between baseline TSI and 2nd TSI were 21.3±9.6 months in total (21.0±8.9 months in R group and 23.1±10.6 months in RP group, P=0.228) (Supplemental Table S1).
- As shown in Table 2, the TSI slope was –120.1 (–204.4 to –45.9) in the R group and –84.7 (–198.2 to 8.2) in the RP group, with the slope being significantly steeper in the R group (P=0.026). The TSI: AUC1yr of R group was significantly lower than that of RP group (243.7 [157.9 to 309.9] vs. 310.2 [187.2 to 408.0], P=0.012). The TBII slope was –2.4 (–5.7 to –1.1) in the R group and –3.5 (–6.3 to –0.9) in the RP group, showing no significant difference between the two (P=0.638). TBII: AUC1yr of the R group was significantly lower than that of the RP group (3.7 [1.7 to 6.6] vs. 6.2 [3.6 to 13.2], P=0.001).
- Risk factors for relapse of GD
- Risk factors related to GD recurrence/persistence were investigated using a logistic regression model. In univariate analysis, conventional clinical risk factors including goiter, smoking status, and GO status were not significant predictors. However, ORs of TSI slope, TSI: AUC1yr, and TBII: AUC1yr for predicting a recurrence/persistent disease were 1.001, 1.001, and 1.008, respectively, showing statistical significance (Table 3). On the other hand, baseline TSI, baseline TBII, and TBII: slope were not predictive clinical parameters. In multivariate analysis, TSI: slope, TSI: AUC1yr, and TBII: AUC1yr were all independent clinical parameters that could predict recurrent/persistent disease.
- Through the ROC curve analysis, the cutoff values for dividing the R and RP groups were 0.51 for the slope of TBII, 2.19 for the AUC1yr of TBII, 6.07 for the slope of TSI, and 277.80 for the AUC1yr of TSI, respectively. As a result of analyzing the OR of GD relapse by dividing the study population using this cutoff value, the slope of TBII was 1.183 (0.940 to 1.488; P=0.154), and the AUC1yr of TBII was 1.473 (1.251 to 1.734; P<0.001), the slope of TSI was 1.621 (1.326 to 1.982; P<0.001) and the AUC1yr of TSI was 1.358 (1.167 to 1.580; P<0.001) (Fig. 4).
RESULTS
- In our study, the GD patients who showed rapid reduction of TSI bioassay after ATD treatment were more likely to be in remission. On the other hand, the change of TBII could not predict the disease course. The prolonged exposure time to high antibody titer (both TSI and TBII) could predict the poor disease course with more recurrence and this trend was maintained, even when considering other clinical factors such as age, sex, goiter, smoking, and presence of GO.
- The steep slope means early rapid change of TSI or TBII and it could be a good indicator to drug response and a predictor to achieve remission. This is consistent with previous studies [4,17,18,21], in which those who respond well to ATD in the early stages are predicted to have a better prognosis.
- In a prospective study with 100 patients, Kahaly et al. [4] found that TSI levels decreased markedly in responders (–60%, P<0.001), but increased in non-responders (17%, P<0.01). However, they studied the prognosis after patients took ATD for only 6 months. It was difficult to say that their study reflected the real-world practice in that 6 months might be not long enough to completely evaluate treatment response to ATD. In a retrospective study of 74 patients, Kwon et al. [18] compared relapse rate after stopping ATD according to TSI or TBII positivity. They found that TSI showed better ability to predict disease relapse than TBII. However, their TSI and TBII levels were not measured simultaneously for the same study subject. They only measured TSI and TBII levels at the time of ATD withdrawal, not at the beginning of ATD. Thus, they only had measurements at one-time point. There was one study showing that those with smooth decreases without fluctuation of TSI and TBII had a higher rate of remission and that both TSI and TBII could predict remission in a small study population (n=58) in Japan [22]. In another retrospective study with 609 patients from Japan, fluctuation of TBII were associated with less remission (P<0.001). However, these Japanese studies were all based on positivity of antibodies, making it difficult to measure the exact degree of rapid changes of antibodies.
- We targeted subjects whose TSI bioassay and TBII levels were measured at the same time and at two time points for each person. Therefore, we could consider dynamic changes of values in response to treatment, not only one-time point values such as baseline TBII or follow-up TBII after treatment. The duration of ATD use in study subjects also adhered to the current treatment guideline [23]. Thus, our study outcome can be considered as a result of daily real-world practice. We also quantified early changes of antibodies or chronic exposure to antibodies.
- The decremental change of TSI bioassay level, but not TBII level, induced by ATD was associated with a favorable disease course. In our study, serum TBII was measured during the same period as serum TSI bioassay. However, there was no significant difference in early change of TBII between R group and RP groups. As TBII can act as either mostly stimulating Ab or partly inhibitory Ab, there might be a proportion of TBII that does not respond to ATD [24,25]. Kahaly et al. [4] have also reported that TBII is strongly decreased even in non-responders (–40%, P=0.002). In other words, TSI seems to be more useful than TBII for predicting response to ATD treatment.
- In our study, the recurrence rate was higher in patients with high AUC1yr values in TSI and TBII. A high AUC1yr indicates that persistently high exposure to stimulating antibodies during the ATD treatment. Flynn et al. [26] have shown that chronic in vivo administration of monoclonal antibodies which have a strong thyroid-stimulating activity can sustain high thyroxine levels and thyroid hyperplasia. This result shows a potential pathological role of stimulating antibody, not blocking antibody, in GD. Our study clinically replicated their laboratory results. In addition, since TSH-R is expressed in various parts of body, it can lead to high exposure to antibodies. Thus, it is more difficult to treat the disease considering that TSI level is associated with extra-thyroidal disease [24,27]. High AUC1yr value can be seen as a result of high exposure antibodies. Thus, we can expect a poor GD prognosis, suggesting that the degree of exposure to autoantibodies could be used as a marker for disease course. Okamura et al. [21] have shown that continuous TBII positivity for more than 5 years could suggest persistent GD activity and poor prognosis. Through AUC1yr calculation of TBII or TSI bioassay value, more fortified prognostic factors could be introduced into clinical practice, in addition to TBII or TSI bioassay value per se. In our study, gender, age, goiter, and smoking history known to be conventional risk factors for disease recurrence were not associated with prognostic outcome. Previous largescale population studies and meta-analyses have shown that gender, age, goiter, and smoking history are prognostic factors for poor disease course [9,17,28,29]. In a prospective study with 77 Chinese patients, Zhou et al. [30] have reported that age and sex were not associated with relapse of GD (P=0.517 for age and P=0.215 for sex), although TSI bioassay at the end of ATD was associated GD relapse (P=0.008). In a study of Kwon et al. [18], goiter or thyroid orbitopathy was not associated with GD relapse (P=0.24 for goiter and P=0.87 for GO). It might be because the definition of each factor was different from each other. Despite this fact, thyroid autoantibodies were strong predictive markers when these factors were adjusted.
- Based on our study results, in addition to initially measuring TSI bioassay or TBII for diagnostic purposes in GD patients, measuring follow-up TSI bioassay for prognosis prediction purposes could improve prognosis prediction in patients with a high possibility of early recurrence. TSI is more useful than TBII for predicting GD prognosis using slope or AUC1yr. This is not reported in previous studies. There is no study on how quickly TSI bioassay can be normalized in patients with low or high possibility of early recurrence. It is also unclear for which patients that ATD could be discontinued earlier. These questions could be investigated in future studies.
- Limitations of our study are as follows. First, as a retrospective study, there might be a selection bias because this study targeted patients with TSI bioassay results. In Korea, TSI bioassay is recommended to be tested when serum TBII is not confirmative of GD at the initial presentation or when the subject shows orbital symptoms associated with GD. Thus, patients with ambiguous TBII might have been included. Second, the minimum follow-up period was set to be 1 year. Although frequent relapses usually occur within 1 year of ATD withdrawal, such follow-up period might be short to evaluate whether recurrence occurs or not [13]. Finally, neither the slope nor the AUC1yr we used could reflect the fluctuations of the thyroid antibody. In Korea, TSI cannot be measured frequently due to insurance problems, so we tried to create an index that predicts the disease course by reflecting real-world practice. Future studies on TSI fluctuation and long-term disease course are needed.
- The strength of this study was that it was possible to evaluate initial treatment response and predict prognosis based on early changes of TSI and chronic TSI exposure in a large subset of GD patients. In this regard, the concept of AUC1yr could be considered as another prognostic factor for evaluating the disease course of GD. In addition, this study could reflect real-world practice that kept currently recommended treatment in that it was decided whether to stop taking ATD according to results of antibodies after sufficient use of ATD.
- In conclusion, early changes in TSI bioassay over ATD treatment can better predict prognosis of GD than TBII. The degree of exposure to a high antibody titer (both TSI and TBII) could also predict the disease course at initial phase of treatment, which AUC1yr value can be a good tool.
DISCUSSION
-
Acknowledgements
- A portion of this study was presented in an abstract form at the 91st Annual Meeting of the American Thyroid Association, October 19 to 23, 2022, Montreal, Quebec, Canada.
-
CONFLICTS OF INTEREST
No potential conflict of interest relevant to this article was reported.
-
AUTHOR CONTRIBUTIONS
Conception or design: J.Y., H.S.B., D.J.L. Acquisition, analysis, or interpretation of data: J.Y., H.S.B., D.J.L. Drafting the work or revising: J.Y., H.S.B., C.J., K,J., J.L., J.H., M.H.K., J.L., D.J.L. Final approval of the manuscript: J.Y., H.S.B., C.J., K,J., J.L., J.H., M.H.K., J.L., D.J.L.
Article information
SUPPLEMENTARY MATERIAL
Supplemental Table S1.


Values are expressed as mean±standard deviation, number (%), or median (interquartile range).
ATD, anti-thyroid drug; PTU, propylthiouracil; T4, thyroxine; T3, triiodothyronine; TSH, thyroid-stimulating hormone; TBII, thyrotropin-binding inhibitory immunoglobulin; TSI, thyroid-stimulating immunoglobulin.
| Total (n=156) | Remission (n=82) | Relapse/persistent (n=74) | P value | |
|---|---|---|---|---|
| TBII: slopea | –2.5 (–6.2 to –1.0) | –2.4 (–5.7 to –1.1) | –3.5 (–6.3 to –0.9) | 0.638 |
| TBII: AUC1yrb | 5.0 (2.2 to 10.1) | 3.7 (1.7 to 6.6) | 6.2 (3.6 to 13.2) | 0.001 |
| TSI: slopea | –98.6 (–200.1 to –14.9) | –120.1 (–204.4 to –45.9) | –84.7 (–198.2 to 8.2) | 0.026 |
| TSI: AUC1yrb | 259.5 (169.8 to 367.3) | 243.7 (157.9 to 309.9) | 310.2 (187.2 to 408.0) | 0.012 |
Values are expressed as median (interquartile range).
TBII, thyrotropin-binding inhibitory immunoglobulin; TSI, thyroid-stimulating immunoglobulin; AUC1yr, area under the curve at 1st year.
a The slope was calculated as the difference of the baseline and second values divided by time duration (year); bThe AUC1yr was defined as the area under the line between baseline and second values.
| Variable |
Univariate |
Multivariatec |
||||
|---|---|---|---|---|---|---|
| HR | 95% CI | P value | HR | 95% CI | P value | |
| Age | 0.995 | 0.989–1.001 | 0.132 | |||
| Sex (M:F) | 0.968 | 0.791–1.186 | 0.757 | |||
| Goiter | 0.998 | 0.849–1.173 | 0.983 | |||
| Smoking | 1.028 | 0.745–1.418 | 0.868 | |||
| GO | 1.117 | 0.920–1.357 | 0.266 | |||
| Baseline TBII | 1.005 | 0.998–1.012 | 0.164 | 1.005 | 0.998–1.012 | 0.184 |
| TBII: slopea | 1.003 | 0.998–1.007 | 0.293 | 1.002 | 0.997–1.007 | 0.358 |
| TBII: AUC1yrb | 1.008 | 1.001–1.015 | 0.028 | 1.007 | 1.000–1.014 | 0.040 |
| Baseline TSI | 1.000 | 1.000–1.001 | 0.180 | 1.000 | 1.000–1.001 | 0.174 |
| TSI: slopea | 1.001 | 1.000–1.001 | 0.049 | 1.001 | 1.000–1.001 | 0.057 |
| TSI: AUC1yrb | 1.001 | 1.000–1.001 | 0.007 | 1.001 | 1.000–1.001 | 0.007 |
HR, hazard ratio; CI, confidence interval; GO, Grave’s orbitopathy; TBII, thyrotropin-binding inhibitory immunoglobulin; AUC1yr, area under the curve at 1st year; TSI, thyroid-stimulating immunoglobulin.
a The slope was calculated as the difference of the baseline and second values divided by time duration (year);
b The AUC1yr was defined as the area under the line between baseline and second values;
c The HR for each value (baseline, slope, AUC) of TBII and TSI is adjusted with age, sex, goiter and GO.
- 1. Kahaly GJ. Management of Graves thyroidal and extrathyroidal disease: an update. J Clin Endocrinol Metab 2020;105:3704–20.ArticlePubMedPMCPDF
- 2. Smith TJ, Hegedus L. Graves’ disease. N Engl J Med 2016;375:1552–65.ArticlePubMed
- 3. Baek HS, Park JY, Jeong CH, Ha J, Kang MI, Lim DJ. Usefulness of real-time quantitative microvascular ultrasonography for differentiation of Graves’ disease from destructive thyroiditis in thyrotoxic patients. Endocrinol Metab (Seoul) 2022;37:323–32.ArticlePubMedPMCPDF
- 4. Kahaly GJ, Diana T, Kanitz M, Frommer L, Olivo PD. Prospective trial of functional thyrotropin receptor antibodies in Graves disease. J Clin Endocrinol Metab 2020;105:e1006–14.ArticlePubMedPMCPDF
- 5. Giuliani C, Saji M, Bucci I, Napolitano G. Bioassays for TSH receptor autoantibodies, from FRTL-5 cells to TSH receptor-LH/CG receptor chimeras: the contribution of Leonard D. Kohn. Front Endocrinol (Lausanne) 2016;7:103.ArticlePubMedPMC
- 6. Alvin Mathew A, Papaly R, Maliakal A, Chandra L, Antony MA. Elevated Graves’ disease-specific thyroid-stimulating immunoglobulin and thyro tibody as a predictive factor for Graves’ disease relapse. Cureus 2022;14:e22190.PubMedPMC
- 7. Liu X, Wong CK, Chan WW, Tang EH, Woo YC, Lam CL, et al. Outcomes of Graves’ disease patients following antithyroid drugs, radioactive iodine, or thyroidectomy as the first-line treatment. Ann Surg 2021;273:1197–206.ArticlePubMed
- 8. Kim MJ, Cho SW, Kim YA, Choi HS, Park YJ, Park DJ, et al. Clinical outcomes of repeated radioactive iodine therapy for Graves’ disease. Endocrinol Metab (Seoul) 2022;37:524–32.ArticlePubMedPMCPDF
- 9. Da Silva Santos T, Oliveira JC, Freitas C, Couto de Carvalho A. Thyroid-stimulatory antibody as a predictive factor for Graves’ disease relapse. Cureus 2022;14:e22190.PubMedPMC
- 10. Barbesino G, Tomer Y. Clinical review: clinical utility of TSH receptor antibodies. J Clin Endocrinol Metab 2013;98:2247–55.PubMedPMC
- 11. Bartalena L, Piantanida E, Gallo D, Ippolito S, Tanda ML. Management of Graves’ hyperthyroidism: present and future. Expert Rev Endocrinol Metab 2022;17:153–66.ArticlePubMed
- 12. Brito JP, Payne S, Singh Ospina N, Rodriguez-Gutierrez R, Maraka S, Sangaralingham LR, et al. Patterns of use, efficacy, and safety of treatment options for patients with Graves’ disease: a nationwide population-based study. Thyroid 2020;30:357–64.ArticlePubMed
- 13. Azizi F, Amouzegar A, Tohidi M, Hedayati M, Khalili D, Cheraghi L, et al. Increased remission rates after long-term methimazole therapy in patients with Graves’ disease: results of a randomized clinical trial. Thyroid 2019;29:1192–200.ArticlePubMed
- 14. Park SY, Kim BH, Kim M, Hong AR, Park J, Park H, et al. The longer the antithyroid drug is used, the lower the relapse rate in Graves’ disease: a retrospective multicenter cohort study in Korea. Endocrine 2021;74:120–7.ArticlePubMedPDF
- 15. Azizi F, Abdi H, Mehran L, Amouzegar A. Appropriate duration of antithyroid drug treatment as a predictor for relapse of Graves’ disease: a systematic scoping review. J Endocrinol Invest 2022;45:1139–50.ArticlePubMedPDF
- 16. Garcia-Mayor RV, Alvarez-Vazquez P, Fluiters E, Valverde D, Andrade A. Long-term remission following antithyroid drug withdrawal in patients with Graves’ hyperthyroidism: parameters with prognostic value. Endocrine 2019;63:316–22.ArticlePubMedPDF
- 17. Baek HS, Lee J, Jeong CH, Lee J, Ha J, Jo K, et al. The prediction model using thyroid-stimulating immunoglobulin bioassay for relapse of Graves’ disease. J Endocr Soc 2022;6:bvac023.ArticlePubMedPMCPDF
- 18. Kwon H, Kim WG, Jang EK, Kim M, Park S, Jeon MJ, et al. Usefulness of measuring thyroid stimulating antibody at the time of antithyroid drug withdrawal for predicting relapse of Graves disease. Endocrinol Metab (Seoul) 2016;31:300–10.ArticlePubMedPMCPDF
- 19. Li Y, Kim J, Diana T, Klasen R, Olivo PD, Kahaly GJ. A novel bioassay for anti-thyrotrophin receptor autoantibodies detects both thyroid-blocking and stimulating activity. Clin Exp Immunol 2013;173:390–7.ArticlePubMedPMCPDF
- 20. Watson PF, Ajjan RA, Phipps J, Metcalfe R, Weetman AP. A new chemiluminescent assay for the rapid detection of thyroid stimulating antibodies in Graves’ disease. Clin Endocrinol (Oxf) 1998;49:577–81.ArticlePubMedPDF
- 21. Okamura K, Bandai S, Fujikawa M, Sato K, Ikenoue H, Kitazono T. Long-term antithyroid drug treatment: trends in serum TSH and TSH receptor antibody changes in patients with Graves’ disease. Int J Endocrinol Metab 2020;18(Suppl):e101139.ArticlePDF
- 22. Takasu N, Yamashiro K, Komiya I, Ochi Y, Sato Y, Nagata A. Remission of Graves’ hyperthyroidism predicted by smooth decreases of thyroid-stimulating antibody and thyrotropinbinding inhibitor immunoglobulin during antithyroid drug treatment. Thyroid 2000;10:891–6.ArticlePubMed
- 23. Kahaly GJ, Bartalena L, Hegedus L, Leenhardt L, Poppe K, Pearce SH. 2018 European Thyroid Association guideline for the management of Graves’ hyperthyroidism. Eur Thyroid J 2018;7:167–86.ArticlePubMedPMCPDF
- 24. Kahaly GJ, Diana T, Olivo PD. TSH receptor antibodies: relevance & utility. Endocr Pract 2020;26:97–106.ArticlePubMed
- 25. Morshed SA, Ma R, Latif R, Davies TF. How one TSH receptor antibody induces thyrocyte proliferation while another induces apoptosis. J Autoimmun 2013;47:17–24.ArticlePubMedPMC
- 26. Flynn JC, Gilbert JA, Meroueh C, Snower DP, David CS, Kong YC, et al. Chronic exposure in vivo to thyrotropin receptor stimulating monoclonal antibodies sustains high thyroxine levels and thyroid hyperplasia in thyroid autoimmunity-prone HLA-DRB1*0301 transgenic mice. Immunology 2007;122:261–7.ArticlePubMedPMC
- 27. Frohlich E, Wahl R. Thyroid autoimmunity: role of anti-thyroid antibodies in thyroid and extra-thyroidal diseases. Front Immunol 2017;8:521.ArticlePubMedPMC
- 28. Bano A, Gan E, Addison C, Narayanan K, Weaver JU, Tsatlidis V, et al. Age may influence the impact of TRAbs on thyroid function and relapse-risk in patients with Graves disease. J Clin Endocrinol Metab 2019;104:1378–85.ArticlePubMed
- 29. Zuhur SS, Yildiz I, Altuntas Y, Bayraktaroglu T, Erol S, Sahin S, et al. The effect of gender on response to antithyroid drugs and risk of relapse after discontinuation of the antithyroid drugs in patients with Graves’ hyperthyroidism: a multicentre study. Endokrynol Pol 2020;71:207–12.PubMed
- 30. Zhou Y, Zhou M, Qi Y, Wang W, Chen X, Wang S. The prognostic value of thyroid-stimulating immunoglobulin in the management of Graves’ disease. Ther Adv Endocrinol Metab 2021;12:20420188211044943.ArticlePubMedPMCPDF
References
Figure & Data
References
Citations
- Enhanced predictive validity of integrative models for refractory hyperthyroidism considering baseline and early therapy characteristics: a prospective cohort study
Xinpan Wang, Tiantian Li, Yue Li, Qiuyi Wang, Yun Cai, Zhixiao Wang, Yun Shi, Tao Yang, Xuqin Zheng
Journal of Translational Medicine.2024;[Epub] CrossRef - Long-term effect of thyrotropin-binding inhibitor immunoglobulin on atrial fibrillation in euthyroid patients
Jung-Chi Hsu, Kang-Chih Fan, Ting-Chuan Wang, Shu-Lin Chuang, Ying-Ting Chao, Ting-Tse Lin, Kuan-Chih Huang, Lian-Yu Lin, Lung-Chun Lin
Endocrine Practice.2024;[Epub] CrossRef
 PubReader
 ePub Link
 Cite
Cite