A1c Variability Can Predict Coronary Artery Disease in Patients with Type 2 Diabetes with Mean A1c Levels Greater than 7
Article information
Abstract
Background
Recent studies suggested that the association of acute glucose variability and diabetic complications was not consistent, and that A1c variability representing long term glucose fluctuation may be related to coronary atherosclerosis in patients with type 1 diabetes. In this study, we attempt to determine whether or not A1c variability can predict coronary artery disease (CAD) in patients with type 2 diabetes.
Methods
We reviewed data of patients with type 2 diabetes who had undergone coronary angiography (CAG) and had been followed up with for 5 years. The intrapersonal standard deviation (SD) of serially-measured A1c levels adjusted by the different number of assessments among patients (adj-A1c-SD) was considered to be a measure of the variability of A1c.
Results
Among the 269 patients, 121 of them had type 2 diabetes with CAD. In patients with A1c ≥7%, the mean A1c levels and A1c levels at the time of CAG among the three groups were significantly different. The ratio of patients with CAD was the highest in the high adj-A1c-SD group and the lowest in the low adj-A1c-SD group (P=0.017). In multiple regression analysis, adj-A1c-SD was an independent predictor for CAD in subjects with A1c ≥7% (odds ratio, 2.140; P=0.036).
Conclusion
Patients with higher A1c variability for several years showed higher mean A1c levels. A1c variability can be an independent predictor for CAD as seen in angiographs of patients with type 2 diabetes with mean A1c levels over 7%.
INTRODUCTION
It is well known that type 2 diabetes has an association between the degree of hyperglycemia and increased risk of microvascular complications, myocardial infarction, and macrovascular mortality through previously well-designed prospective studies [1-6]. Although many studies have investigated and compared the roles of the multiple risk factors involved in diabetic vascular complications, an accurate assessment of their respective contributions remains difficult [7-9]. However, as demonstrated by many trials, microvascular and macrovascular complications are mainly or partly [1,5,10] dependent on dysglycemia. Recently, it was suggested that hemoglobin A1c (HbA1c) is not the only component of dysglycemia as a risk factor for diabetic complications [11]. Dysglycemia may be composed of fasting glucose levels, postprandial glucose levels, mean glucose levels, and glucose variability.
In terms of glucose variability, patients may show various degrees of glycemic excursions even when they have identical A1c values [12]. More harmful effects of variable glucose concentrations than stable high glucose was observed on high-glucose-induced reactive oxygen species (ROS) generation and cellular apoptosis in several in vitro studies [13-15]. We also reported the effect of intermittent high glucose on pancreatic beta cell apoptosis [16]. Those studies have suggested that glycemic variability may play a role in the pathogenesis of atherosclerosis and may be an independent risk factor for diabetic complications. However, there have been no sufficient studies presented so far that specifically evaluated the relationship between glycemic variability, atherosclerosis, and complications in diabetic patients, especially for cardiovascular complications. One recent study showed that glucose variability for 72 hours measured by a continuous glucose monitoring system was associated with coronary atherosclerosis in patients with type 2 diabetes [17].
Most of the previous studies reported that the relationships between glucose variability and oxidative stress or diabetic complications dealt acute glucose fluctuation for several days. However, atherosclerosis is a long term processed condition, which may occur from very young age and progress through a person's lifetime [18]. In the Diabetes Control and Complications Trial (DCCT), variation in the 7-point laboratory-measured glucose profiles for several days did not predict diabetic complications [19]. Other recent reports showed that variations in long-term glycemia, defined as A1c variability, were powerful independent predictors for diabetic microvascular complications and even for cardiovascular disease (CVD) events in patients with type 1 diabetes [12,20]. Therefore, we analyzed the effect of long term A1C variability for the prediction of coronary atherosclerosis in patients with type 2 diabetes.
METHODS
Study subjects and biochemical measurement
The inclusion criteria for this study was patients with type 2 diabetes who had undergone coronary angiography (CAG) due to chest pain and had been followed up in our institute for at least 5 years prior to the CAG. We selected patients who had HbA1c measurements at least five times during the follow-up period. Their systolic blood pressure (SBP) and diastolic pressures (DBP) were checked at every clinic visit. Fasting blood tests were performed on the patients including routine complete blood count, liver function test, kidney function, and lipid profile at least once a year based on the institute's own follow-up plan. We excluded subjects with a previous history of stroke and peripheral vascular disease.
Serial A1c measurements
HbA1c at CAG is serum HbA1c levels measured at the time CAG was performed. During a mean follow-up of 5.9 years, the mean number of A1C measurements per patient was 10 (range, 5 to 18), and there were on average 2.1 measurements per patient per year. For each patient, the intrapersonal mean and standard deviations (SDs) of all the recorded A1c measurements were calculated. The intrapersonal SD of the serially-measured A1c levels adjusted by the different number of assessments among patients (adj-A1c-SD=SD/√[n/(n-1)]) was considered a measure of variability of A1c.
CAG
Coronary artery angiography was performed using standard Judkins techniques or a radial approach. During cardiac catheterization, nitroglycerine was administrated routinely in all the cases suspected of having coronary spasm. Angiographic analysis was carried out by three experienced interventional cardiologists. Coronary artery disease (CAD) was defined as the presence of one or more lesions with greater than 50% luminal narrowing in the coronary artery. Otherwise, patients were classified as angina with insignificant coronary artery stenosis.
Statistical analyses
We analyzed our data with SPSS version 18 (IBM Co., Armonk, NY, USA). A comparison of multiple factors between the groups divided by CAD was performed by Student t test analysis. Logistic regression analysis of CAD with the variables was performed. The proportion of patients with CAD among the groups divided by the mean A1c was analyzed by the chi-square test. A P value less than 0.05 was considered statistically significant.
RESULTS
Comparison of characteristics of subjects divided into tertiles of intrapersonal SD of serially-measured A1c levels (adj-A1c-SD)
Our study subjects that were chosen by the inclusion criteria described above totaled 269 patients. Among them, 121 patients had type 2 diabetes with CAD and their mean age was 64.3 years old.
The range of mean A1c levels was 6.75 to 11.67 and the range of SD of A1c levels was 0.06 to 4.54. The range of adj-A1c-SD was 0.049 to 4.127.
We divided the patients into tertiles of intrapersonal SD of serially-measured A1c levels (Table 1). Patients in the lowest, the middle, and the highest tertile were referred to as the low SD group, the middle SD group, and the high SD group, respectively. They did not exhibit any differences in age, body mass index (BMI), smoking status, medication, systolic blood pressure (SBP), and DBP at the time of CAG. Subjects of the three groups had similar total cholesterol, low density lipoprotein cholesterol (LDL-C), high density lipoprotein cholesterol (HDL-C), and triglyceride levels at the time of CAG. The mean A1c levels of the low, middle, and high SD groups were 6.90%±0.95%, 7.51%±1.14%, and 8.22%±1.32%, respectively. The mean A1c levels of the three groups were significantly different (P<0.05). The ratio of patients with CAD was not significantly different in the three groups (P=0.352).
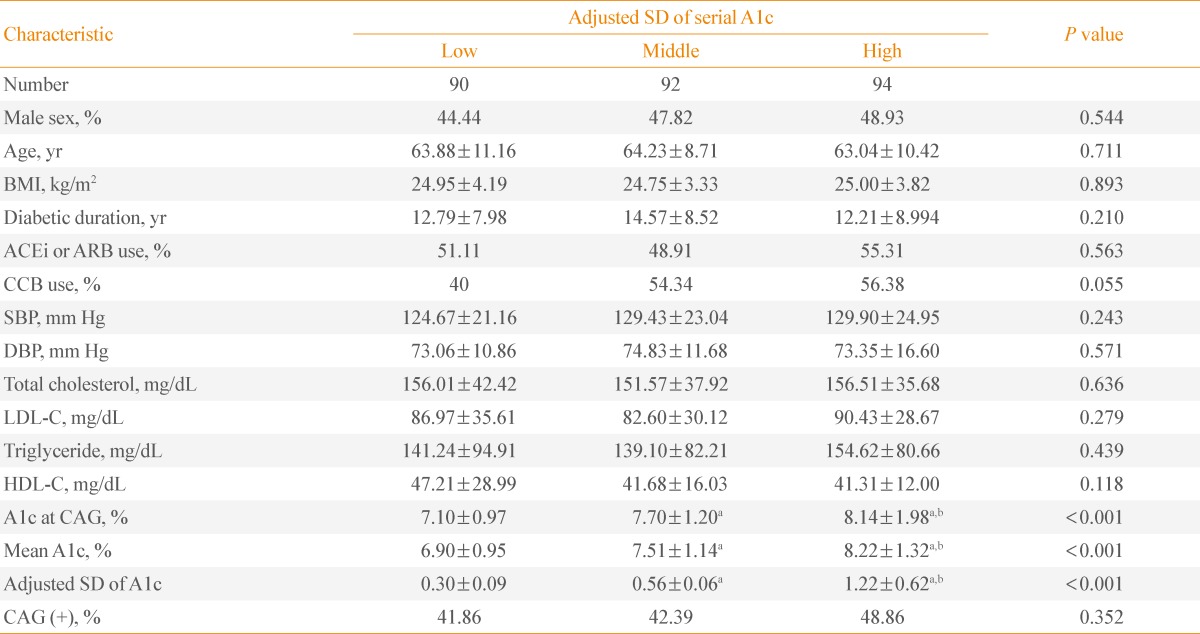
Characteristics of Patients Divided into Tertiles of Intrapersonal Standard Deviation of Serially-Measured A1c Levels
The distribution of SD of A1c according to the mean A1c level
To assess the relationship of SD of A1c and the mean A1c level, we compared the distribution of the SD of A1c according to the mean A1c level (Fig. 1). We divided the subjects into two groups depending on the mean A1c levels: A1c <7% and ≥7%. The percentages of patients with A1c <7% and ≥7% in the low SD group were 53.33% and 46.66%, respectively. In the middle SD group, the percentage of type 2 diabetics with A1c ≥7% was twice the amount of subjects with <7% A1c. The patients with a mean A1c ≥7% were nearly four times greater in number than A1c <7% patients in the high SD group.
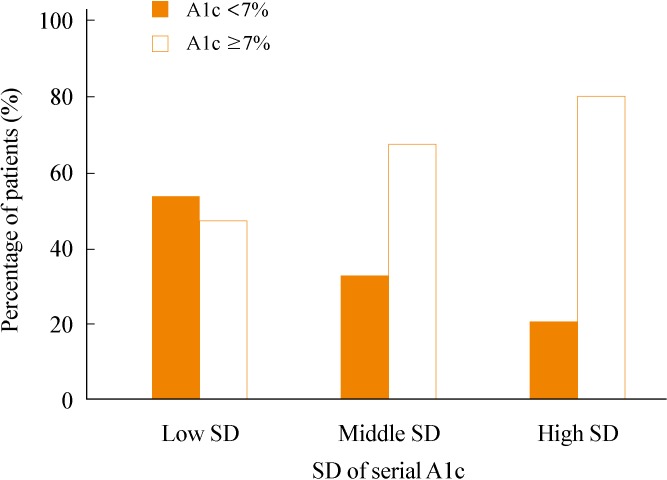
The percentage of patients with A1c <7% and ≥7% in groups divided by tertile of adjusted standard deviation (SD) of serial A1c levels (chi-square, P<0.001).
Comparison of characteristics of subjects divided by mean A1c level and tertiles of intrapersonal SD of serially-measured A1c levels (adj-A1c-SD)
The patients with A1c <7% did not show any significant differences in age, BMI, smoking status, medication, SBP, and DBP among the three groups (Table 2). They had similar total cholesterol, LDL-C, triglyceride, and HDL-C levels. The mean A1c levels of the three groups were significantly different (P<0.001). However, the ratio of patients with CAG was not significantly different in the three groups (P=0.058) (Table 2).
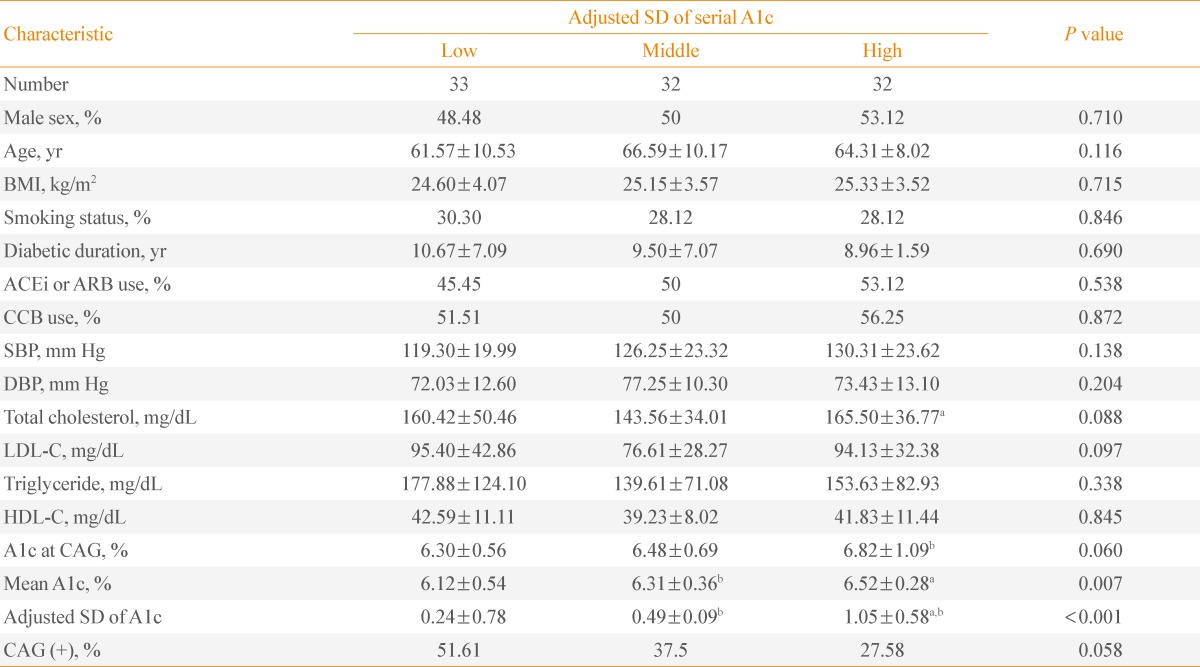
Characteristics of Patients with Mean A1c <7% Divided into Tertiles of Intrapersonal Standard Deviation of Serially-Measured A1c Levels
In the subjects with a mean A1c ≥7%, the mean A1c levels and A1c at CAG among the three groups were significantly different (P<0.001). The ratio of patients with CAD was the highest in the high A1c SD group and the lowest in the low A1c SD group (P=0.017) (Table 3). The use of calcium channel blocker was significantly different, but other parameters including age, BMI, smoking status, angiotensin converting enzyme inhibitor or angiotensin receptor blocker use, SBP, DBP, and lipid profiles did not exhibit any differences among the three groups in patients with A1c ≥7%.
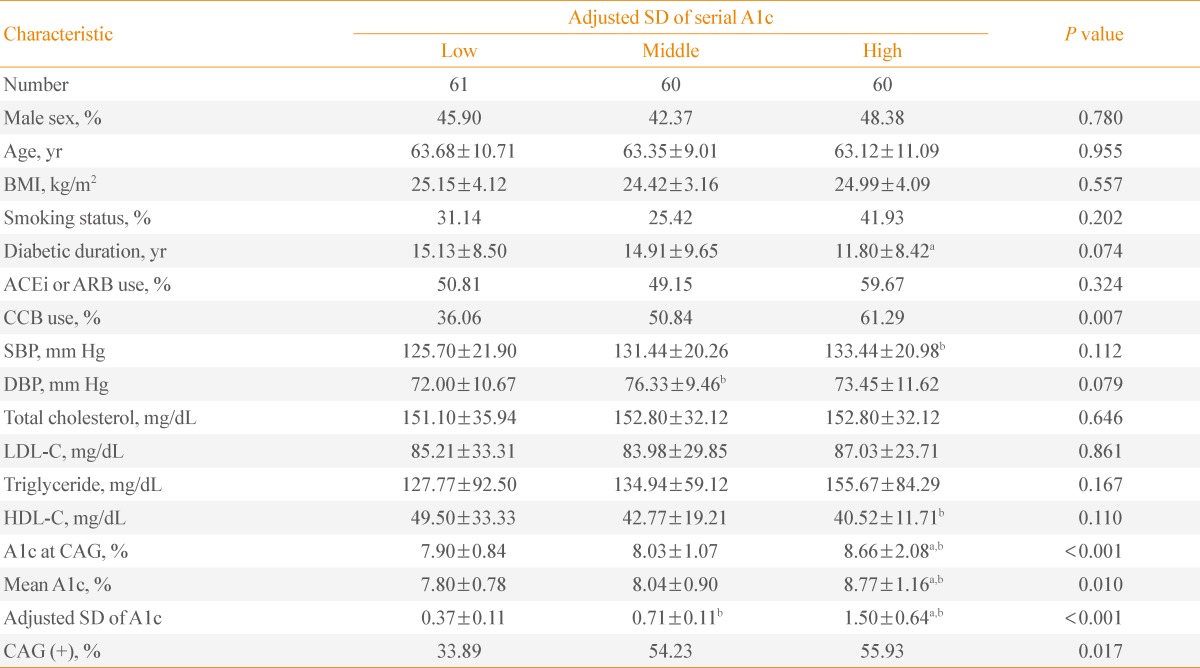
Characteristics of Patients with Mean A1c ≥7% Divided into Tertiles of Intrapersonal Standard Deviation of Serially-Measured A1c Levels
Predictors of CAD in type 2 diabetics
To evaluate the independent predictors for the existence of CAD, we performed a multiple regression analysis. SBP was an independent predictor for CAD in patients with A1c <7% (Table 4). In subjects with A1c ≥7%, the adjusted SD of A1c and LDL-C was an independent predictor for CAD (adjusted SD of A1c, odds ratio [OR], 2.140, P=0.036; LDL-C, OR, 1.045, P=0.021) (Table 5).
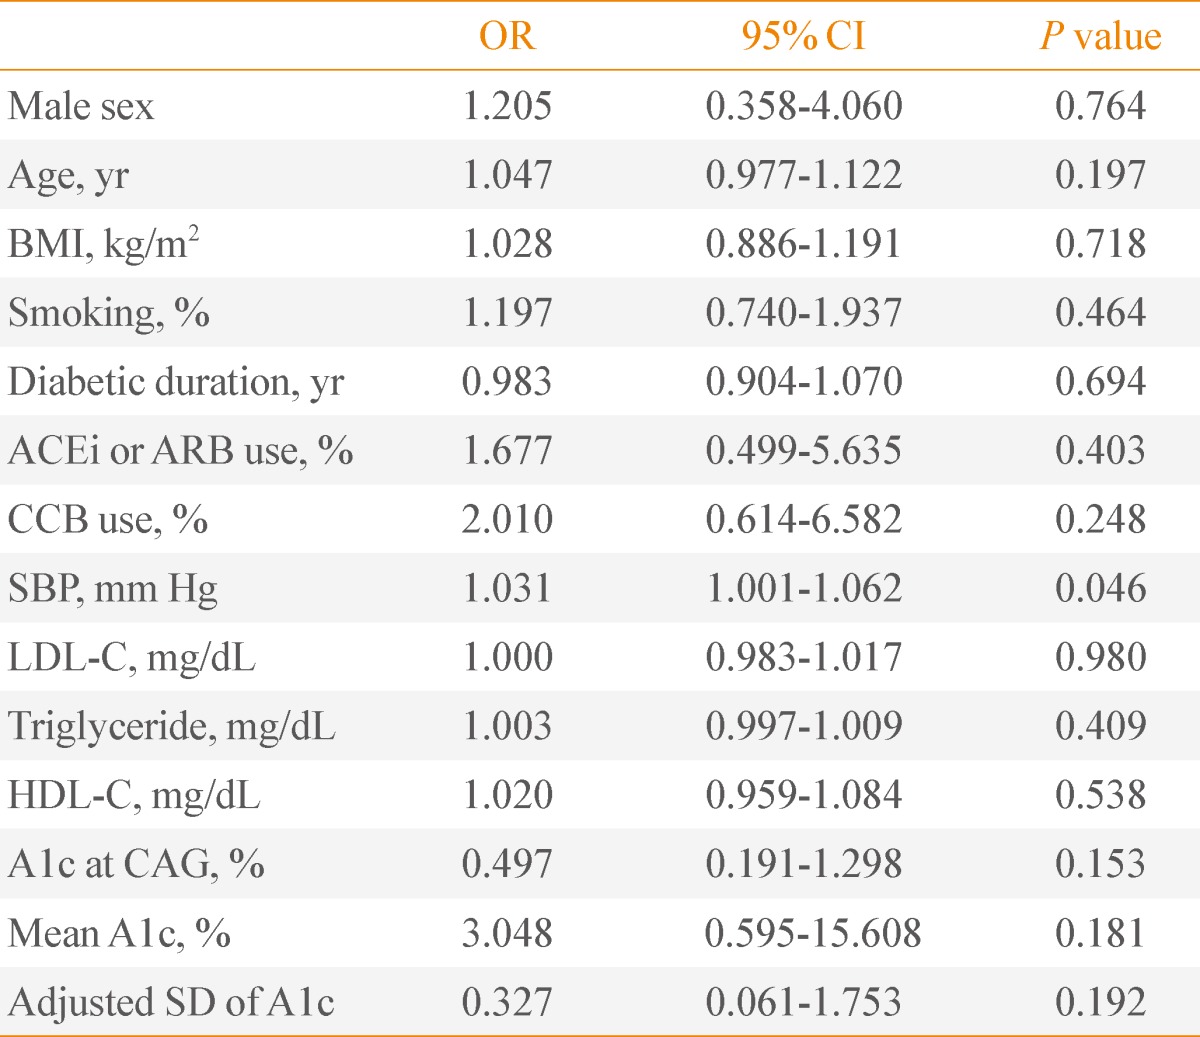
Predictors of the Existence of Coronary Artery Disease in Type 2 Diabetes with A1c <7%
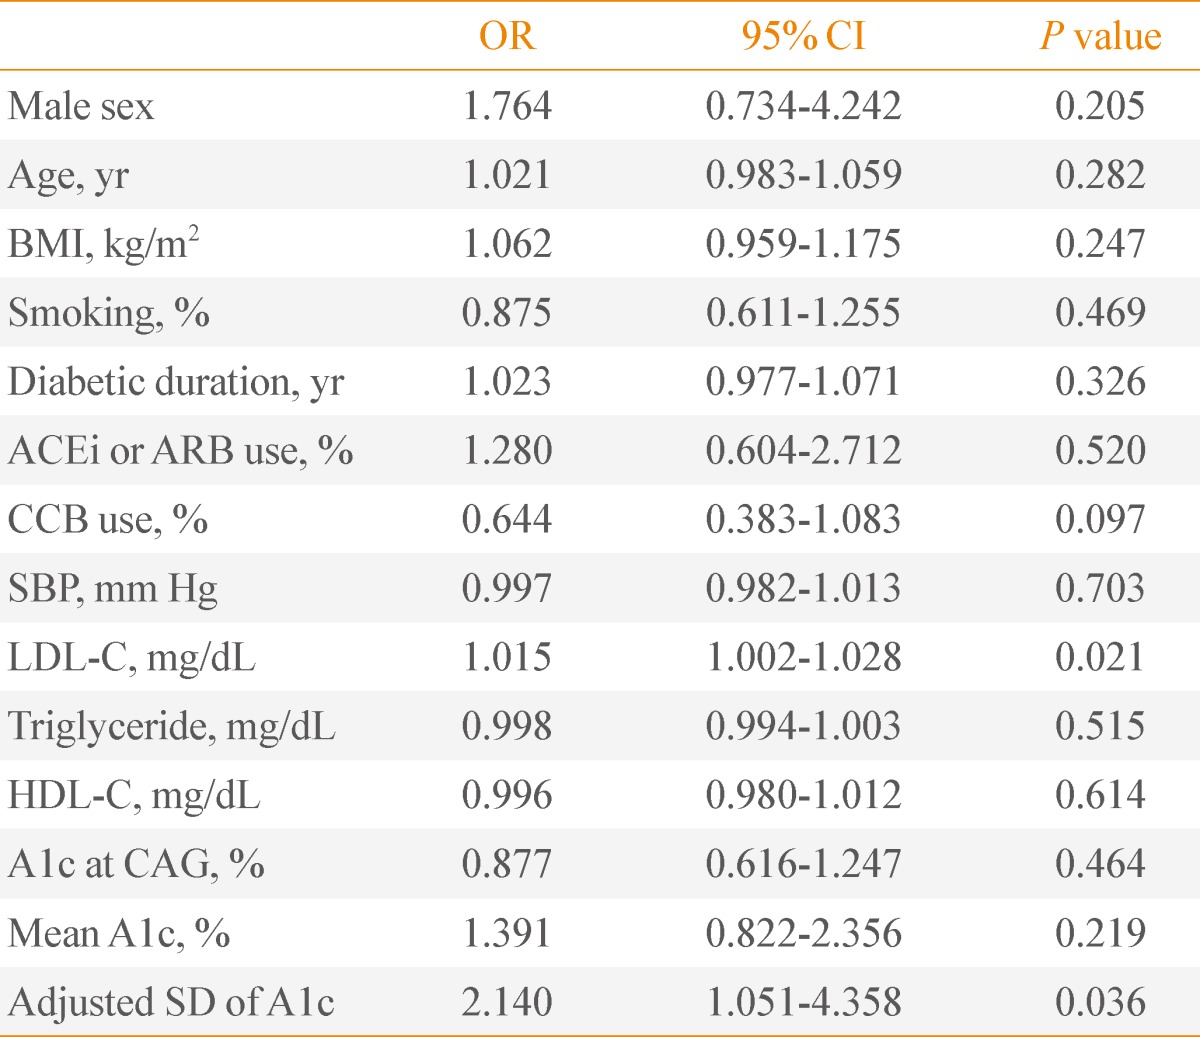
Predictors of the Existence of Coronary Artery Disease in Type 2 Diabetes with A1c ≥7%
DISCUSSION
We focused on the relationship between A1c variability for over 5 years and confirmed CAD using CAG. Patients with larger A1c variability exhibited a tendency to have higher mean A1c levels. CAD was found more frequently in patients with a high SD of A1c in patients with mean A1c ≥7%. When we analyzed these findings in detail, our results showed that larger A1c variability with an adjusted SD of A1c was an independent predictor for coronary atherosclerosis in patients with mean A1c ≥7%.
The clinical evidence to support our results regarding the association of A1c variability and CAD is few in number because of a lack of interest in A1c variability and a standardized method to measure glycemic variability in a large number of patients. One previous study reported that the long-term variability of fasting glucose was an independent predictor of mortality in patients with type 2 diabetes [21]. They measured at least two fasting plasma glucose (FPG) values every year from 1984 to 1986 and followed the patients for 10 years to assess total and cause-specific mortality. The coefficient of variation (CV) of FPG was an independent predictor of total, cardiovascular, and cancer mortality. The mean FPG was a predictor of total mortality only when the CV of FPG was not included in the analyses. Another recent analysis of the DCCT data showed that A1c variability added to the predictive power of the A1c level alone for diabetic nephropathy and retinopathy [20]. They assessed the variation in long-term glycemia as intrapersonal SDs of quarterly measured A1c. The analysis from the data of a Finnish diabetic nephropathy study also reported that A1c variability was a predictor for incident microalbuminuria, progression of renal disease, and the incidence of CVD events in patients with type 1 diabetes [12].
The mechanisms by which glucose fluctuation damages cells including vascular endothelium remain uncertain. Studies have shown that temporary or repetitive hyperglycemia induces the adhesion of monocytes to endothelial cells compared to consistent hyperglycemia in SD rats [22-24]. Hyperglycemic "spikes" may play a direct and significant role in the pathogenesis of diabetic vascular complications [25]. Hyperglycemia itself may induce endothelial injury through the formation of toxic metabolites such as ROS, advanced glycation end product [26], increased sorbitol [27], and persistent activation of protein kinase C [28]. Increased ROS serves as a final common pathway of hyperglycemia-induced vascular dysfunction through a multitude of mechanisms. It has been suggested that the wider the glucose level fluctuates, the more ROS is produced, which may induce more severe damage in endothelial cells [13,14,29,30]. Glucose fluctuation may weaken the adaption and cause much stronger toxicities [16]. Type 2 diabetes has a linear correlation between increased free radical production and the magnitude of glucose fluctuations, calculated as the mean amplitude of glycemic excursion. Glycemic excursions measured by continuous glucose measurement correlates with oxidative stress in patients with type 2 diabetes [31].
The reason that the predictive power of A1c variability was different between the groups divided by the mean A1c level in our study is not clear. The treatment effect of intensive glucose control against macrovascular complications of type 2 diabetes still remains unanswered, and is a source of frustration in recent large epidemiology studies [32-34]. One new hypothesis of the glycemic threshold was recently suggested from analyzing data of one study [35]. Based on their analysis, unlike microvascular complications of diabetes, the glycemic threshold of macrovascular complications would be 7%, not 6.5%. Moreover, patients with higher mean A1c levels had higher A1c variability. These may be possible explanations for our result which states that higher A1c variability in patients with mean A1c levels ≥7% may predict the existence of CAD in patients with type 2 diabetes.
There are several limitations in our study. First, our study was a retrospective observation study. We created strict inclusion criteria for the purpose of our study in order to minimize that limitation. We collected serial A1c levels from available medical records. Since those values were a part of a routine clinical follow-up plan, there were various intervals between A1C measurements for each patient. The number of measurements of A1c during the study period per individual patient also varied. Therefore, we used the SD of serially-measured A1c levels adjusted by the different number of assessments among patients. Medication or insulin therapy for diabetes may affect glucose fluctuation, but we did not analyze the different modalities of treatment for diabetes due to the inability to determine the certain pattern of drug change over 5 years.
In conclusion, we found that A1c variability over the previous 5 years can be a predictor for future coronary atherosclerosis in patients with type 2 diabetes with mean A1c levels over 7%.
ACKNOWLEDGMENTS
This work was supported by the 2012 Inje University Research Grant.
Notes
No potential conflict of interest relevant to this article was reported.