Response: The Association between Persistent Hypertriglyceridemia and the Risk of Diabetes Development: The Kangbuk Samsung Health Study (Endocrinol Metab 2018;33:55–61, Yu Hyun Kwon et al.)
Article information

Triglycerides (TG) are lipids known to constitute excess energy resources that can be stored in adipose tissue and known to be the mostly benign form of lipoprotein [1]. High circulating levels of TG reflect the inability of adipose tissue to store excess energy in the form of TG, which causes them to release a certain amount of TG into the circulation. In our body, insulin plays the role of preventing ectopic fat accumulation and lipolysis [2]. Therefore, high TG levels are a good surrogate marker of insulin resistance and of high levels of excess energy. In addition, hypertriglyceridemia is known to be a major component of metabolic syndrome and a marker of those at high risk of cardiovascular disease. LeBlanc et al. [3] suggested that the hypertriglyceridemic waist phenotype, defined by high TG (≥150 mg/dL) and an enlarged waist, could be a simple and accurate way to identify subjects with high cardiometabolic risk.
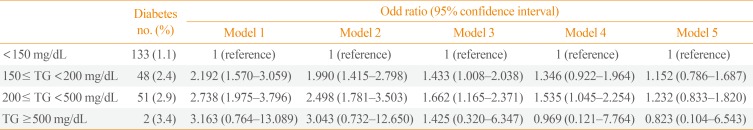
In the last issue of Endocrinology and Metabolism, Prof. Seo presented some suggestions regarding the analyses presented in our recent study [45]. She suggested that we repeat the analyses with an extended follow-up period. She also suggested that we re-analyze the data, dividing the subjects according to different grades of TG levels (i.e., <150, 150 to 200, 200 to 500, and ≥500 mg/dL). Unfortunately, we were not able to carry out her first suggestion, since this was a retrospective study, and for now, we cannot extend the follow-up of our subjects because deidentified data were provided to us.
For the second suggestion, we re-analyzed the data for the risk of development of diabetes after 4 years according to various baseline levels of TG. We divided the subjects into four groups according to baseline TG levels in 2010 (<150, 150 to 200, 200 to 500, and ≥500 mg/dL), and we analyzed the risk for diabetes development as of 2014 (Table 1). In a stepwise adjustment process until model 4, which adjusted for age, sex, fasting blood glucose, total cholesterol and lifestyle factors, those with TG levels 200 to 500 mg/dL showed a significantly higher risk for diabetes development even after adjusting for multiple confounding factors (Table 1). The reason for non-significance in those with TG ≥500 mg/dL was that very few subjects were in that group, and of those subjects, few developed diabetes. As in our previously published study [5], the significant increase in risk for diabetes development disappeared when body mass index was included in the model (model 5, Table 1). This suggests that high TG cannot overcome the effect of body size and obesity status for the prediction of diabetes.

Risk of Diabetes Development after 4 Years according to Baseline Triglyceride Levels
We thank Prof. Seo for publishing her letter and for giving us such thought-provoking suggestions. It was an excellent opportunity to re-analyze our data from a different perspective. We hope that more studies will be performed regarding the associations between lipid abnormalities and diabetes risk in the future.
Notes
CONFLICTS OF INTEREST: No potential conflict of interest relevant to this article was reported.