Increased Risk of Nonalcoholic Fatty Liver Disease in Individuals with High Weight Variability
Article information

Abstract
Background
Weight loss through lifestyle modification is recommended for patients with nonalcoholic fatty liver disease (NAFLD). Recent studies have suggested that repeated loss and gain of weight is associated with worse health outcomes. This study aimed to examine the association between weight variability and the risk of NAFLD in patients without diabetes.
Methods
We examined the health-checkup data of 30,708 participants who had undergone serial examinations between 2010 and 2014. Weight variability was assessed using coefficient of variation and the average successive variability of weight (ASVW), which was defined as the sum of absolute weight changes between successive years over the 5-year period divided by 4. The participants were classified according to the baseline body mass index and weight difference over 4 years.
Results
On dividing the participants into four groups according to ASVW quartile groups, those in the highest quartile showed a significantly increased risk of NAFLD compared to those in the lowest quartile (odds ratio [OR], 1.89; 95% confidence interval [CI], 1.63 to 2.19). Among participants without obesity at baseline, individuals with high ASVW showed increased risk of NAFLD (OR, 1.80; 95% CI, 1.61 to 2.01). Participants with increased weight over 4 years and high ASVW demonstrated higher risk of NAFLD compared to those with stable weight and low ASVW (OR, 4.87; 95% CI, 4.29 to 5.53).
Conclusion
Regardless of participant baseline obesity status, high weight variability was associated with an increased risk of developing NAFLD. Our results suggest that further effort is required to minimize weight fluctuations after achieving a desirable body weight.
INTRODUCTION
Obesity prevalence has increased to pandemic levels over the past decades [1]. Obesity is a major public health concern because it is a known risk factor for various diseases, such as hypertension, stroke, several cancers, type 2 diabetes mellitus, and nonalcoholic fatty liver disease (NAFLD) [2,3].
NAFLD is another major health challenge that has reached epidemic levels globally, ranging from simple hepatic steatosis to steatohepatitis [4]. As a consequence of the worldwide spread of obesity, the global prevalence of NAFLD is estimated at 24% [5]. The epidemiology of NAFLD varies worldwide, and it is usually parallel to the prevalence of obesity [6]. In most patients, NAFLD is closely associated with metabolic comorbidities, such as obesity and diabetes; therefore, NAFLD is considered a hepatic manifestation of metabolic syndrome [7]. The pathophysiology of NAFLD has led to several pharmacologic trials; however, none of them has yet been approved. Numerous studies have reported that weight reduction may improve hepatic steatosis and associated metabolic parameters [8]. Thus, weight loss is the primary goal of therapy and is recommended in numerous clinical guidelines for the management of NAFLD [9]. However, only a few patients achieved target weight loss and frequently failed to maintain adequate body weight in the long term [10]. Repeated patterns of weight loss and gain are called weight cycling. Recently, researchers have reported on weight cycling and its negative health consequences [11,12], and it is unclear whether weight fluctuation induces unfavorable changes in the liver. To our knowledge, few studies have been conducted to evaluate the association between weight fluctuation and the risk of NAFLD. Therefore, the aim of this study was to assess the association between weight fluctuation and NAFLD in a population without diabetes.
METHODS
Source of data
This study is part of the Kangbuk Samsung Health Study, which includes participants from a medical health screening program at the Health Promotion Center of Kangbuk Samsung Hospital, Seoul and Suwon, Korea. In Korea, it is mandatory for every employee to undergo regular health-checkup programs to enhance the early detection of disease. Most of the participants are employees and their family members, belonging to various industrial companies countrywide. The medical examinations are largely paid for by employers, and a considerable proportion of the examinees undergo examinations annually or biannually.
This study was approved by the Institutional Review Board of Kangbuk Samsung Hospital of Korea (KBSMC 2020-11-019). Anonymous, unidentifiable information was used for the analysis. Therefore, the requirement for informed consent was waived.
Study population and design
Among the participants of the general health-checkup program, we selected 30,708 aged ≥18 years who had undergone annual health examinations for 5 consecutive years, from January 2010 to December 2014. To examine the relationships between weight fluctuation and incident NAFLD, we excluded participants with NAFLD at baseline (n=9,017). Since insulin resistance is associated with the pathophysiology of NAFLD, 1,110 participants with diabetes (defined by fasting blood glucose [FBG] level ≥126 mg/dL, glycated hemoglobin [HbA1c] ≥6.5%, or self-reported history of diabetes) were excluded at baseline. Individuals with positive hepatitis viral serology results, those who self-reported having a chronic liver disease, such as hepatitis or hepatocellular carcinoma, and heavy alcohol drinkers were excluded. We also excluded participants with a history of any kind of malignancy (n=721) or history of medication (n=246). Further, subjects with missing data were excluded (n=2,323). A total of 15,340 participants were included in the final analyses. Supplemental Fig. S1 shows the process used to select study participants for this study.
Anthropometric and laboratory measurement
Data on medical history, medication use, and health-related behaviors were collected through a self-administered questionnaire. Physical measurements and serum biochemical parameters were obtained by trained staff after 12 hours of fasting. The questionnaire was based on the fourth Korea National Health and Nutritional Examination Survey [13] and the Korean version of the International Physical Activity Questionnaire short form [14]. Information on smoking and alcohol consumption was obtained using the aforementioned questionnaires. In this study, heavy alcohol consumption was defined as a daily alcohol consumption ≥30 g for men and ≥20 g for women. Regular exercise was defined as performing >30 minutes of moderate physical activity at least five times per week or >20 minutes of strenuous physical activity at least three times per week.
Body mass index (BMI) was defined as body weight in kilograms divided by the square of the height in meters squared. A BMI cut off of 25 kg/m2 was used to define obesity in this Korean study population. Systolic and diastolic blood pressures (BPs) were measured using a standardized sphygmomanometer.
HbA1c, FBG, aspartate transaminase (AST), alanine aminotransferase (ALT), total cholesterol, triglyceride, high-density lipoprotein cholesterol, and low-density lipoprotein cholesterol (LDL-C) levels were measured after 12 hours of fasting. The presence of diabetes was defined according to the following criteria: (1) having a self-reported history of diabetes, current use of an oral antidiabetic agent, or insulin use at baseline or (2) FBG level ≥126 mg/dL or HbA1c level ≥6.5%. Estimated glomerular filtration rate was calculated using the Chronic Kidney Disease Epidemiology Collaboration equation [15]. Insulin resistance was assessed using the homeostatic model assessment of insulin resistance (HOMA-IR) equation [16].
Measurement of weight variability
The differences (D1) in body weight between 2 consecutive years were calculated by subtracting the body weight in the first year (W1) from that in the second year (W2) (D1=W2−W1). Subsequently, the difference was transformed into an absolute value to obtain the absolute change in body weight between the 2 years (|D1|). We calculated the average successive variability of weight (ASVW) by adding the four |Dy|s and dividing the result by 4 [12]. The formula used to calculate an individual’s ASVW is as follows: ASVW=(|D1|+|D2|+|D3|+|D4|)/4. Body weight variability was also assessed by coefficient of variation (CV) [17].
Definition of weight stability
The stability of the body weight was defined according to the difference in body weight between the final examination (W2014) and baseline examination (W2010). We defined “stable weight” as <5% weight change, “increased weight” as ≥5% weight gain, and “decreased weight” as ≥5% weight loss [18]. Thereafter, participants were divided into the following six groups according to the stability of body weight over 4 years and the ASVW: stable weight and low ASVW, stable weight and high ASVW, increased weight and low ASVW, increased weight and high ASVW, decreased weight and low ASVW, and decreased weight and high ASVW. We conducted same analysis using CV instead of ASVW.
Diagnosis of nonalcoholic fatty liver disease
The endpoint of this study was the detection of newly diagnosed NAFLD on abdominal ultrasonography (Logic Q700 MR, GE, Milwaukee, WI, USA). NAFLD was identified based on known standard criteria, including hepatorenal echo contrast, liver brightness, and vascular blurring using a 3.5-MHz probe. Eleven experienced radiologists who were unaware of this study and were blinded to the clinical status of the subjects performed the ultrasound examinations. The inter- and intra-observer reliabilities of fatty liver diagnosis were high, with kappa statistics of 0.74 and 0.94, respectively [19].
Statistical analysis
Continuous variables are presented as mean±standard deviation. Categorical variables are expressed as numbers (percentages). Right-skewed variables (i.e., HOMA-IR, AST, ALT, and alcohol intake) underwent logarithmic transformation for analysis. The Student’s t test for continuous variables and chi-square test for categorical variables were used to compare baseline characteristics between subjects who developed NAFLD and those who did not. The analyses were performed in the following ASVW quartile groups: <1.13, 1.13–1.625, 1.625–2.33, and ≥2.33 kg. In addition, the participants were divided into the following two groups according to the median ASVW: high and low. The median ASVW was 1.625kg and the median CV was 2.71 kg. Logistic regression analysis was performed to evaluate the odds ratio (OR) of NAFLD development, according to the quartiles of weight variability after adjusting for confounding variables. The following variables were entered into logistic regression models: age, sex, FBG, systolic BP, triglyceride, LDL-C, smoking amount, alcohol intake, and frequency of vigorous exercise. Statistical significance was defined as a two-sided P value <0.05. All statistical analyses were performed using STATA version 16.1 (StataCorp, College Station, TX, USA).
RESULTS
Baseline characteristics of study participants according to the development of NAFLD after 4 years
The characteristics of the participants at baseline are presented in Table 1. The participants’ mean age was 38.1 years, and 42.5% of them were men. Among all 15,340 participants, 2,406 (15.7%) developed NAFLD after 4 years. Those who developed NAFLD were more likely to have obesity, have higher total cholesterol and LDL-C levels, and have higher FBG levels compared to participants who did not develop NAFLD. Participants who developed NAFLD after 4 years also had higher mean HOMA-IR values than those who did not develop NAFLD (1.32±0.72 vs. 1.05±0.59). When the baseline metabolic parameters were compared according to ASVW quartiles (Supplemental Table S1), those in the highest ASVW quartile were younger and more obese than those in other groups. Participants in the highest ASVW quartile had worse metabolic parameters than those of participants in other groups, including FBG, HOMA-IR, total cholesterol, and LDL-C.

Characteristics of Participants According to the Presence of Fatty Liver Disease
Risk of NAFLD according to the quartiles of variability of body weight
The proportion of participants with NAFLD increased linearly from the first to the fourth ASVW quartile (9.3%, 13.1%, 16.8%, and 23.4%; P for trend <0.001) (Fig. 1). When the OR for incident NAFLD was analyzed according to ASVW and CV quartiles (Table 2), the risk of NAFLD increased linearly as ASVW and CV quartiles increased from the first to the fourth. After adjustment for various confounding variables, the ORs attenuated; however, a higher risk of NAFLD in participants with high ASVW and high CV was still observed (adjusted OR, 1.89; 95% confidence interval [CI], 1.63 to 2.19; and adjusted OR, 2.83; 95% CI, 2.45 to 3.26, respectively).
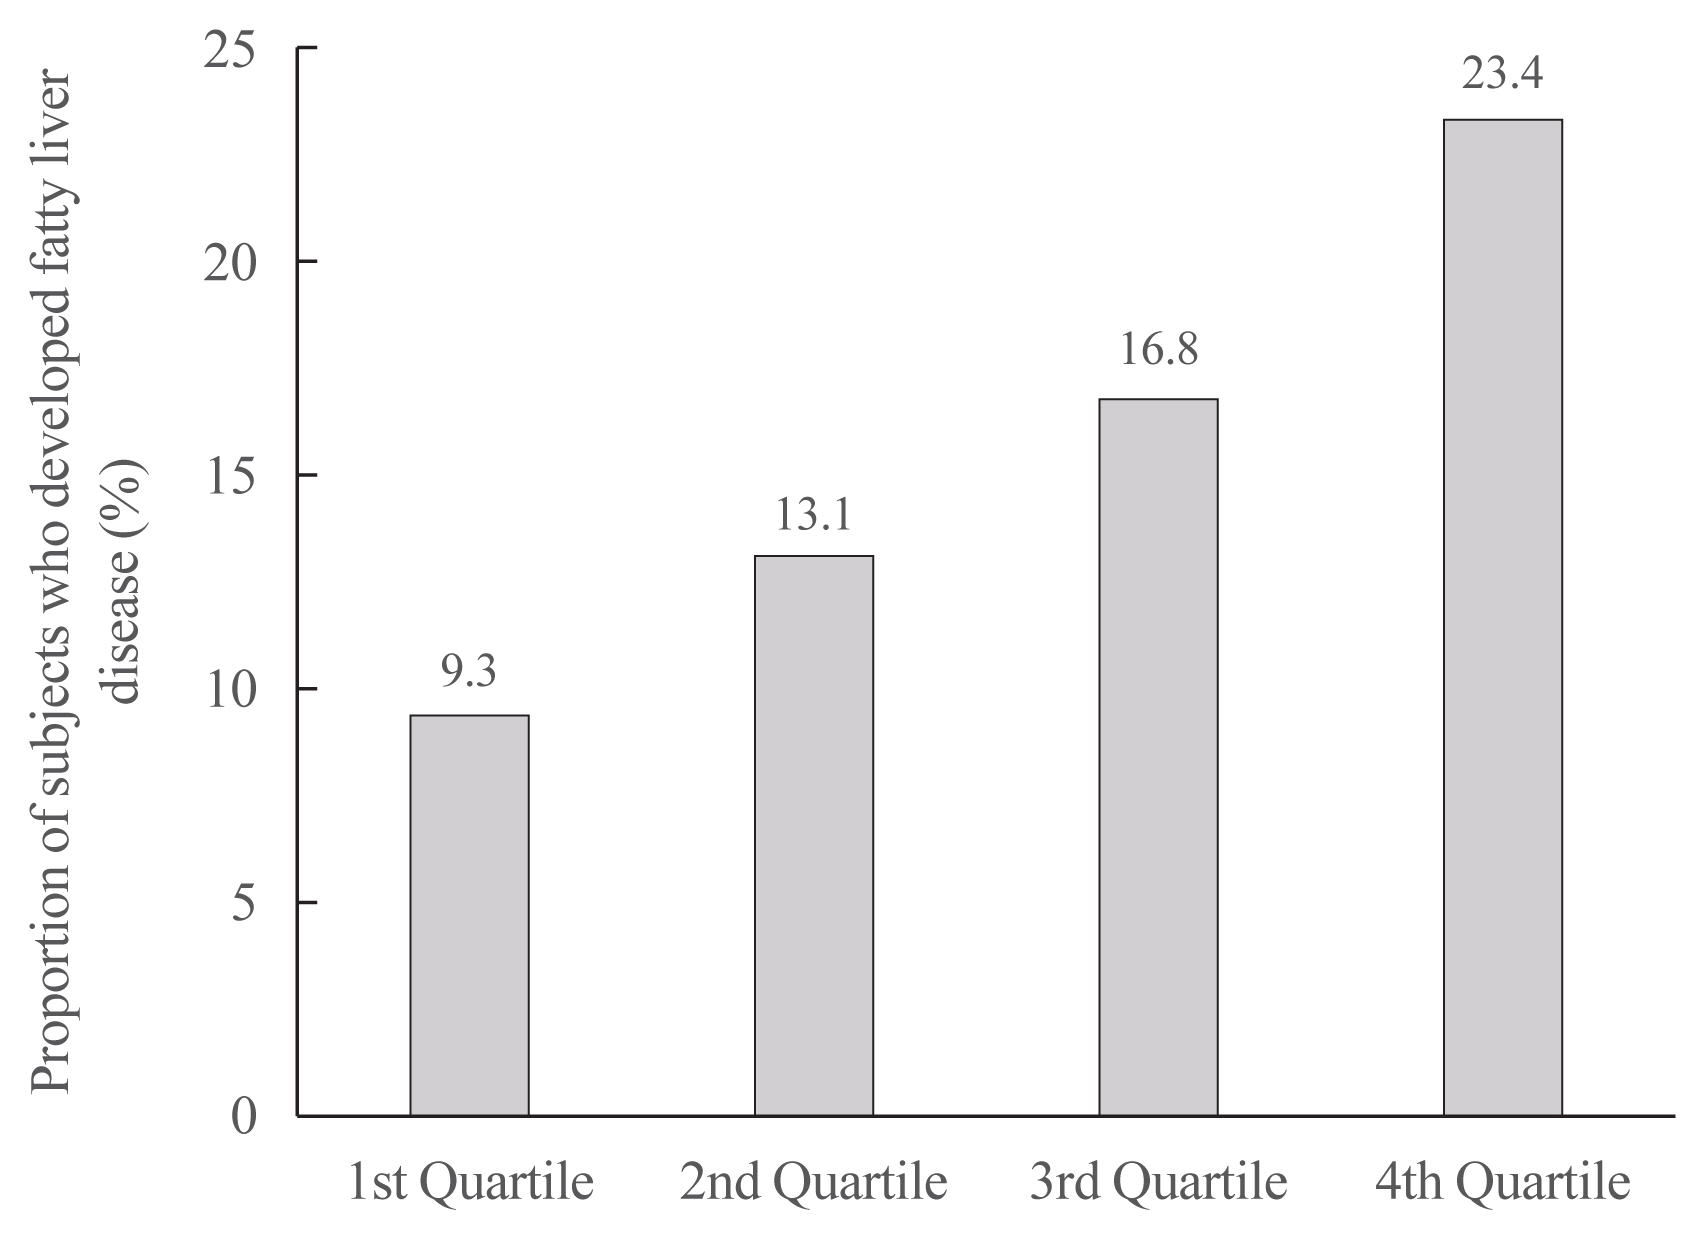
The proportion of participants with nonalcoholic fatty liver disease according to quartiles of the average successive variability of body weight. Cut off value for average successive variability of weight: 1st quartile (<1.13 kg), 2nd quartile (1.13–1.625 kg), 3rd quartile (1.625–2.33 kg), 4th quartile (≥2.33 kg).

Risk of Nonalcoholic Fatty Liver Disease According to the Quartiles of Body Weight Variability
Risk of NAFLD development according to baseline obesity status and variability of body weight
Table 3 presents the risk of NAFLD according to baseline obesity status and weight variability. When the participants were divided into four groups according to their obesity status and weight variability, the lowest incidence of NAFLD was observed in the non-obese and low ASVW group. When the OR for NAFLD development was analyzed in these groups, those in the non-obese and high ASVW group had higher ORs than those in the non-obese and low ASVW group (OR, 1.80; 95% CI, 1.61 to 2.01). Similar results were observed in the analysis using CV instead of ASVW. Participants in the non-obese and high CV group showed higher risk for NAFLD than those in the non-obese and low CV group (OR, 2.05; 95% CI, 1.84 to 2.29). Participants with obesity at baseline showed a significantly increased risk of incident NAFLD regardless of their weight variability after adjusting for confounding variables including HOMA-IR and HbA1c.

Risk of NAFLD Development According to Obesity Status at Baseline and Body Weight Variability
Risk of NAFLD according to the stability of body weight over 4 years and average successive variability of body weight
When we divided participants into six groups according to the stability of body weight over 4 years and the weight variability (Fig. 2), those with a high ASVW or high CV showed higher ORs for NAFLD than those with a low ASVW or low CV. Participants with increased weight over 4 years and high ASVW showed the highest risk of NAFLD compared to those with stable weight and low ASVW (OR, 4.87; 95% CI, 4.29 to 5.53). Participants with increased weight over 4 years and high CV showed higher risk for NAFLD than those with stable weight and low CV (OR, 4.10; 95% CI, 3.65 to 4.60). Even in participants with stable weight, those with high weight variability were at risk of NAFLD compared to those with low weight variability. Among participants who lost weight over 4 years, those with a high variability of body weight showed a higher incidence of NAFLD (Supplemental Fig. S2).
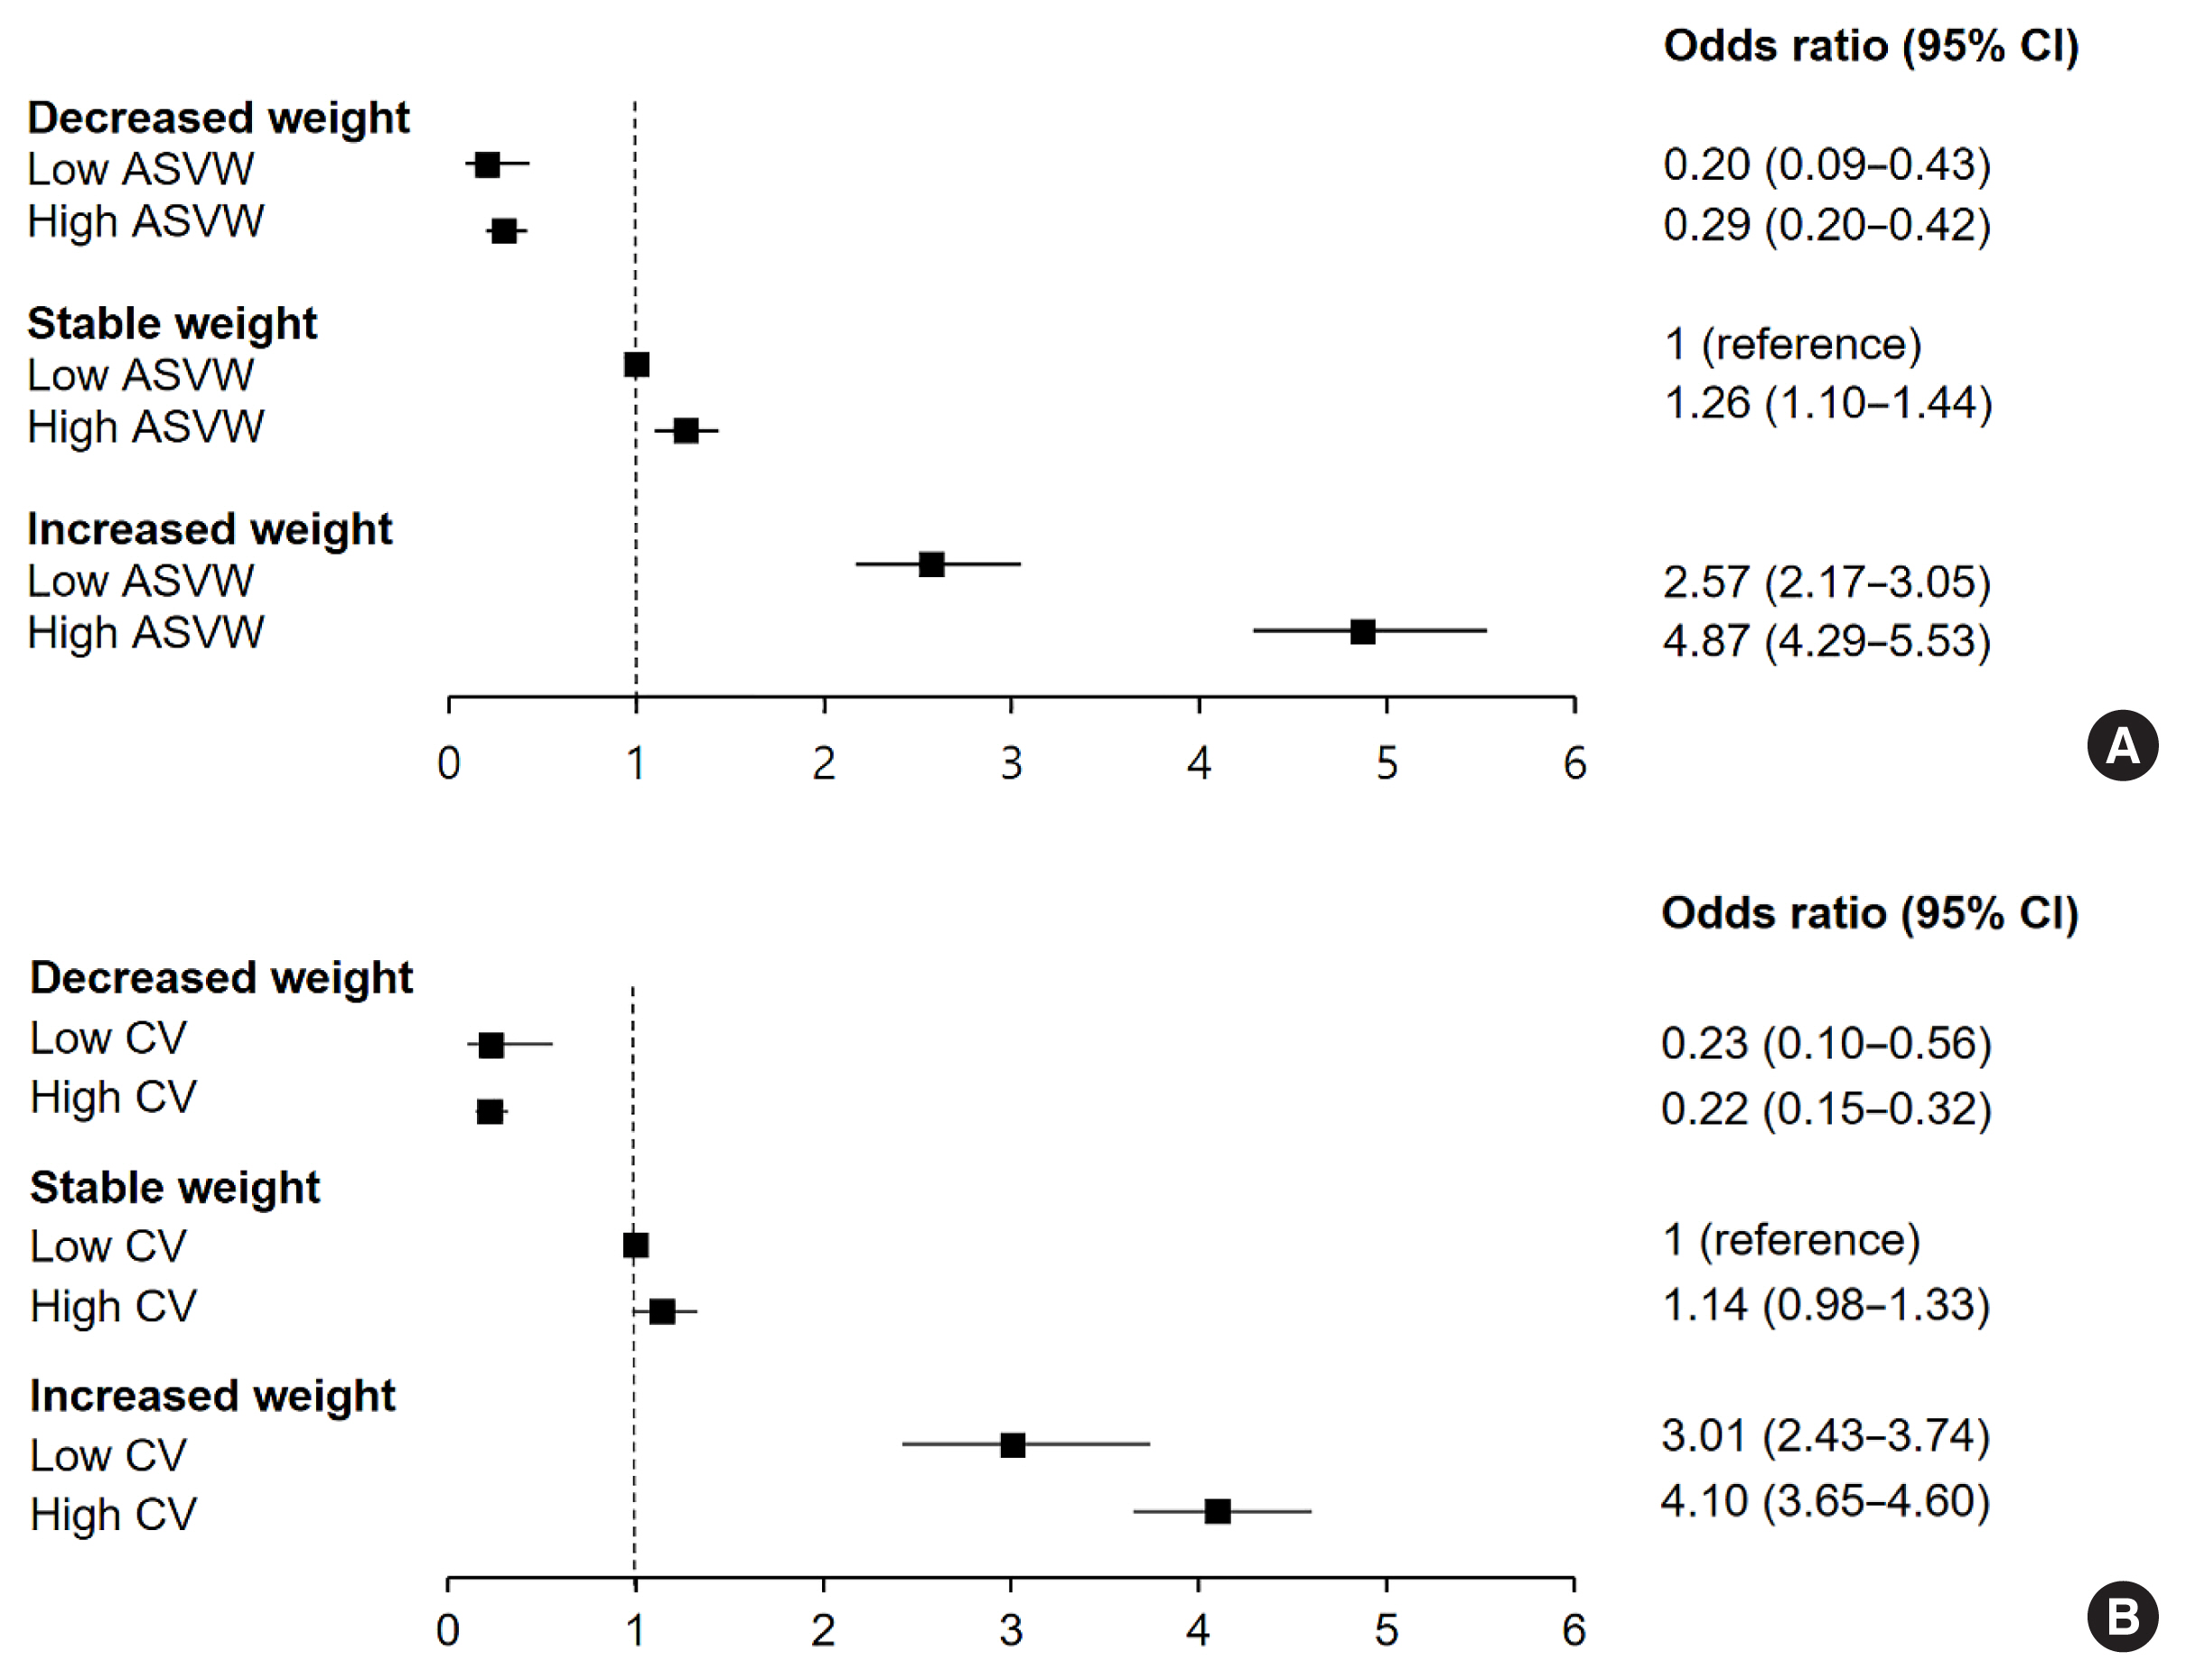
Risk of nonalcoholic fatty liver disease (NAFLD) according to the stability of body weight over 4 years and body weight variability. (A) Body weight variability was assessed by average successive variability of weight (ASVW). (B) Body weight variability was assessed by coefficient of variation (CV). CI, confidence interval.
Risk of NAFLD in participants without transitions in obesity status from baseline to follow-up according to the variability of body weight
We divided participants into four groups according to transitions in obesity status from baseline to follow-up as follows: non-obese to non-obese with low ASVW, non-obese to non-obese with high ASVW, obese to obese with low ASVW, and obese to obese with high ASVW. When the risk of NAFLD development was analyzed in these four groups (Table 4), participants who had obesity in succession with high ASVW had the highest risk of NAFLD, using the continuously non-obese, low ASVW group as the reference (OR, 4.85; 95% CI, 4.11 to 5.72). Those who were continuously without obesity with high ASVW showed an increased risk of NAFLD compared to the reference group (OR, 1.39; 95% CI, 1.22 to 1.57). Similar results were observed in the analysis using CV instead of ASVW.

Risk of NAFLD in Participants without Transitions between Obesity Status from Baseline to Follow-up According to the Variability of Body Weight
DISCUSSION
Obesity with subsequent insulin resistance plays a key role in the pathogenesis of NAFLD. Therefore, previous studies have suggested that weight reductions may induce resolution of steatohepatitis or improve hepatic fibrosis [20]. However, the majority of individuals who lose weight have difficulty maintaining the reduced weight for an extended period of time [21]. To the best of our knowledge, no study has identified the relationship between weight variability in healthy people and the risk of NAFLD, especially in a large cohort.
In the present study, we found that fluctuations in body weight over 4 years were significantly associated with increased NAFLD risk. Individuals with greater ASVW and greater CV were associated with a higher incidence and higher risk of NAFLD compared to those with reference-weight variability. Among participants without obesity and even among those who constantly had no obesity, those who had large fluctuations in body weight had a higher risk of NAFLD after adjusting for confounding variables. As expected, the increased risk of NAFLD became greater among individuals who gained weight over 4 years with high ASVW or high CV.
Many studies have suggested that fluctuations in body weight may have negative health outcomes. The Framingham Heart Study reported increased mortality and morbidity due to coronary heart disease in subjects with highly variable body weights [12]. In a Korean nationwide cohort study, high variabilities in body weight were associated with higher risks of cardiovascular disease and all-cause mortality [22]. We provided evidence that weight cycling was associated with the development of diabetes [23], and the findings of the present study are in line with the results of previous studies.
The mechanisms behind the relationship between weight fluctuation and NAFLD are unclear; nevertheless, several hypotheses have been proposed to explain this phenomenon. Insulin resistance and hyperinsulinemia resulting from weight fluctuation are considered key components in the pathogenesis of NAFLD [24]. A plausible mechanism responsible for insulin resistance is that of changes in fat distribution and increased percentage of body fat followed by weight cycling. Previous studies reported that weight cycling may cause a redistribution of body fat to the upper body compartment, strengthening the risk of metabolic diseases, including fatty liver disease [25–27]. This alteration in body composition is associated with insulin resistance and induces alterations in fatty-acid metabolism [28,29]. In our cohort of young and middle-aged participants without diabetes, participants in the highest ASVW quartile had higher HOMA-IR values than in those from other quartiles (Supplemental Table S1).
Our findings support the hypothesis that weight fluctuation has unfavorable effects on various health outcomes. However, our study had several limitations. First, NAFLD was diagnosed using abdominal ultrasonography and not liver biopsy. Although liver biopsy is the gold standard method for the diagnosis of fatty liver, it is invasive and unsuitable as a screening tool, especially in a large-scale cohort study. Recent studies have demonstrated that validated NAFLD predictive models overcame the limitation of ultrasonography-based diagnoses [30]. Second, previous researches on weight variability as a predictor of NAFLD are limited. Therefore, the appropriate interval for measuring weight variability has not been determined. Since we used data from annual health check-up program, we could not calculate short-term weight variability, which might be related with the pathogenesis of NAFLD. The lack of consensus about the formula of weight variability is another limitation of this study. Obese individuals are more likely to experience severe weight cycling [31]. We calculated weight variability using ASVW and CV with raw weight based on previous studies. However, raw weight and BMI doesn’t reflect the actual body fat composition [32]. Additional studies using variability of percentage body fat (% Fat) should be performed in the future.
Also, our study was unable to distinguish intentional weight change from unintentional weight change. We excluded participants with malignancy and those with a history of certain medication to minimize the possible effects of unintentional weight change. However, we did not consider participants’ emotional distress, their psychological status or presence of eating disorders. We could not completely rule out the possibility of selection bias and unknown behavioral factors affecting body weight.
Moreover, our results were derived from a database of relatively healthy young and middle-aged Koreans who regularly participated in a health-checkup program. Those who regularly receive a health-checkup are likely to have healthier lifestyles involving good diets. Both diet and daily calorie intake are important factors that result in weight change and subsequent NAFLD; therefore, the lack of these data is another limitation of our study. However, we observed associations between weight fluctuations and increased risk of NAFLD consistently after adjustment for health-related habits, including smoking status, alcohol consumption, and frequency of regular exercise. Additional studies using data with diet information should be performed in multiple institutions and in different ethnicities in the future. Finally, the cross-sectional design of our study is limited in its ability to determine causality. Longitudinal prospective studies should be conducted in the future.
Despite these limitations, our study has several strengths. First, this study has a large sample size of relatively young and healthy participants without diabetes, providing the independent contribution of weight fluctuation on the development of NAFLD. Second, we classified study subjects in various ways to evaluate the effects of weight variability and weight stability. Third, we performed sensitivity analyses to prove the robustness of our results. A sensitivity analysis in which we evaluated NAFLD outcomes using the fatty liver index yielded similar results (Supplemental Table S2) [33].
In this large cohort study of young and middle-aged adults without diabetes, weight fluctuation was significantly associated with an increased risk of developing NAFLD. Weight reduction through diet and lifestyle changes is recommended for the prevention and management of NAFLD. Once a desirable body weight is achieved, further effort is required to minimize weight fluctuations and maintain a healthy weight.
Supplementary Information
Baseline Characteristics of Participants According to the Quartile of Average Successive Variability of Bodyweight
Risk for NAFLD (Fatty Liver Index ≥60) According to the Quartile of Average Successive Variability of Bodyweight
Flow chart of study participants. NAFLD, nonalcoholic fatty liver disease.
The proportion of participants with nonalcoholic fatty liver disease according to the stability of body weight over 4 years and the average successive variability of body weight.
Acknowledgements
The authors acknowledge the efforts of the Department of R&D Management at Kangbuk Samsung Hospital, Korea, in editing figures and tables.
Notes
CONFLICTS OF INTEREST
No potential conflict of interest relevant to this article was reported.
AUTHOR CONTRIBUTIONS
Conception or design: I.J., E.J.R., W.Y.L. Acquisition, analysis, or interpretation of data: D.J.K., M.Y.L., S.J.M. Drafting the work or revising: I.J., H.K., S.E.P., E.J.R., W.Y.L. Final approval of the manuscript: I.J., D.J.K., M.Y.L., S.J.M., H.K., S.E.P., E.J.R., W.Y.L.