Identification of Healthy and Unhealthy Lifestyles by a Wearable Activity Tracker in Type 2 Diabetes: A Machine Learning-Based Analysis
Article information

Abstract
Lifestyle is a critical aspect of diabetes management. We aimed to define a healthy lifestyle using objectively measured parameters obtained from a wearable activity tracker (Fitbit) in patients with type 2 diabetes. This prospective observational study included 24 patients (mean age, 46.8 years) with type 2 diabetes. Expectation–maximization clustering analysis produced two groups: A (n=9) and B (n=15). Group A had a higher daily step count, lower resting heart rate, longer sleep duration, and lower mean time differences in going to sleep and waking up than group B. A Shapley additive explanation summary analysis indicated that sleep-related factors were key elements for clustering. The mean hemoglobin A1c level was 0.3 percentage points lower at the end of follow-up in group A than in group B. Factors related to regular sleep patterns could be possible determinants of lifestyle clustering in patients with type 2 diabetes.
INTRODUCTION
The importance of lifestyle modifications for the prevention and management of type 2 diabetes (T2D) has been increasingly recognized [1,2]. However, we still do not have enough answers about what a healthy lifestyle is and to what extent it affects diabetes management. Research on lifestyle is largely dependent on individuals’ subjective reports and memories, limiting the reliability of those reports. Therefore, objective measures of lifestyle elements are an important issue in this field [3,4].
A wearable activity tracker is an electronic device attached to the body surface, which tracks and monitors health-related behaviors, including step counts, heart rates (HRs), and sleep patterns [4]. It continuously generates health-related data and provides significant value in patient care [5]. However, few studies have established the actual application of these data from wearable activity trackers for glycemic control.
In this study, we aimed to classify healthy and unhealthy lifestyle habits and identify elements that are major determinants of these classifications in patients with T2D. We used machine-learning-based clustering based on prospectively collected measures using the wearable activity tracker Fitbit (Fitbit, San Francisco, CA, USA).
METHODS
This was a single-center prospective observational study of patients with T2D. Eligible participants were recruited from the outpatient diabetes clinic of Korea University Anam Hospital between April 2019 and December 2019. The age of the participants was limited to 29–60 years because it was important for the participants to use wearable devices and mobile applications correctly. The exclusion criteria are also presented in the Supplemental Methods. Written informed consent was obtained from all participants after explaining the study in detail to them. This study was approved by the Institutional Review Board of Korea University Anam Hospital (IRB No. 2019AN0045).
The overall scheme of this study is shown in Supplemental Fig. S1. On the day of the first visit, the participants were provided with a Fitbit Charge 2 with the corresponding application. The raw and processed variables evaluated from the Fitbit tracker were described using the following main categories: (1) activity, (2) HR, and (3) sleep (Supplemental Table S1). The processed variables were mainly related to variability in the circadian changes of each measured parameter [6].
We used an expectation-maximization (EM) algorithm for group clustering. EM is a type of clustering algorithm used in unsupervised machine learning to divide data into a specific number of groups [7]. Furthermore, we analyzed the associations between lifestyle factors and their grouping using the Shapley additive explanation (SHAP) values [8,9]. Statistical significance was set at P<0.05. All statistical analyses and data preparation were performed using the R software (R Foundation for Statistical Computing, Vienna, Austria; www.r-project.org).
RESULTS
The mean age of the 24 participants was 48.3±8.7 years. Fourteen (58.3%) patients were male. The mean body mass index was 28.0±5.3 kg/m2 and the mean baseline hemoglobin A1c (HbA1c) was 7.4%±0.8%. EM cluster analysis based on activity tracker-derived measures produced two groups: A (n=9) and B (n=15). The baseline characteristics of the groups are shown in Supplemental Results and Supplemental Table S2. Supplemental Fig. S2 shows the main variables derived from activity trackers in groups A and B. Participants in groups A had higher daily step counts and lower average resting HRs than those in group B. The standard deviation of HR_consistency tended to be lower in group A than in group B. Additionally, higher values of HR_misalignment were observed in group B than in group A, although the difference was not statistically significant. The mean sleep duration was longer in group A than in group B. With regard to sleep-related variables, participants in group A had significantly lower mean time differences in going to sleep and waking up, indicating that they had a more regular sleep cycle than those in group B.
We generated a SHAP summary plot to identify the relative contributions of each parameter to the clustering of groups (Fig. 1) [8]. Interestingly, higher mean time differences in going to sleep and waking up were associated with the unhealthy group (group B), with large impacts on the model. Furthermore, lower mean step counts, a higher mean resting HR, a higher standard deviation of HR_consistency, a shorter mean sleep duration, and a higher standard deviation of the time difference in going to sleep and waking up were associated with a higher likelihood of belonging to the unhealthy group (group B). Fig. 2 shows the changes in the mean HbA1c levels in both groups. After 3 months of wearing the activity tracker, group A had lower HbA1c levels than group B. This difference in HbA1c was maintained for 6 months after participants discontinued using the activity tracker, leading to a gap of 0.33 percentage points between the groups, although it did not reach statistical significance.

Shapley additive explanations (SHAP) summary plot for expectation–maximization clustering. Red and blue represent high and low levels of each predictor, respectively. The x-axis represents SHAP values. A positive SHAP value means the likelihood of an unhealthy lifestyle, whereas a negative value means the likelihood of a healthy lifestyle. HR, heart rate; SD, standard deviation.
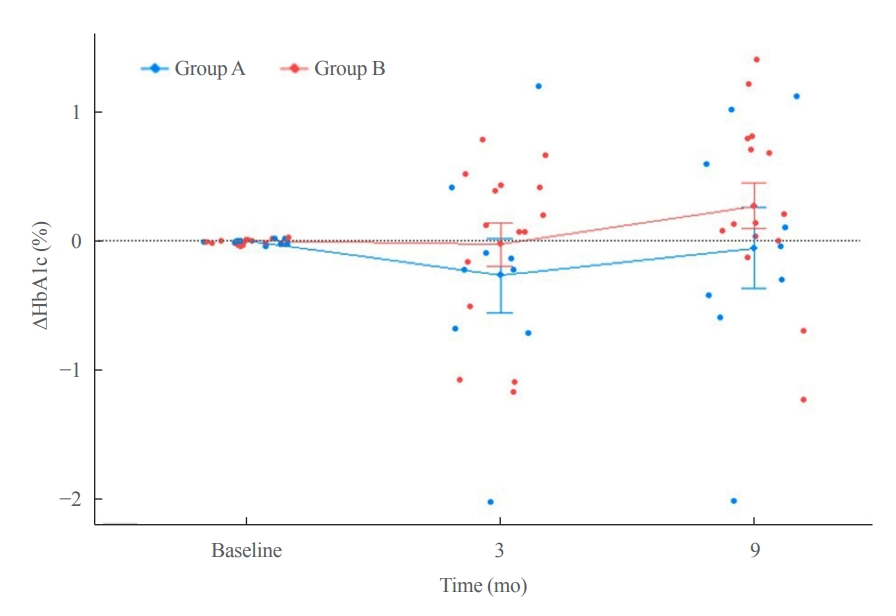
Mean changes in hemoglobin A1c (HbA1c) levels from baseline to 9 months.
DISCUSSION
In this study, we found that healthy and unhealthy lifestyles could be defined with the help of objectively measured information obtained from wearable activity trackers. Sleep habits and quality aligned with circadian rhythms and adequate sleep duration were major determinants of healthy and unhealthy lifestyles. The healthy lifestyle defined in this study was also associated with favorable glycemic control.
Interest in mobile healthcare and the development of information technology seems to have driven the rapid growth in the application of these technologies [10]. An activity tracker has the effect of an intervention because it shows users’ health-related information in real time. In addition, the large amount of information obtained through this device could be utilized for research purposes [11]. Researchers may also incorporate lifestyle information into studies of behavioral intervention and monitoring programs to improve the management of various types of disease [4]. Our study also suggested that parameters collected by an activity tracker could be used to improve clinicians’ ability to identify healthy and unhealthy lifestyles beyond self-reported information provided by patients with T2D.
Notably, our study showed that sleep irregularity was a major risk factor for an unhealthy lifestyle associated with unfavorable glycemic control. Previous studies have found that disturbed sleep can increase the risk of obesity, diabetes, and metabolic diseases [12,13]. Studies on shift workers have supported the importance of sleep, connecting irregular lifestyle patterns with sleep disturbance to unhealthy outcomes, including poor glycemic control [14]. Even though both sleep duration and sleep quality are crucial for metabolic health, recent evidence indicates that variability in sleep timing is also associated with an increased risk of cardiometabolic outcomes [15,16]. The effects of sleep irregularity on metabolic abnormalities may contribute to circadian disruption, followed by changes in sympathovagal balance and increased circulation levels of endocrine hormones [15,17]. Since this study was not an interventional study, it would be difficult to argue that establishing regular sleep habits is more important than any other factor. However, it is meaningful that this study proved the importance of regular sleep as a marker of a healthy lifestyle.
This study had several limitations. First, the sample size was small. However, the data related to lifestyle within each patient were not small because their wearable activity trackers generated a tremendous amount of lifelog data. Second, information about dietary habits was not included because of the lack of reliability of app-based measures. Third, the participants enrolled in this study were quite young, which may limit the generalizability of the results.
In conclusion, we reported that healthier lifestyle traits were objectively identified by using a wearable activity tracker. Regular sleep patterns and a lifestyle aligned with circadian rhythms could be possible indicators of a healthy lifestyle and favorable glycemic control.
Acknowledgements
Some parts of this article were presented at the 2021 Korean Diabetes Association (Journal of Diabetes Investigation). This work was supported by the Korea Medical Device Development Fund grant funded by the Korean government (the Ministry of Science and ICT, the Ministry of Trade, Industry and Energy, the Ministry of Health & Welfare, the Ministry of Food and Drug Safety, the National Research Foundation of Korea) (Project Number:1711139102, KMDF_PR_20210527_0003-2022-02) and a Korea University Grant.
Notes
CONFLICTS OF INTEREST
No potential conflict of interest relevant to this article was reported.
AUTHOR CONTRIBUTION
Conception or design: K.J.K., H.J.L., N.H.K. Acquisition, analysis, or interpretation of data: K.J.K., J.B.L., J.C., J.Y.S., J.W.Y., C.H.C., J.H.B., S.G.K., H.J.L., N.H.K. Drafting the work or revising: K.J.K., J.B.L., N.H.K. Final approval of the manuscript: K.J.K., J.B.L., J.C., J.Y.S., J.W.Y., C.H.C., J.H.B., S.G.K., H.J.L., N.H.K.
Supplementary Information
Definitions Were Used for Basic Features to Check the Circadian Rhythm in This Study
Baseline Clinical Characteristics by Pooled Clusters
Study design and flow. T2DM, type 2 diabetes mellitus; P/Ex, physical examination.
Supplemental Fig. S2. Comparison of variables derived from the activity tracker between Group A (blue) and Group B (red). HR, heart rate; SD, standard deviation.