A Novel Index Using Soluble CD36 Is Associated with the Prevalence of Type 2 Diabetes Mellitus: Comparison Study with Triglyceride-Glucose Index
Article information

Abstract
Background
Plasma soluble cluster determinant 36 (sCD36) level is closely related with insulin resistance and atherosclerosis, but little is known whether it could be a surrogate for estimating risk of developing diabetes or not. To address this, we evaluated association between sCD36 index, the product of sCD36 and fasting plasma glucose (FPG), and the prevalence of type 2 diabetes mellitus (T2DM), and then compared with triglyceride-glucose (TyG) index which has been suggested simple index for insulin resistance.
Methods
This was cross-sectional study, and participants were classified as normal glucose tolerance (NGT), prediabetes, and T2DM according to glucose tolerance. The formula of TyG index was ‘ln [FPG (mg/dL)×triglyceride (mg/dL)/2],’ and the sCD36 index was ‘ln [sCD36 (pg/mL)×FPG (mg/dL)/2].’
Results
One hundred and fifty-five subjects (mean age, 55.2 years) were enrolled, and patients with T2DM were 75. Both indexes were significantly increased in prediabetes and T2DM rather than NGT, and sCD36 index was positively correlated with both glycosylated hemoglobin and homeostasis model assessment of insulin resistance (r=0.767 and r=0.453, respectively; P<0.05) and negatively with homeostasis model assessment estimate of β-cell function (r=−0.317). The odds ratio (OR) of sCD36 index for T2DM was 4.39 (95% confidential interval, 1.51 to 12.77) after adjusting age, gender, blood pressure, smoking, alcohol, non-high density lipoprotein cholesterol and high-sensitivity C-reactive protein. However, OR of TyG index did not remained significance after adjustment.
Conclusion
sCD36 index has an independent association with the risk of T2DM, and showed better correlation than TyG index. These results suggest sCD36 index might be useful surrogate marker for the risk of diabetes.
INTRODUCTION
As the incidence and prevalence of type 2 diabetes mellitus (T2DM) continues to rise worldwide, estimating the risk of diabetes in general population becomes more important to minimize the high morbidity and increasing socioeconomic costs associated with this disease [12].
It is well established that insulin resistance precedes dysglycemia; thus, evaluating parameters associated with metabolic dysfunction (e.g., abdominal adiposity, dyslipidemia) could be helpful to predict the development of diabetes [34]. Even though hyperinsulinemic-euglycemic clamp study was suggested as a gold standard test measuring insulin resistance [5], it is not practical in real world due to the problem of time, labor, and cost. For these reasons, several simple indexes for estimating insulin resistance and the risk of diabetes have been suggested.
The triglyceride-glucose (TyG) index, the product of (fasting plasma glucose [FPG]) and triglycerides (TG), has been suggested as a simple surrogate of insulin resistance in healthy subjects [678]. Previous studies showed that the TyG index is correlated with insulin resistance using homeostasis model assessment of insulin resistance (HOMA-IR) [910], the insulin suppression test [7], and the hyperinsulinemic-euglycemic clamp [510]. However, the reliability of these indexes has been questioned because TG levels are easily affected by alcohol consumption or diet.
Cluster determinant 36 (CD36), a fatty acid transporter and scavenger receptor, is a transmembrane glycoprotein expressed on a variety of cells and tissues and has a number of tissue-specific functions [11]. CD36 is involved in lipid metabolism and homeostasis, and recently its up-regulation is reported to contribute to pancreatic β-cell dysfunction relevant to glucotoxicity [12131415]. In addition, plasma level of soluble CD36 (sCD36) has been strongly implicated in pathological conditions associated with metabolic dysregulation, including obesity, insulin resistance, diabetes, and atherosclerosis in large human trials [111617]. Thus, sCD36 is drawing attention as a novel biomarker of insulin resistance. However, little is known about the possible association between sCD36 and the risk of T2DM in the general population. To address this issue, sCD36 levels were assessed in individuals with normal glucose tolerance (NGT), prediabetes, and diabetes. Next, we calculated the TyG index and compared this prognostic formula (i.e., the sCD36 index) with the TyG index, to assess its usefulness in predicting the risk of T2DM.
METHODS
Study population
This was a cross-sectional study. Between January 2005 and April 2013, 159 subjects visiting the Yeungnam University Health Promotion Center and the Endocrinology Department, Daegu, Korea were enrolled. Informed consent was obtained from all individual participants included in the study. Their ages ranged from 32 to 79 years. Individuals having type 1 diabetes mellitus (n=3), severe anemia (hemoglobin <8 g/dL), chronic kidney disease (serum creatinine >1.5 mg/dL), and abnormal liver function test (total or direct bilirubin, aspartate transaminase, or alanine transaminase >2-fold of upper normal limits) were excluded. A patient was given pioglitazone was also excluded (n=1), because thiazolidinedione could affect plasma sCD36 level [18]. The study protocol was approved by the Institutional Review Board of Yeungnam University Medical Center (YUMC2014-11-002). All procedures followed were in accordance with the ethical standards of the responsible committee on human experimentation (institutional and national) and with the Helsinki Declaration of 1975, as revised in 2008. Diabetes and prediabetes (impaired fasting glucose and/or impaired glucose tolerance) were defined according to the guidelines of the American Diabetes Association [19]. The criteria for the diagnosis of diabetes were glycosylated hemoglobin (HbA1c) ≥6.5% or FPG ≥126 mg/dL. Self-reported diabetes medication use and/or self-reported medical diagnosis of diabetes (other than gestational diabetes) were also included. Prediabetes was defined as FPG 100 to 125 mg/dL or HbA1c 5.7% to 6.4%.
Clinical examination, laboratory measurements, and indexes
The waist circumference (WC) was measured in the morning, before breakfast, with light indoor clothing and no shoes, according to standard protocols. The body mass index (BMI) was calculated as weight (kg) divided by the square of height in meters (m2). Blood pressure was measured with a standard sphygmomanometer after at least 10 minutes of rest in the sitting position. Venous blood samples were obtained from each individual after a 12-hour overnight fast. FPG was measured using the hexokinase method (AU 5400 Autoanalyzer, Olympus, Tokyo, Japan). HbA1c was measured by high-performance liquid chromatography (HLC-723G7, Tosoh, Tokyo, Japan). Total cholesterol was measured by enzyme colorimetry (Kyowa Medex Co. Ltd., Tokyo, Japan). TG levels were measured using the glycerol elimination method. High density lipoprotein cholesterol (HDL-C) was measured using direct enzymatic assays (Kyowa Medex Co. Ltd.). Low density lipoprotein (LDL) cholesterol was calculated using Friedewald's formula. Insulin was measured using an immunoradiometric assay (DIAsource ImmunoAssays S.A., Ottignies-Louvain-la-Neuve, Belgium). The sCD36 was measured using ELISA (Aviscera Bioscience, Santa Clara, CA, USA). HOMA-IR was estimated with the formula: fasting insulin (U/mL)×FPG (mmol/L)/22.5 [20]. The TyG index was calculated as the ‘ln [FPG (mg/dL)×TG (mg/dL)/2].’ We used sCD36, has been known as surrogate marker of insulin resistance, substitute for TG and calculated sCD36 index as following: sCD36 index=ln [sCD36 (pg/mL)×FPG (mg/dL)/2].
Both the TyG index and the sCD36 index are expressed in a logarithmic scale.
Statistical analysis
All numerical variables were expressed as mean±standard deviation. Categorical data were expressed as percentages. Differences between more than two groups were estimated using one-way analysis of variance with Turkey post hoc test. Pearson correlation coefficient was calculated to express the strength of the relationship between continuous values. Multivariate logistic regression analyses were performed to estimate the odds ratio (OR) for the prevalence of T2DM using sCD36, TyG index, and sCD36 index. Receiver operating characteristic (ROC) curves were used to assess the ability of the surrogate measures for presence of T2DM. All statistical analyses were performed using IBM SPSS version 20.0 (IBM Co., Armonk, NY, USA). A value of P<0.05 was considered to indicate statistical significance.
RESULTS
A total of 155 subjects (90 men; mean age, 55.2±10.1 years) were finally included in this study. Participants were categorized into three groups: NGT (n=34), prediabetes (n=46), and T2DM (n=75); the baseline characteristics of the subjects are shown in Table 1. The overall means for sCD36, the TyG index, and the sCD36 index in the study population were 130.97±98.72 pg/mL, 8.80±0.91, and 9.37±1.17, respectively. There were no differences in age, sex, BMI, and smoking behavior among groups, whereas HDL-C was lower in the T2DM group than in the prediabetes and NGT groups (P<0.05). WC, systolic blood pressure (SBP), diastolic blood pressure (DBP), TG, FPG, HbA1c, insulin, HOMA-IR, and sCD36 were higher in the prediabetes and T2DM groups compared to those in NGT controls. In addition, both the TyG and the sCD36 indexes were found to be higher in prediabetes and T2DM group than in the NGT group (Fig. 1).

Clinical Characteristics of the Subjects
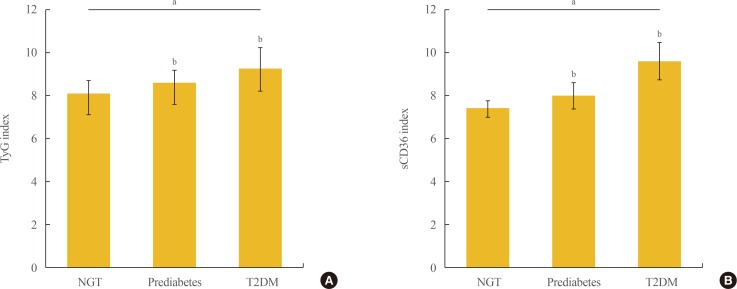
Comparison of triglyceride-glucose (TyG) index (A) and soluble cluster determinant 36 (sCD36) index (B) according to glucose tolerance. (A) TyG index was significantly increased in type 2 diabetes mellitus (T2DM) compared with normal glucose tolerance (NGT) and prediabetes. (B) sCD36 index was significantly increased in T2DM compared with NGT and prediabetes. Differences were analyzed by analysis of variance, followed by Tukey test, aP<0.05 for trends; bP<0.05 for post hoc analysis vs. NGT.
In linear correlation analyses, the TyG index and the sCD36 index were both significantly correlated with several metabolic variables related to diabetes (Table 2). Both indexes had positive correlation with HbA1c and HOMA-IR, and negative with homeostasis model assessment estimate of β-cell function. In particular, the sCD36 index was strongly correlated with the glycemic control status (r=0.767, P<0.001).

Correlations between TyG Index and sCD36 Index and Parameters in All Study Subjects
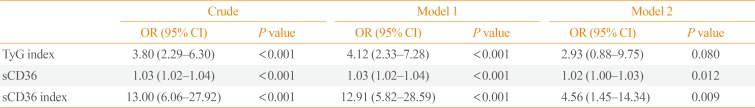
The possible association between the sCD36 index and the risk of T2DM was explored (Table 3). The OR of TyG index, plasma sCD36, and sCD36 index for the prevalence of T2DM were 3.81, 1.03, and 13.11, respectively (P<0.001) in logistic regression analysis. The sCD36 index was significantly associated with the risk of T2DM after adjustment for age, sex, BMI, SBP, DBP, smoking, non-HDL-C, and high-sensitivity C-reactive protein (OR, 4.39; 95% confidence interval, 1.51 to 12.77; P=0.007), but not the TyG index.

OR for TyG Index, sCD36, and sCD36 Index on the Prevalence of Type 2 Diabetes Mellitus
ROC curves of the sCD36 index for predicting T2DM are shown in Fig. 2. In regard to T2DM, the area under the ROC curve (AUC) for the sCD36 index and TyG index were 0.948 and 0.758, respectively, and AUC of sCD36 index was significantly higher than that of TyG index (P<0.001). ROC analysis showed that the sCD36 index had a slightly better performance than HOMA-IR (data not shown; AUC, 0.774; P<0.001) and the TyG index in identifying patients with T2DM.

Receiver operating characteristic (ROC) curves of triglyceride-glucose (TyG) index and soluble cluster determinant 36 (sCD36) index in the identification of type 2 diabetes mellitus. The area under the ROC curve for each index is in parentheses.
DISCUSSION
In this study, we found that sCD36 was increased according to abnormal glucose tolerance, and novel and simple index using sCD36 was closely correlated with glycemic status, insulin resistance, and β-cell dysfunction. Furthermore, an increment in sCD36 index was positively associated with the risk of T2DM even after adjusted by several risk factors. The sCD36 index showed better diagnostic value than TyG index.
Previous studies have indicated that sCD36 is strongly correlated with insulin resistance and the development of diabetes [17182122]. For instance, Handberg et al. [17] reported that sCD36 is up to 4.5-fold higher in plasma from obese T2DM patients than in lean healthy control subjects and is closely associated with insulin resistance [18]. Circulating CD36 was also shown to be associated with T2DM in chronic kidney disease patients [23] and was found to be increased in prediabetic conditions, such as in obese individuals and/or women with polycystic ovarian syndrome (PCOS), which often show progressive insulin resistance. In this regard, pioglitazone treatment has shown to reduce sCD36 while improving insulin-sensitivity in PCOS patients [1718]. Our result corroborates previous findings that the plasma CD36 level increased according to state of glucose tolerance and insulin resistance, so sCD36 is considered to be useful surrogate marker of diabetes and metabolic disorders.
The mechanism underlying the positive association between the sCD36 index and T2DM is unclear, but evidences implicate CD36 (either membrane bound form or free form) contribute development of insulin resistance and diabetes. CD36 plays an important role in fatty acid transport in many cell types, and mainly expressed in hepatocyte, adipose tissue, and skeletal muscle. During obesity and T2DM, recruitment of CD36 is reported to be enhanced in cellular membrane [242526] and cellular uptake of fatty acids also increased. Increased CD36-mediating fatty acids influx impair insulin sensitivity in liver and skeletal muscle, and it could lead to the development of T2DM [27]. Moreover, prolonged exposure to elevated levels of fatty acids causes lipotoxicity in pancreatic β-cells, leading to dysfunction and apoptosis [28]. Zhang et al. [29] found increased expressions of macrophage CD36 and increased levels of oxidized LDL (oxLDL) in a poorly controlled diabetic population compared with those in a controlled one. In addition, Kennedy and Kashyap et al. [30] demonstrated that oxLDL-induced CD36-dependent changes in adipocytes are associated with important physiologic correlates of insulin resistance in vitro, including impaired glucose uptake, adiponectin secretion, and increased lipolysis. CD36 expression is also associated with hepatic steatosis, leading to the development of insulin resistance and both local and systemic, low-grade inflammation, adding to the risk of diabetes [3132].
It is not still clear whether the increase in sCD36 is a cause or a result of metabolic disorders, but recent findings suggested the role of sCD36 involving the inflammation process. CD36 is located in the intracellular vesicles as an inactive form, and when exposed to a ligand, it is expressed to the cell membrane in an active form [33]. It has been reported that the level of cell derived microparticles is increased in diabetic conditions [34]. In accordance with this finding, recent studies suggested a possibility for shedding of the CD36 receptor in the soluble form from adipocyte, skeletal muscle, and renal tubular cells [35]. Increased level of CD36 expression on macrophage was reported in abnormal glucose tolerance, and it was positively correlated with the pro-inflammatory cytokine interleukin 6 levels [36]. CD36 expression on monocyte surface was also increased in patients with T2DM. Another study reported that CD36 involved in inflammation process in proximal tubular cells of kidney [35]. Thus, elevated level of sCD36 from macrophage and monocyte might contribute the inflammatory process in diabetic conditions. Taken together, these findings are thought to be the cause of diabetes, not the result, and CD36 might be a therapeutic target as well as biomarker in the diabetes.
Consistent with previous results, in this study, the TyG index was elevated in patients with T2DM compared with that in patients with NGT and prediabetes [8373839]. Despite its convenience from the clinical perspective, the accuracy of the TyG index could be limited. For instance, although TG was suggested to be an independent risk factor for diabetes [4041], TG levels are highly influenced by high carbohydrate diet, alcohol intake, and lifestyle factors such as physical activity. Nevertheless, in view of the convenience and relative low cost, TG measurements are widely performed in the clinical practice. In our study, the TyG index did not perform better than the HOMA-IR index, although its AUC was similar to that observed in a previous study [10]. In contrast, the sCD36 index showed better diagnostic performance and might be more useful than the TyG index in identifying individuals at a high risk of developing diabetes.
To the best of our knowledge, this is the first study proposing a prognostic formula that combines sCD36 and FPG to evaluate the risk of T2DM. Moreover, sCD36 index found to have better performance than index using TG. However, our study has certain limitations. First, the cross-sectional design of this study did not allow causal relationships to be determined. Second, some medications or medical conditions in our patient population may have affected the levels of sCD36, obscuring the actual impact of our findings [1418]. Third, the cost-effectiveness of the method needs to be assessed. To validate the usefulness of this index, prospective, large-scale studies are needed for populations at high risk for T2DM.
In conclusion, the sCD36 index was significantly increased in patients with T2DM than in peoples with normoglycemia or prediabetes. When compared with sCD36 alone or with the TyG index, the sCD36 index showed a better association with the risk of developing T2DM. These findings suggest that the sCD36 index might be useful to predict the development of diabetes and the presence of metabolic disorders associated with insulin resistance in the general population.
ACKNOWLEDGMENTS
This study was supported by research fund of Daegu-GyeongBuk Branch of Korean Endocrine Society (2016).
Notes
CONFLICTS OF INTEREST: No potential conflict of interest relevant to this article was reported.