Articles
- Page Path
- HOME > Endocrinol Metab > Volume 31(3); 2016 > Article
-
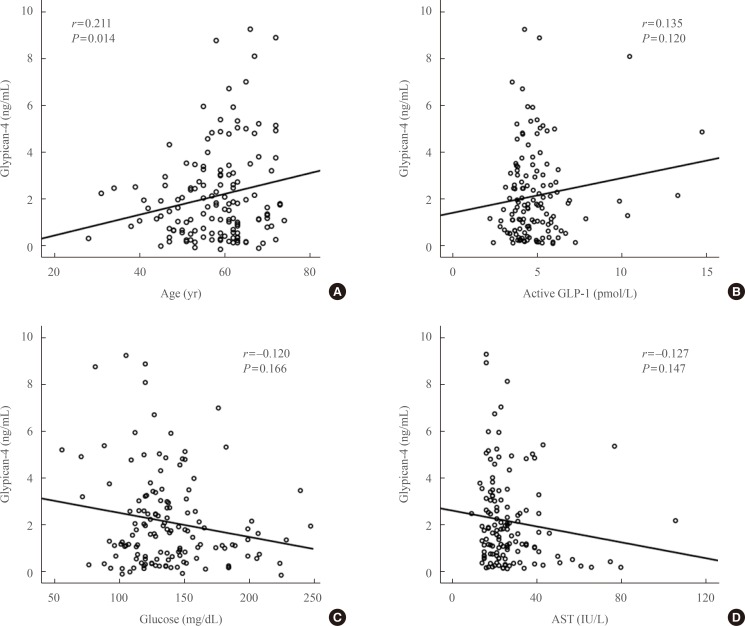
Original ArticleClinical Study Correlation of Glypican-4 Level with Basal Active Glucagon-Like Peptide 1 Level in Patients with Type 2 Diabetes Mellitus
-
Sang Ah Lee1
 , Gwanpyo Koh1, Suk Ju Cho2, So-Yeon Yoo1, Sang Ouk Chin1
 -
Endocrinology and Metabolism 2016;31(3):439-445.
DOI: https://doi.org/10.3803/EnM.2016.31.3.439
Published online: September 26, 2016
1Department of Internal Medicine, Jeju National University School of Medicine, Jeju, Korea.
2Department of Anesthesiology, Jeju National University School of Medicine, Jeju, Korea.
- Corresponding author: Sang Ah Lee. Department of Internal Medicine, Jeju National University School of Medicine, 15 Aran 13-gil, Jeju 63241, Korea. Tel: +82-64-754-8107, Fax: +82-64-717-1131, salee@jejunu.ac.kr
• Received: April 20, 2016 • Revised: June 17, 2016 • Accepted: July 4, 2016
Copyright © 2016 Korean Endocrine Society
This is an Open Access article distributed under the terms of the Creative Commons Attribution Non-Commercial License (http://creativecommons.org/licenses/by-nc/4.0/) which permits unrestricted non-commercial use, distribution, and reproduction in any medium, provided the original work is properly cited.

Figure & Data
References
Citations
Citations to this article as recorded by 
- How Reliable are Commercially Available Glypican4 ELISA
Kits?
Joseph P. Buhl, Antje Garten, Jürgen Kratzsch, Wieland Kiess, Melanie Penke
Experimental and Clinical Endocrinology & Diabetes.2022; 130(02): 110. CrossRef - Serum glypican-4 is associated with the 10-year clinical outcome of patients with peripheral artery disease
Axel Muendlein, Christine Heinzle, Andreas Leiherer, Kathrin Geiger, Eva Maria Brandtner, Stella Gaenger, Peter Fraunberger, Christoph H. Saely, Heinz Drexel
International Journal of Cardiology.2022; 369: 54. CrossRef - Berberine activates the β-catenin/TCF4 signaling pathway by down-regulating miR-106b to promote GLP-1 production by intestinal L cells
Jiao Wang, Li-Rui Wei, Yan-Ling Liu, Cheng-Zhi Ding, Feng Guo, Jiao Wang, Qian Qin, Feng-Jiao Huang, Ying Xin, Sheng-Nan Ma, Qiu-Ran Zhai, Shou-Jun Wang, Gui-Jun Qin
European Journal of Pharmacology.2021; 911: 174482. CrossRef - Increased Glypican-4 Levels Are Associated with Obesity in Adolescents
Huseyin Dag, Nevin Cetin Dag, Okan Dikker
Iranian Journal of Pediatrics.2019;[Epub] CrossRef - Serum glypican 4 level in obese children and its relation to degree of obesity
Chutima Leelalertlauw, Manassawee Korwutthikulrangsri, Pat Mahachoklertwattana, Suwannee Chanprasertyothin, Patcharin Khlairit, Sarunyu Pongratanakul, Preamrudee Poomthavorn
Clinical Endocrinology.2017; 87(6): 689. CrossRef - Articles inEndocrinology and Metabolismin 2016
Won-Young Lee
Endocrinology and Metabolism.2017; 32(1): 62. CrossRef - Efficacy and Safety of Single‐ or Double‐Drug Antidiabetic Regimens in the Treatment of Type 2 Diabetes Mellitus: A Network Meta‐Analysis
Xi‐Ling Yang, Mi‐Ma Duo‐Ji, Zi‐Wen Long
Journal of Cellular Biochemistry.2017; 118(12): 4536. CrossRef
 PubReader
 Cite
Cite