1,5-Anhydro-D-Glucitol Could Reflect Hypoglycemia Risk in Patients with Type 2 Diabetes Receiving Insulin Therapy
Article information

Abstract
Background
The identification of a marker for hypoglycemia could help patients achieve strict glucose control with a lower risk of hypoglycemia. 1,5-Anhydro-D-glucitol (1,5-AG) reflects postprandial hyperglycemia in patients with well-controlled diabetes, which contributes to glycemic variability. Because glycemic variability is related to hypoglycemia, we aimed to evaluate the value of 1,5-AG as a marker of hypoglycemia.
Methods
We enrolled 18 adults with type 2 diabetes mellitus (T2DM) receiving insulin therapy and assessed the occurrence of hypoglycemia within a 3-month period. We measured 1,5-AG level, performed a survey to score the severity of hypoglycemia, and applied a continuous glucose monitoring system (CGMS).
Results
1,5-AG was significantly lower in the high hypoglycemia-score group compared to the low-score group. Additionally, the duration of insulin treatment was significantly longer in the high-score group. Subsequent analyses were adjusted by the duration of insulin treatment and mean blood glucose, which was closely associated with both 1,5-AG level and hypoglycemia risk. In adjusted correlation analyses, 1,5-AG was negatively correlated with hypoglycemia score, area under the curve at 80 mg/dL, and low blood glucose index during CGMS (P=0.068, P=0.033, and P=0.060, respectively).
Conclusion
1,5-AG level was negatively associated with hypoglycemia score determined by recall and with documented hypoglycemia after adjusting for mean glucose and duration of insulin treatment. As a result, this level could be a marker of the risk of hypoglycemia in patients with well-controlled T2DM receiving insulin therapy.
INTRODUCTION
Strict glycemic control is important to prevent the microvascular complications of diabetes [12]. However, the risk of hypoglycemia precludes such intensive management. Hypoglycemia can increase mortality in some patients with type 2 diabetes mellitus (T2DM) [34] and likely has an impact on diabetes-related cognitive decline and related brain deficits [5]. Even nonsevere hypoglycemic episodes can decrease a patient's quality of life and increase the anxiety and fear of hypoglycemia. It has been reported that the prevalence of hypoglycemia was approximately 12% to 30% depending on the treatment strategy in patients with T2DM patients in the United States [6]. In Korea, the number of patients with severe hypoglycemia seems to be increasing [7], and one center reported that the incidence of patients with severe hypoglycemia requiring intervention was about 12.6% during a median 10.4 years of follow-up [8].
Identifying a marker of hypoglycemia risk could help patients achieve strict glucose control with a lower risk of hypoglycemia. Although there are several clinical characteristics associated with severe hypoglycemia, there is not a simple marker of mild hypoglycemia. Because repetitive episodes of hypoglycemia can cause severe hypoglycemia [910], the prevention of mild hypoglycemia is also important.
1,5-Anhydro-D-glucitol (1,5-AG), 1-deoxy form of glucose is a circulating polyol in body fluid. 1,5-AG is mainly supplied by oral ingestion of natural foods and is evenly distributed to all tissues and organs. 1,5-AG level is kept at a constant level in healthy people through a balance of intake and excretion. The mean 1,5-AG level in Japanese patients with normal glucose tolerance has been reported to be 24.7±7.5 µg/mL [11]. Because 1,5-AG has a similar structure to glucose, its reabsorption is competitively inhibited by glucose in the renal tubule [12]. Therefore, blood 1,5-AG level decreases during hyperglycemia, when high glucose level exists in the renal tubule, reflecting the mean glucose level within a 1- to 2-week-period [13]. Although 1,5-AG is negatively correlated with mean blood glucose (MBG) and hemoglobin A1c (HbA1c) in patients with T2DM [14], the range of 1,5-AG has been observed to be very wide, even in patients with similar HbA1c values. This trend can be explained by the finding that 1,5-AG also reflects postprandial hyperglycemia as well, which is not the case for HbA1c [1415]. In T2DM, postprandial hyperglycemia contributes to glycemic variability, which is one of the risk factors of hypoglycemia [16], along with aging, renal insufficiency, progressive insulin deficiency, treatment modalities such as insulin or long-acting sulfonylureas, and duration of diabetes and insulin treatment [1718]. Therefore, as a marker of post-prandial hyperglycemia, 1,5-AG could reflect the burden of hypoglycemia in patients with well-controlled T2DM.
In this study, we evaluated the usefulness of 1,5-AG as a marker of hypoglycemia in patients with T2DM receiving insulin therapy.
METHODS
Patients
The participants were enrolled from an outpatient clinic of Seoul National University Hospital from September 2013 to September 2014. We recruited 19- to 75-year-old patients with T2DM receiving insulin treatment who had experienced any symptoms of hypoglycemia or had documented blood glucose level less than 80 mg/dL within a 3-month period. Exclusion criteria included serum creatinine higher than 1.5 mg/dL or elevated aspartate aminotransferase (AST) and alanine aminotransferase (ALT) levels more than three times the upper range of normal. This study was approved by the Institutional Review Board of Seoul National University Hospital (IRB No. 1308-054-512). Informed consent was obtained from all of the participants. All study procedures were carried out in accordance with the Declaration of Helsinki.
Questionnaire and measurements
The participants were asked to complete Clarke's hypoglycemia questionnaire [19] with a modified scoring system for patients with T2DM (Fig. 1) because it had originally been developed for patients with type 1 diabetes. The possible range of scores was 2 to 46 points, with points assigned to each item based on severity. The score subjectively indicated the severity of hypoglycemia depending on patient recollection. We also obtained the patients' demographic and anthropometric data, while medical history including duration of diabetes, medications, and diabetic complications was obtained by a trained nurse. Fasting serum 1,5-AG, glucose, C-peptide, total cholesterol, triglycerides, high density lipoprotein cholesterol, low density lipoprotein cholesterol, total bilirubin, AST, ALT, creatinine, and random urine microalbumin/creatinine ratio were measured in all participants.

Modified scoring of the Clarke's hypoglycemia questionnaire.
Continuous glucose monitoring system in the participants
The participants also underwent glucose monitoring with the Meditronic MiniMed (Meditronic, Northridge, CA, USA) continuous glucose monitoring system (CGMS) System Gold. CGMS recorded interstitial glucose level every 5 minutes for 72 consecutive hours, and the CGMS data were analyzed using MiniMed Solutions software [14]. From the CGMS data, we determined the degree of hypoglycemia as the area under the curve at 80 mg/dL (AUC80) [20]. Glucose variability indices were calculated with EasyGV software, a web-based application (www.easygv.co.uk) [21], and included the standard deviation of blood glucose value (standard deviation [SD]), weighted average of glucose values at 100 mg/dL (M100), percentage coefficient of variation (%CV), mean amplitude of glycemic excursion (MAGE), J-index, low blood glucose index (LBGI), high blood glucose index (HBGI), glycemic risk assessment in diabetes equation (GRADE), and continuous overall net glycemic action (CONGA). M100 indicates a measure of stability of the glucose level in comparison with 100 mg/dL, while %CV is the ratio of SD to average glucose level. MAGE is calculated based on the mean of the differences between consecutive peaks and nadirs, which were greater than one SD of mean glucose level. J-index is a measure of the quality of glycemic control based on the mean and SD [22]. The LBGI and the HBGI were specifically designed to be sensitive to hypoglycemia and hyperglycemia, respectively [23]. GRADE indicates the risk attribution of hypoglycemia and hyperglycemia [24]. CONGA is the SD of the differences in glucose level within a predetermined time window intervals [22].
Statistical analysis
Statistical analysis and data management were performed using IBM SPSS version 21.0 (IBM Co., Armonk, NY, USA) or GraphPad Prism 5 (GraphPad, La Jolla, CA, USA). All data are expressed as mean±SD. Clinical characteristics were compared according to sex and score group using Student t test (Tables 1, 2). The Pearson correlation coefficient and partial correlation coefficient were used for correlation analysis (Table 3, Fig. 2). The hypoglycemia score and 1,5-AG level were transformed logarithmically in some analyses. Statistical significance was determined at P<0.05.

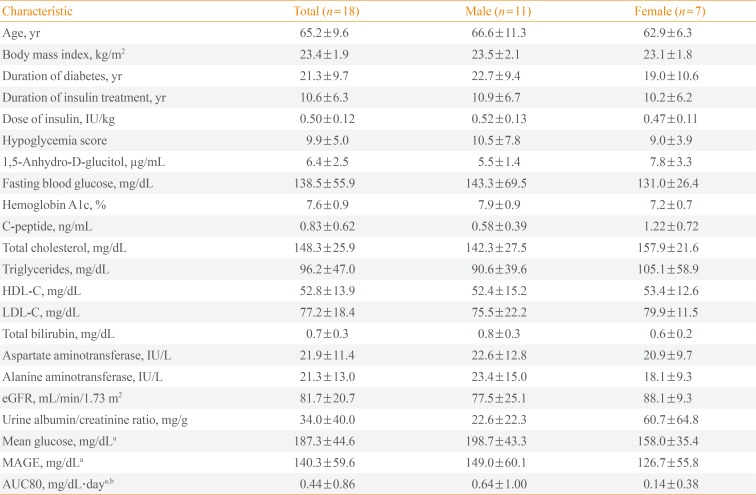
Clinical Characteristics of the Study Subjects

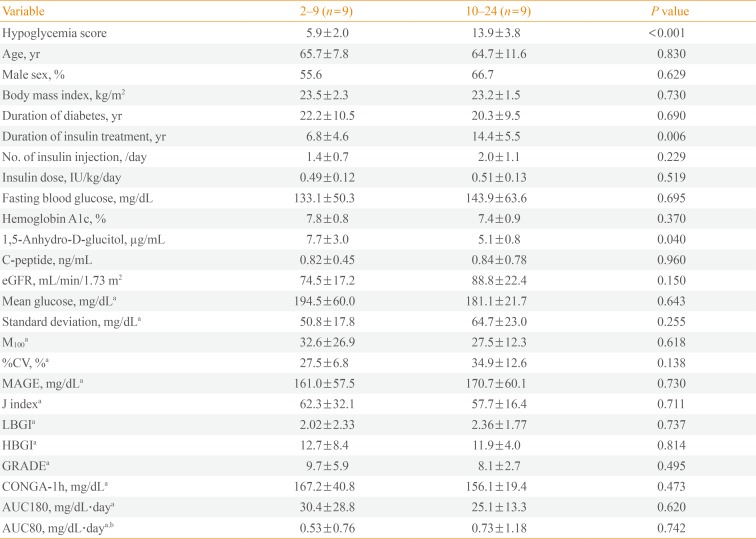
Comparisons according to the Hypoglycemia Score

Correlation Coefficients between 1,5-AG and Other Indices as Determined by Continuous Glucose Monitoring System Study in All Subjects
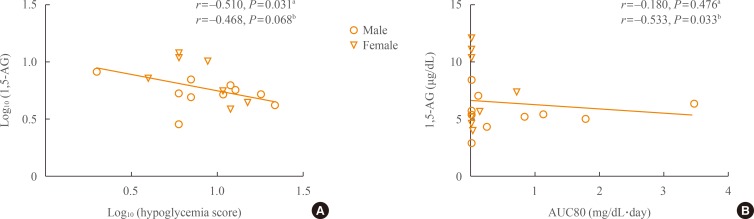
Correlations between 1,5-anhydro-D-glucitol (1,5-AG) level and hypoglycemia indices. (A) Log (1,5-AG) level was negatively correlated with log (hypoglycemia score). (B) The 1,5-AG level was negatively correlated with area under the curve for glucose level less than 80 mg/dL (AUC80). r, Pearson correlation coefficient. aSimple correlation; bAdjustment for log (mean blood glucose) and log (duration of insulin treatment).
RESULTS
Clinical characteristics of the participants
A total of 18 participants were enrolled, and their clinical characteristics are shown in Table 1. Men made up 61.1% of the participants. The mean age was 65.2±9.6 years, HbA1c was 7.6±0.9%, hypoglycemia score was 9.9±5.0, and 1,5-AG level was 6.4±2.5 µg/mL. According to the CGMS data, the mean glucose level was 187.3±44.6 mg/dL, MAGE was 140.3±59.6 mg/dL, and AUC80 was 0.44±0.86 mg/dL·day. During the 72-hour CGMS period, five participants did not achieve a glucose level less than 80 mg/dL, and another five participants reached a glucose level less than 80 mg/dL only for an average of 21 minutes (0.49% of the CGMS period). Therefore, we could only observe significant hypoglycemia in eight of the 18 participants. Comparisons according to sex revealed no significant differences in the variables (Table 1).
Comparisons according to hypoglycemia score
We divided the 18 participants into two groups according to hypoglycemia score (Table 2) and found that duration of insulin treatment and serum 1,5-AG level were significantly different between the groups, while insulin dose, fasting blood glucose, and HbA1c level were not different. Hypoglycemia can be influenced by factors such as age, duration of diabetes, renal impairment, and treatment modality [1618], but these were comparable between the groups. However, neither glycemic variability nor AUC80 was significantly different between the groups.
Significant correlations between 1,5-AG level and hypoglycemia indices
When we performed correlation analysis between 1,5-AG and hypoglycemia score, there was a significant negative relationship (r=–0.510, P=0.031) (Fig. 2A). After adjusting for duration of insulin treatment and mean glucose, the negative correlation remained (r=–0.468, P=0.068).
In cases of hypoglycemia as determined by CGMS data, AUC80 was not associated with 1,5-AG level in simple correlation analysis. However, adjusting for duration of insulin treatment and mean glucose revealed a significant correlation between 1,5-AG and AUC80 (r=–0.533, P=0.033) (Fig. 2B). Time below 80 mg/dL was also associated with 1,5-AG level after adjusting for these two variables (r=–0.536, P=0.032, data not shown).
Correlation analyses between 1,5-AG and the various glycemic indices
Because glycemic variability is regarded as a contributor to hypoglycemia, we performed correlation analyses between 1,5-AG and the calculations from CGMS (Table 3). In the simple correlation analyses, 1,5-AG showed negative correlations with most indices (P=0.011 to 0.071) except LBGI. However, MBG influences not only 1,5-AG level [121314], but several indices of glycemic variability [22]. Therefore, adjusting for MBG and duration of insulin treatment revealed an association between 1,5-AG and LBGI (P=0.060), strengthened the association between 1,5-AG and GRADE (P=0.009), and negated the significant correlations between 1,5-AG and the other variables.
DISCUSSION
In this study, we evaluated whether 1,5-AG level could act as a simple marker of hypoglycemia in patients with well-controlled T2DM receiving insulin therapy. As we showed in this study (Table 3), 1,5-AG level is known to have a negative correlation with postprandial hyperglycemia in patients with T2DM with a HbA1c less than 8% [1415], which indicates significantly increased glycemic variability. On the other hand, 1,5-AG is also negatively correlated with short-term MBG (Table 3) [121314]. Both severe glycemic variability due to postprandial hyperglycemia and low MBG, which affect 1,5-AG level in opposing directions, enhance hypoglycemia [1625]. Therefore, it is unclear whether 1,5-AG actually reflects hypoglycemia. Even if 1,5-AG does reflect hypoglycemia, its clinical utility is uncertain. One study has demonstrated that patients with high 1,5-AG level were associated with a smaller risk of hypoglycemia even with multiple insulin injection therapy compared to patients receiving conventional insulin therapy [26]. The study did not evaluate a direct relationship between risk of hypoglycemia and 1,5-AG level. As a result, we limited study participants to patients with well-controlled T2DM under insulin treatment and found that 1,5-AG level was negatively associated with hypoglycemia risk when the level was adjusted for mean glucose and duration of insulin treatment (Fig. 2).
We enrolled 18 patients who had experienced recent hypoglycemia; however, CGMS revealed episodes with glucose level less than 80 mg/dL in only 13 participants; the reasons for this discrepancy are presumed to be due to the delay in performing CGMS from the time of symptoms. Because the questionnaire was administered right after enrollment, the patients might have been more cautious with their insulin doses, thus reducing their risk of hypoglycemia. This discrepancy could have contributed to the lack of difference in AUC80 between the high-score and low-score groups (Table 2). Indeed, there is a possibility that the scores were inaccurate because they were mainly dependent on patient recall. In addition, the participants were patients with T2DM, who might be less adherent to self-measurements of blood glucose compared to patients with type 1 diabetes. As a result, hypoglycemic events could have been under-estimated by the scoring system.
We indirectly examined the potential role of 1,5-AG as an index of hypoglycemia by demonstrating the associations between 1,5-AG and two indices of glycemic variability related to hypoglycemia: LBGI and GRADE (Table 3). These indicators reflect the degree of hypoglycemia [2324], and LBGI has been reported to be a significant predictor of future severe hypoglycemia [27]. Therefore, the negative correlations between 1,5-AG and these indices after adjusting for mean glucose reinforce the possibility that 1,5-AG reflects the risk of hypoglycemia in patients with T2DM receiving insulin therapy.
The limitations of this study include the fact that the hypoglycemia scoring system is not a standardized tool used for the study of patients with T2DM. We used the Clarke hypoglycemic questionnaire (Fig. 1), which was developed to assess impaired awareness of hypoglycemia in patients with type 1 diabetes [19]. There are no standardized questionnaires for evaluating the severity of hypoglycemia in patients with T2DM, so we modified the scoring system of the Clarke hypoglycemic questionnaire. In addition, we detected hypoglycemia, as defined by glucose level less than 80 mg/dL, in only 3.48% of the total period of CGMS. The relative rarity of hypoglycemia likely weakened the statistical significance in the analyses. As mentioned above, the failure to find a significant difference in AUC80 between the high-score and low-score groups (0.53±0.76 vs. 0.73±1.18, P=0.742) (Table 2) might be due to the low incidence of hypoglycemia.
During the study period including the 3 months before enrollment, there were no serious episodes of hypoglycemia requiring hospitalization or emergency department admission or situations that required the assistance of another person. However, recurrent hypoglycemia, even if it is mild and easily relievable, is known to be a risk factor of serious hypoglycemia [910], which could have detrimental effects on cardiovascular disease and mortality [428]. Therefore, in an effort to avoid any episodes of hypoglycemia, intermittent monitoring of 1,5-AG might be helpful in patients with T2DM receiving insulin therapy, especially if they have recently experienced symptoms of hypoglycemia. It is difficult to say which cut off point of 1,5-AG could be used as a marker of hypoglycemia, therefore the validation studies with larger populations would be required to apply 1,5-AG in clinic to prevent hypoglycemia.
ACKNOWLEDGMENTS
This study was supported by a grant from the Innovative Research Institute for Cell Therapy (A062260) by the Ministry of Health and Welfare, Republic of Korea, and by a research grant from Seoul National University Hospital (0420140520).
Notes
CONFLICTS OF INTEREST: No potential conflict of interest relevant to this article was reported.