Articles
- Page Path
- HOME > Endocrinol Metab > Volume 32(2); 2017 > Article
-
Original ArticleFree Thyroxine, Anti-Thyroid Stimulating Hormone Receptor Antibody Titers, and Absence of Goiter Were Associated with Responsiveness to Methimazole in Patients with New Onset Graves' Disease
-
Hoon Sung Choi1
 , Won Sang Yoo2
 -
Endocrinology and Metabolism 2017;32(2):281-287.
DOI: https://doi.org/10.3803/EnM.2017.32.2.281
Published online: June 23, 2017
1Department of Internal Medicine, Kangwon National University Hospital, Kangwon National University School of Medicine, Chuncheon, Korea.
2Department of Internal Medicine, Dankook University Hospital, Dankook University College of Medicine, Cheonan, Korea.
- Corresponding author: Won Sang Yoo. Department of Internal Medicine, Dankook University Hospital, Dankook University College of Medicine, 201 Manghyang-ro, Dongnam-gu, Cheonan 31116, Korea. Tel: +82-41-550-7664, Fax: +82-41-556-0524, smff03@hanmail.net
• Received: February 14, 2017 • Revised: April 21, 2017 • Accepted: April 24, 2017
Copyright © 2017 Korean Endocrine Society
This is an Open Access article distributed under the terms of the Creative Commons Attribution Non-Commercial License (http://creativecommons.org/licenses/by-nc/4.0/) which permits unrestricted non-commercial use, distribution, and reproduction in any medium, provided the original work is properly cited.
ABSTRACT
-
Background
- Anti-thyroid drug therapy is considered a treatment of choice for Graves' disease; however, treatment response varies among individuals. Although several studies have reported risk factors for relapse after initial treatment, few have assessed responsiveness during the early treatment period. Our study aimed to identify the clinical characteristics for responsiveness to methimazole.
-
Methods
- We included 99 patients diagnosed with Graves' disease for the first time. Drug responsiveness was defined as the correlation coefficients between decreasing rates of free thyroxine level per month and methimazole exposure dose. According to their responsiveness to treatment, the patients were classified into rapid or slow responder groups, and age, sex, free thyroxine level, and thyrotropin binding inhibiting immunoglobulin (TBII) titers were compared between groups.
-
Results
- The mean patient age was 44.0±13.5 years and 40 patients were male (40%). The mean TBII titer was 36.6±74.4 IU/L, and the mean free thyroxine concentration was 48.9±21.9 pmol/L. The rapid responder group showed higher TBII titer and free thyroxine level at diagnosis, while age, sex, smoking, and presence of goiter did not differ between the two groups. Logistic regression analyses revealed that high level of serum thyroxine, high titer of TBII, and absence of goiter were significantly associated with a rapid response, while age, sex, and smoking were not significant factors for the prediction of responsiveness.
-
Conclusion
- In patients with new onset Graves' disease, high level of free thyroxine, high titer of TBII, and absence of goiter were associated with rapid responsiveness to methimazole treatment.
- Graves' disease is the common cause of thyrotoxicosis in Korea, with a prevalence of 82.7% [1]. Appropriate treatment is required at initial diagnosis because untreated Graves' disease is associated with osteoporosis or cardiovascular problems such as arrhythmia and congestive heart failure [23].
- Several guidelines recommend anti-thyroid drug treatment as the treatment of choice because of its high efficacy and low risk of adverse effects [14]. However, severe adverse effects such as agranulocytosis and hepatic failure reportedly occur more frequently in patients receiving higher treatment doses [56]. Elevation of thyroid stimulating hormone (TSH) due to transient hypothyroid status had reported to be associated with aggravation of thyroid-associated ophthalmopathy [7]. Considering the potential adverse effects associated with the usage of high doses of methimazole, it is important to predict individual responsiveness to methimazole treatment and to determine the optimal dose for initial treatment. Although methimazole is generally administered at a dose of 20 to 30 mg, a previous study reported that 15 mg administered once daily showed similar efficacy [8].
- Our study aimed to identify the clinical characteristics associated with initial responsiveness to methimazole. Using the serial results of serum thyroid function tests (TFTs) during methimazole treatment, we examined the associated factors for rapid responsiveness.
INTRODUCTION
- Subjects
- This study included 99 patients diagnosed with Graves' disease at a tertiary hospital (Dankook University Hospital, Cheonan, Korea) between 2013 and 2015. All patients were newly diagnosed patients without previous medication for thyroid disease and received methimazole treatments. Graves' disease was diagnosed by thyrotoxic symptoms (palpitation, tremor, and weight loss), increased free thyroxine (T4)/decreased serum TSH levels and elevated thyrotropin binding inhibiting immunoglobulin (TBII) titers, or the presence of the appropriate clinical features such as diffuse goiter or thyroid-associated orbitopathy. Goiter was classified into three grades (none; small: less than 40 g; and medium to large: 40 g or more). We excluded patients without reliable information or initial TFT concentrations and TBII titers, fewer than three instances of laboratory testing, without sufficient medication compliance, and previous history of medication affecting thyroid function such as steroids or iodine-containing drugs. This study was approved by Institutional Review Board of Dankook University Hospital (number 2016-09-012).
- Treatment protocols
- The anti-thyroid drug therapy and follow-up examinations were performed using a uniform protocol using a dose titrating regimen, mostly with methimazole, according to the present guidelines throughout the study period. Some patients were shifted to propylthiouracil therapy owing to side effects associated with methimazole; these patients were excluded from this study. The starting dose of methimazole was approximately 20 to 30 mg and was gradually decreased according to the levels of free T4. When the serum levels of free T4 in patients were within the normal range, the methimazole dose was decreased. When the TSH level was within the normal range, the dose of methimazole was maintained at 5 to 10 mg. There was no formal strategy for determining the initial dose, but the doses tended to be lower in elderly patients or those with relatively less severe thyrotoxicosis.
- Patients were followed up every 1 to 2 months till their thyroid function had stabilized with normal TFT levels, followed by regular visits at intervals of 3 to 6 months while the thyroid status remained stable. TBII titers were measured sequentially during every visit. The decision to stop the medication depended on normalized thyroid function and absence of TBII. After the treatment was completed, patients were followed up every 3 to 6 months to monitor for disease recurrence to 12 months.
- Thyroid function test and TBII assay
- The serum TSH concentrations (reference range, 0.25 to 4 µIU/mL; lower detection limit, 0.03 µIU/mL) were measured using an immunoradiometric assay (RIA-gnost rhTSH, Cisbio Bioassays, Codolet, France). The serum levels of free T4 (normal range, 10.0 to 25.0 pmol/L) were measured using the free T4 radioimmunoassay (RIA) kit (fT4-CTX, DiaSorin SpA, Saluggia, Italy) The total serum T3 levels (reference range, 1.2 to 3.1 nmol/L) were measured using an RIA kit (T3-CTK, DiaSorin SpA). TBII titers were determined using the BRAHMS. TRAK human RIA kit (BRAHMS GmbH, Oberhavel, Germany) according to the manufacturer's directions. TBII titers ≥1.5 IU/L were considered positive.
- Definition of responsiveness
- This study defined responsiveness to methimazole as decreasing rates of free T4 level per one tablet of methimazole (5 mg) and a month. Firstly, in each patient, we calculated changes of free T4 level per a day for every interval between visits at clinic. Supposed that each patient shows linear correlation between changes in free T4 level and prescribed methimazole doses, we considered these correlation coefficients as individual responsiveness to methimazole. Fig. 1 shows representative two cases with rapid response and slow response, respectively. By iterative linear regression, the methimazole responsiveness of all patients was obtained.
- Statistics
- The patients were classified into two groups according to their responsiveness to methimazole: the rapid responder group included patients with scores in the upper 50th percentiles, while the slow responder group included those with scores in the lesser 50th percentiles. Because the distribution of TBII titer skewed to the right, we used log-transformed values of TBII titer in analyses. Continuous variables were represented by mean±standard deviation and analyzed by Student t test or Mann-Whitney U test, and analyses of dichotomous variables were performed by chi-square test or logistic regression. In logistic regression analysis for risk factors of responsiveness, all factors were entered at the same time (the enter method), because of a small number of predictor. To evaluate the optimal cut-off levels for prediction of responsiveness, receiver operating characteristic (ROC) analysis was performed. Iterative calculation of the correlation coefficients in the linear regression analyses and statistical analyses were performed using R version 3.3.2 (R Foundation for Statistical Computing, Vienna, Austria). All P values were two-tailed with P<0.05 considered significant.
METHODS
- Baseline characteristics at initial diagnosis
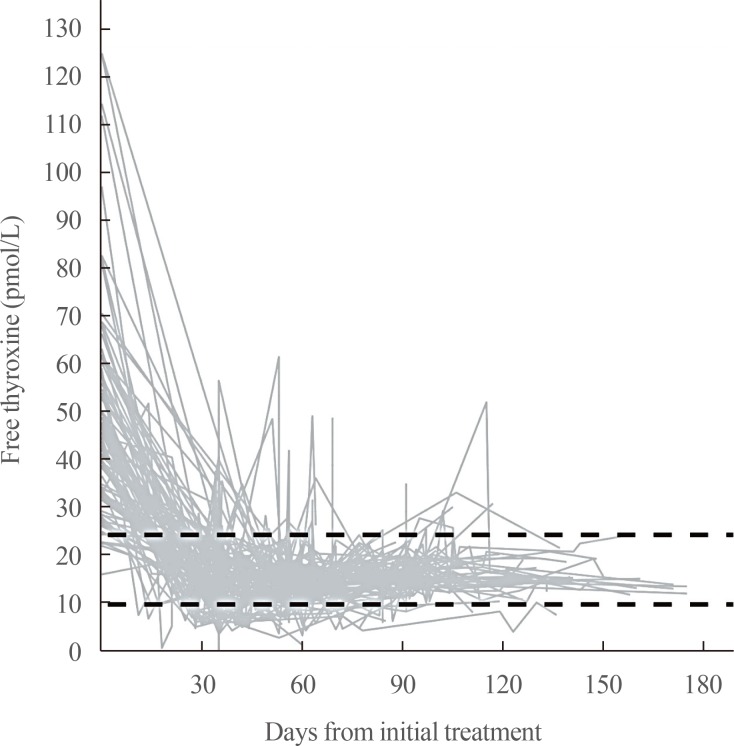
- The mean age of the patients was 44.0±13.5 years old and 40 (40%) were male. Among the patients, 69 patients (70.1%) showed goiter and 27 patients (27.3%) had current smoker. At diagnosis, the mean free T4 level was 48.9±21.9 pmol/L, and the mean TBII titer was 36.6±74.4 IU/L. The mean value of the initial methimazole dose was 24.5±6.0 mg (Table 1). Fig. 2 shows the serial changes in free T4 level in each patient from the time of initial treatment. Almost all patients showed normalization of the free T4 levels within about 2 months, regardless of initial free T4 level.
- Calculated using linear regression model for each patient, the median value of responsiveness, decreasing rate of free T4 level per one tablet of methimazole during 1 month, was 4.33, which means that, if a patient takes one tablet of methimazole (5 mg) during 1 month, his free T4 level will decrease by 4.33 pmol/L 1 month later. Fig. 3 shows the distribution of calculated responsiveness, and the mean of responsiveness was 9.31±6.20 in patients with the upper 50th percentiles (rapid responder group) and 2.73±0.99 in patients with the lesser 50th percentiles (slow responder group).
- Comparisons of baseline characteristics between response groups
- Rapid responder group was not different from slow responder group in age, male proportion, and median duration for treatment (Table 1). Median duration of follow-up was longer slow responder group than rapid responder group. There were no differences of proportion of goiter, smoking rate, and initial dose of methimazole between groups. However, free T4 and TBII titer at initial diagnosis were higher in rapid responder group than slow responder group with statistical significance.
- Predicting factors for responsiveness and the optimal cut-off levels
- In univariate analyses, high level of initial free T4 and TBII titer were significant predicting factor for rapid responsiveness to methimazole; however, age, male sex, presence of goiter, and smoking did not show significances (Table 2). Multivariate analysis with adjustment for all factors showed also significances of initial free T4 level and TBII titer for prediction of rapid responsiveness. On the other hand, presence of medium to large goiter was a predictive factor for slow responsiveness.
- To evaluate of optimal cut-off value for prediction of responsiveness, we performed ROC analyses of TBII titer and initial free T4 level. The optimal cut-off value of TBII for prediction of responsiveness was 17.95 IU/L with sensitivity of 60.0% and specificity of 77.6% in ROC analysis (Fig. 4A). The optimal cut-off value of initial free T4 level was 47.3 pmol/L with sensitivity of 70.0% and specificity of 79.6% (Fig. 4B).
RESULTS
- Given that previous studies reported the similar efficacy and lower adverse effects of relatively low doses of methimazole compared to those of higher doses [89], methimazole treatment dosages of 10 to 20 mg daily might be sufficient to stabilize thyroid function. However, because initially high free T4 levels also required higher doses of methimazole, individual assessment of the responsiveness to the anti-thyroid drug is necessary [10]. This study showed that the factors that could predict rapid responsiveness to methimazole treatment included higher free T4 level and TBII titer at initial diagnosis.
- High titer of anti-TSH receptor-stimulating antibody is an important factor for diagnosis and determines the time to complete anti-thyroid treatment [1112]. Although few studies have assessed the associations with responsiveness to anti-thyroid drugs, a previous study reported higher anti-TSH receptor antibody titers in the rapid responder group, but the difference was not statistically significant [13]. Our results showed higher TBII titers were associated with rapid responses in both univariate and multivariate analyses.
- Rapid response in patients with higher TBII titers could be explained by epitope heterogeneity in the thyroid stimulating antibody. Kim et al. [14] reported that the presence of thyroid stimulating antibodies with heterogeneous epitopes was associated with a favorable response to anti-thyroid drug therapy. Considering the effect of anti-thyroid drugs, which compete with tyrosyl residues for iodide [15], the coexistence of TSH-blocking antibodies might augment the effect of anti-thyroid drug competition. However, because we could not discriminate thyroid stimulating antibody from blocking antibodies, the effect of epitope heterogeneity could not be evaluated in the present study. Thus, future clinical studies using specific assays for thyroid stimulating antibody are warranted.
- In this study, patients with higher levels of free T4 at initial diagnosis showed a rapid response to methimazole treatment. In general practice, patients with high levels of free T4 tend to be treated with higher doses of anti-thyroid drug based on assumption that they would be resistant to treatment. Based on our results that decreases of free T4 would be more rapid in the patients with high level of free T4 and high titer of TBII, a high starting dose may increase the risk of transient hypothyroidism [10]. And this finding suggests that, at initial treatment, relatively low doses of methimazole would be appropriate in those patients, or short term follow-up if they were treated with high dose methimazole.
- Our study had several limitations inherent to retrospective studies. First, because we could not collect sufficient clinical information such as thyrotoxic symptoms, body weight changes, pulse rate, our analyses were limited to simple association tests. Second, responsiveness was defined by an arbitrary mathematical method that requires validations in future studies. Lastly, because our study included patients who were managed by one clinician in one hospital, it is currently difficult to apply our results to the general population and routine clinical practice. Given that there are few studies on individualized anti-thyroid drug treatment regimens, well-designed prospective studies are needed.
- Among patients with new onset Graves' disease, those with high levels of free T4 and TBII titers at initial diagnosis showed rapid responsiveness to methimazole treatment. To avoid hypothyroidism and achieve optimal stabilization of thyroid function, individual patient characteristics should be considered.
DISCUSSION
-
CONFLICTS OF INTEREST: No potential conflict of interest relevant to this article was reported.
Article information
- 1. Moon JH, Yi KH. The diagnosis and management of hyperthyroidism in Korea: consensus report of the Korean Thyroid Association. Endocrinol Metab (Seoul) 2013;28:275–279. ArticlePubMedPMC
- 2. Chaker L, Heeringa J, Dehghan A, Medici M, Visser WE, Baumgartner C, et al. Normal thyroid function and the risk of atrial fibrillation: the Rotterdam study. J Clin Endocrinol Metab 2015;100:3718–3724. ArticlePubMed
- 3. Tsymbaliuk I, Unukovych D, Shvets N, Dinets A. Cardiovascular complications secondary to Graves' disease: a prospective study from Ukraine. PLoS One 2015;10:e0122388ArticlePubMedPMC
- 4. Bahn Chair RS, Burch HB, Cooper DS, Garber JR, Greenlee MC, Klein I, et al. Hyperthyroidism and other causes of thyrotoxicosis: management guidelines of the American Thyroid Association and American Association of Clinical Endocrinologists. Thyroid 2011;21:593–646. ArticlePubMed
- 5. Cooper DS, Rivkees SA. Putting propylthiouracil in perspective. J Clin Endocrinol Metab 2009;94:1881–1882. ArticlePubMedPDF
- 6. Takata K, Kubota S, Fukata S, Kudo T, Nishihara E, Ito M, et al. Methimazole-induced agranulocytosis in patients with Graves’ disease is more frequent with an initial dose of 30 mg daily than with 15 mg daily. Thyroid 2009;19:559–563. ArticlePubMed
- 7. Fernando R, Placzek E, Reese EA, Placzek AT, Schwartz S, Trierweiler A, et al. Elevated serum tetrac in Graves disease: potential pathogenic role in thyroid-associated ophthalmopathy. J Clin Endocrinol Metab 2017;102:776–785. ArticlePubMedPDF
- 8. Mashio Y, Beniko M, Matsuda A, Koizumi S, Matsuya K, Mizumoto H, et al. Treatment of hyperthyroidism with a small single daily dose of methimazole: a prospective long-term follow-up study. Endocr J 1997;44:553–558. ArticlePubMed
- 9. Reinwein D, Benker G, Lazarus JH, Alexander WD. A prospective randomized trial of antithyroid drug dose in Graves' disease therapy. European Multicenter Study Group on Antithyroid Drug Treatment. J Clin Endocrinol Metab 1993;76:1516–1521. ArticlePubMed
- 10. Page SR, Sheard CE, Herbert M, Hopton M, Jeffcoate WJ. A comparison of 20 or 40 mg per day of carbimazole in the initial treatment of hyperthyroidism. Clin Endocrinol (Oxf) 1996;45:511–516. ArticlePubMed
- 11. Kwon H, Kim WG, Jang EK, Kim M, Park S, Jeon MJ, et al. Usefulness of measuring thyroid stimulating antibody at the time of antithyroid drug withdrawal for predicting relapse of Graves disease. Endocrinol Metab (Seoul) 2016;31:300–310. ArticlePubMedPMC
- 12. Okamoto Y, Tanigawa S, Ishikawa K, Hamada N. TSH receptor antibody measurements and prediction of remission in Graves' disease patients treated with minimum maintenance doses of antithyroid drugs. Endocr J 2006;53:467–472. ArticlePubMed
- 13. Gemma R, Nakamura H, Mori T, Andoh S, Suzuki Y, Yoshimi T. The change in 123I-uptake between 3- and 24-hours is useful in predicting early response to methimazole in patients with Graves' disease. Endocr J 1996;43:61–66. ArticlePubMed
- 14. Kim TY, Park YJ, Park DJ, Chung HK, Kim WB, Kohn LD, et al. Epitope heterogeneity of thyroid-stimulating antibodies predicts long-term outcome in Graves' patients treated with antithyroid drugs. J Clin Endocrinol Metab 2003;88:117–124. ArticlePubMed
- 15. Engler H, Taurog A, Luthy C, Dorris ML. Reversible and irreversible inhibition of thyroid peroxidase-catalyzed iodination by thioureylene drugs. Endocrinology 1983;112:86–95. ArticlePubMedPDF
References
Fig. 1
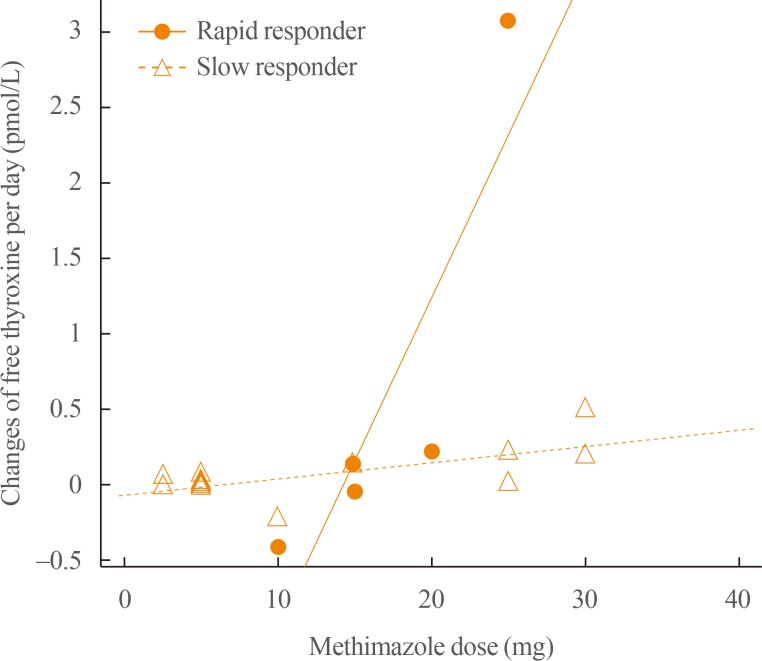
Representative two cases with rapid response and slow response. Each point represents changes of free thyroxine according to prescribed dose of methimazole. From linear regression model based on points in each patient, correlation coefficients of all patients were obtained and considered as responsiveness to methimazole. Closed circles and solid line indicate a patient with rapid response (correlation coefficient=0.215), and open triangles and dashed line indicate a patient with slow response (correlation coefficient=0.011).
Fig. 2

Serial changes in free thyroxine levels in each patient during the follow-up period. Almost patients showed normalization of free thyroxine within about 2 months, regardless of initial free thyroxine level. Two dashed lines represent the upper and lower boundaries of the reference range for free thyroxine (25.0 and 10.0 pmol/L, respectively).
Fig. 3
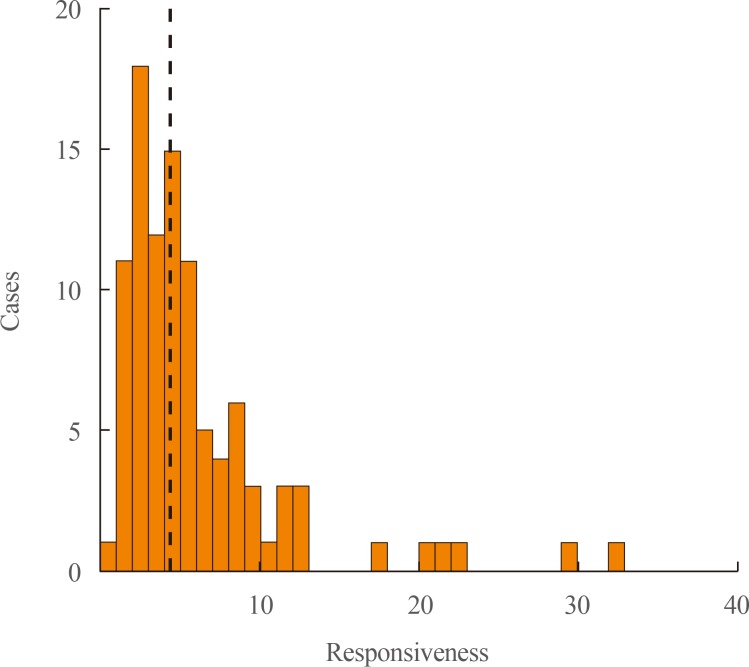
Distribution of responsiveness to methimazole. The dashed vertical line indicates the median value of responsiveness.
Fig. 4
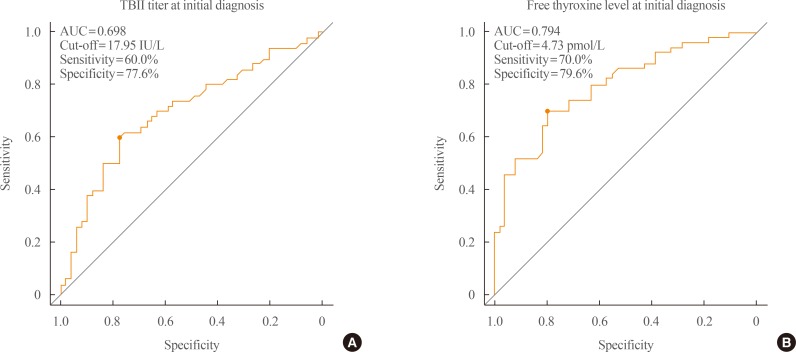
Receiver operating characteristic (ROC) curves for the responsiveness to methimazole. (A) ROC curve of thyroid binding inhibitory immunoglobulin (TBII) titer at initial diagnosis for the responsiveness. (B) ROC curve of free thyroxine level at initial diagnosis for the responsiveness. AUC, area under the curve.
Table 1
![enm-32-281-i001.jpg]()
Baseline Characteristics between Groups According to Methimazole Responsiveness
Table 2
![enm-32-281-i002.jpg]()
Clinical Factors Predicting Rapid Response to Methimazole
Figure & Data
References
Citations
Citations to this article as recorded by 
- Enhanced predictive validity of integrative models for refractory hyperthyroidism considering baseline and early therapy characteristics: a prospective cohort study
Xinpan Wang, Tiantian Li, Yue Li, Qiuyi Wang, Yun Cai, Zhixiao Wang, Yun Shi, Tao Yang, Xuqin Zheng
Journal of Translational Medicine.2024;[Epub] CrossRef - Analysis of Related Factors in Refractory Graves’ Disease
鑫 王
Advances in Clinical Medicine.2023; 13(08): 13439. CrossRef - Clinical efficacy of thyroid-stimulating immunoglobulin detection for diagnosing Graves’ disease and predictors of responsiveness to methimazole
KunY Liu, Yu Fu, TianT Li, SunQ Liu, DouD Chen, ChengC Zhao, Yun Shi, Yun Cai, Tao Yang, XuQ Zheng
Clinical Biochemistry.2021; 97: 34. CrossRef - Changes in Thyroid Peroxidase and Thyroglobulin Antibodies Might Be Associated with Graves' Disease Relapse after Antithyroid Drug Therapy
Yun Mi Choi, Mi Kyung Kwak, Sang Mo Hong, Eun-Gyoung Hong
Endocrinology and Metabolism.2019; 34(3): 268. CrossRef - When should antithyroid drug therapy to reduce the relapse rate of hyperthyroidism in Graves’ disease be discontinued?
Suyeon Park, Eyun Song, Hye-Seon Oh, Mijin Kim, Min Ji Jeon, Won Gu Kim, Tae Yong Kim, Young Kee Shong, Doo Man Kim, Won Bae Kim
Endocrine.2019; 65(2): 348. CrossRef
 PubReader
 Cite
Cite