KES
KES
Articles
- Page Path
- HOME > Endocrinol Metab > Volume 32(4); 2017 > Article
-
Original ArticleClinical Study Changes in Body Composition According to Age and Sex among Young Non-Diabetic Korean Adults: The Kangbuk Samsung Health Study
 Audioslide
 -
Seul-Ki Kim1, Yu-Hyun Kwon1, Jung Hwan Cho1, Da Young Lee2, Se Eun Park1, Hyung-Geun Oh3, Cheol-Young Park1, Won-Young Lee1, Ki-Won Oh1, Sung-Woo Park1, Eun-Jung Rhee1

-
Endocrinology and Metabolism 2017;32(4):442-450.
DOI: https://doi.org/10.3803/EnM.2017.32.4.442
Published online: November 21, 2017
1Division of Endocrinology and Metabolism, Department of Internal Medicine, Kangbuk Samsung Hospital, Sungkyunkwan University School of Medicine, Seoul, Korea.
2Division of Endocrinology and Metabolism, Department of Internal Medicine, Korea University Ansan Hospital, Korea University College of Medicine, Ansan, Korea.
3Department of Neurology, Soonchunhyang University Cheonan Hospital, Soonchunhyang University College of Medicine, Cheonan, Korea.
- Corresponding author: Eun-Jung Rhee. Division of Endocrinology and Metabolism, Department of Internal Medicine, Kangbuk Samsung Hospital, Sungkyunkwan University School of Medicine, 29 Saemunan-ro, Jongno-gu, Seoul 03181, Korea. Tel: +82-2-2001-2485, Fax: +82-2-2001-1588, hongsiri@hanmail.net
Copyright © 2017 Korean Endocrine Society
This is an Open Access article distributed under the terms of the Creative Commons Attribution Non-Commercial License (http://creativecommons.org/licenses/by-nc/4.0/) which permits unrestricted non-commercial use, distribution, and reproduction in any medium, provided the original work is properly cited.

ABSTRACT
-
Background
- Age-related decreases in lean mass represent a serious health problem. We aimed to analyze the risks of rapid decreases in lean mass by age and sex in relatively young Korean adults during a 4-year follow-up study.
-
Methods
- A total of 65,856 non-diabetic participants (59.5% men, mean age 39.1 years) in a health screening program were subjected to bioimpedance body composition analyses and metabolic parameter analyses at baseline and after 4 years. The participants were sub-divided according to age, and additionally to six groups by age and the degree of body weight change over the 4-year period. The actual changes in body weight, lean mass, and fat mass and the percent changes over the 4-year period were assessed.
-
Results
- The percent change in lean mass decreased and the percent change of fat mass increased with increasing age in every age and sex group. However, the annual percent decrease in lean mass and percent increase in fat mass were significantly higher among women than among men (−0.26% vs. −0.15% and 0.34% vs. 0.42%, respectively; P<0.01). Participants who were older than 50 years and had a weight loss <−5% during the 4 years had significantly greater decreases in lean mass and smaller decreases in fat mass, compared to those who were younger than 50 years. An odds ratio analysis to determine the lowest quartile of the percent change in lean mass according to age group revealed that participants older than 60 years had a significantly increased risk of a rapid decrease in the lean mass percentage (2.081; 95% confidence interval, 1.678 to 2.581).
-
Conclusion
- Even in this relatively young study population, the lean mass decreased significantly with age, and the risk of a rapid decrease in lean mass was higher among women than among men. Furthermore, the elderly exhibited a significantly more rapid decrease in lean mass, compared with younger participants.
- The prevalence of obesity is increasing markedly worldwide, and nearly 30% of adults older than 30 years are obese, according to current estimations [1]. However, weight gain is a complex phenomenon, as the body comprises complex components such as fat, muscle, water, and bone. A simple increase in weight might be due to an increase in body fat, but might also be attributable to an increase in muscle mass or water uptake, which might have entirely different consequences from an increase in fat [2]. The results of recent studies suggest complicated interpretations of weight changes that are based on novel hypotheses, such as the existence of ‘metabolically healthy obesity’ or ‘sarcopenic obesity’ [345]. These concepts are very important to our understanding of the changes in body composition during aging.
- Weight loss is frequently observed in the elderly and is a unilaterally strong predictor of mortality [67]. This phenomenon might reflect difficulties with homeostatic maintenance in older age [8]. Elderly individuals experiencing weight loss would be expected to exhibit decreases in both the lean body mass and fat mass [9], and previous studies have shown that this decrease is more pronounced in lean body mass [6]. Normally, the lean body mass peaks in the third to fourth decade of life, followed by a steady decline with further aging [1011]. In contrast, body weight increases until approximately 60 years of age, after which time ≥60% of the population will experience a decrease in weight. Therefore, fat mass accumulates during midlife [1213]. However, older people regulate weight less effectively than to younger people because the older people are less able to conserve lean mass during weight loss [14].
- According to several previous studies, sex might have affect the decrease in lean mass with aging [1516]. Compared with men, women experience more complicated changes in body composition as they pass through menopause, including an abrupt decline in estrogen production [17]. Because estrogen exerts multiple protective effects against metabolic disorders such as visceral obesity, osteoporosis, and atherosclerosis, women suffer from various metabolic diseases that lead to an increased risk of cardiovascular mortality after menopause [1819].
- Studies have suggested sex- and age-related associations of weight changes with new-onset disabilities [20212223]. Nevertheless, it remains controversial whether changes in body composition differ by age or sex. Therefore, in this study we aimed to analyze the changes of body weight and body composition during a 4-year follow-up study.
INTRODUCTION
- Subjects
- This is a retrospective single-center study conducted as part of the Kangbuk Samsung Health Study, which included participants in a medical health checkup program at the Health Promotion Center of Kangbuk Samsung Hospital, Sungkyunkwan University School of Medicine, Seoul, Korea. Most study participants were the employees of various industrial companies around the country, as well as their family members. The medical health checkup programs were implemented to promote employee health through regular checkups and to enhance the early detection of existing diseases.
- The initial study population comprised 69,143 participants who participated in the medical checkup program between January and December 2010, as well as a repeated medical checkup between January and December 2014. Participants with diabetes in 2010 or missing values were excluded from the study. Finally, a total of 65,856 participants were enrolled in the initial study. The study protocol was approved by the Institutional Review Board of Kangbuk Samsung Hospital (KBSMC 2014-11-030). The requirement for informed consent was waived because the study used non-identified data that were routinely collected during the health screening process.
- Anthropometric measurements and laboratory assessments
- Medical history, medication use, and health-related behavioral data were collected using a self-administered questionnaire. Physical and serum biochemical parameters were measured by trained staff during the health examinations. A current smoker was defined as a participant who replied “yes” to the question “Do you smoke currently?” on the self-questionnaire. Body weight was measured to the nearest 0.1 kg using a digital scale while the participant wore light clothing without shoes. Height was measured to the nearest 0.1 cm. The body mass index (BMI) was calculated as the weight in kilograms divided by the height in meters squared. Trained nurses used standard mercury sphygmomanometers to measure the participants' seated blood pressure.
- All participants were examined after an overnight fast. The hexokinase method was used to measure fasting serum glucose concentrations (Hitachi Modular D2400, Roche, Tokyo, Japan). An enzymatic calorimetric test was used to measure the total cholesterol and triglyceride concentrations. The high and low density lipoprotein cholesterol concentrations were measured using the selective inhibition and a homogeneous enzymatic calorimetric test, respectively. The serum insulin level was measured using an electrochemiluminescence immunoassay and a Modular Analytics E170 device (Roche).
- The presence of diabetes mellitus was determined according to the participants' self-questionnaire responses and fasting serum blood glucose and glycated hemoglobin (HbA1c) levels, as suggested by the American Diabetes Association [24]. In brief, diabetes was defined as a fasting serum glucose level of ≥126 mg/dL or HbA1c of ≥6.5%, a self-reported history of diabetes, or the current use of antidiabetic medication.
- Body composition analysis
- The participants' body compositions were measured using segmental bioelectric impedance analysis (BIA) with eight tactile electrodes according to the manufacturer's instructions (InBody 3.0, Biospace, Seoul, Korea). The lean mass (kg), fat mass (kg), percent fat mass (%), and waist-hip ratio were measured. BIA is a useful and well-correlated measurement of body fat relative to lean mass [2526]. The analyzer calculates the participant's tissue and fluid compartments using an imperceptible electrical current passed through pads placed on one hand and foot. The analyzer uses the measured resistance and reactance values to mathematically calculate the lean mass using the formula V=ρ×H2/R, where the conductive volume (V) represents the lean mass, ρ is the specific resistivity of the conductor, height (H) is the length of the conductor, and body resistance (R) is measured using four surface electrodes placed on the right hand and foot [27].
- Statistical analysis
- The participants were divided into two groups according to either an age cutoff of 50 years or sex, and into four groups according to age (<40, 40 to 49, 50 to 60, and >60 years old). In addition, the participants were divided into six groups by age (<50 years vs. >50 years) and the degree of body weight change during the 4-year period (<−5%, −5% to 5%, and >5%). We compared the weight loss, lean mass loss, and fat mass loss among these six subgroups based on the lowest quartile.
- Data are presented as mean±standard deviation or number with percentages. A one-way analysis of variance and the chi-square test were used to compare changes in the metabolic parameters from the baseline to the 4-year follow-up, as well as the baseline characteristics of the study participants by age and degree of weight change. Tukey B method was used for the post hoc analyses.
- A logistic regression analysis was performed to evaluate the odds ratio (OR) for a rapid annual decrease in lean mass, defined as members in the lowest quartile of the annual percent change in lean mass among different age groups. The cutoffs for quartile groups of annual percent change in lean mass were as follows: <−0.54%, −0.54% to −0.15%, −0.16% to 0.23%, and >0.23% in men; <−0.67%, −0.67% to −0.25%, −0.26% to 0.17%, and >0.17% in women. A stepwise regression model was used for this analysis.
- PASW Statistics version 23.0 (IBM Co., Armonk, NY, USA) was used for the statistical analyses. All reported P values are two-tailed, and a P value <0.05 was considered statistically significant.
METHODS
- The general characteristics of the participants at baseline are presented in Table 1. The mean age of the participants was 39 years, and 59.5% were men. The mean BMI of the participants was 23.3 kg/m2, or slightly overweight.
- Changes of metabolic parameters at baseline and 4-year follow-up according to age cutoff of 50 years and gender
- Over the 4-year interval, the overall changes in body weight were 0.40 kg among participants younger than 50 years and −0.34 kg among those 50 years or older (Table 2). Both the change in lean mass and percent change in lean mass were significantly greater in the older group (−0.92 kg vs. −0.48 kg and −1.41% vs. −0.74%, respectively; P<0.01) (Table 2). Additionally, the change in fat mass and percent change in fat mass were significantly smaller in the older group (0.71 kg vs. 0.92 kg and 1.16% vs. 1.50%, respectively; P<0.01) (Table 2).
- When the participants were divided into two groups by sex, the change in lean mass and percent change in lean mass were significantly greater in women relative to men (−0.58 kg vs. −0.46 kg and −1.03% vs. −0.61%, respectively; P<0.01) (Table 2). Furthermore, women had a significantly greater percent increase in fat mass, compared with men (1.66% vs. 1.36%, P<0.01) (Table 2).
- Comparison of the mean metabolic parameter values among the groups divided by age and weight change
- The subjects were divided into six groups by age (cutoff, 50 years) and body weight loss degree (<−5%, −5% to 5%, and >5%) over 4 years (Table 3). Of the 65,856 participants, most exhibited weight changes within the range of −5% to 5% (n=47,583, 72.2%); 11.1% (n=7,364) had weight changes <−5%, and 16.7% (n=10,909) had weight changes >5% (Table 3).
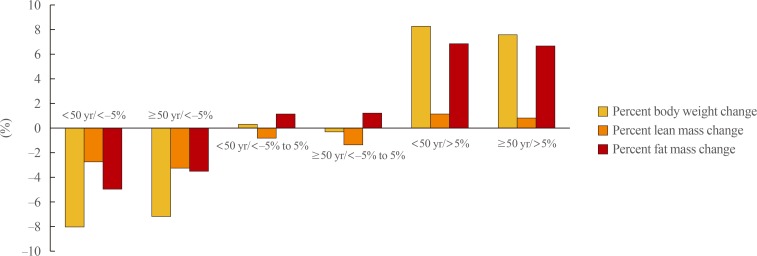
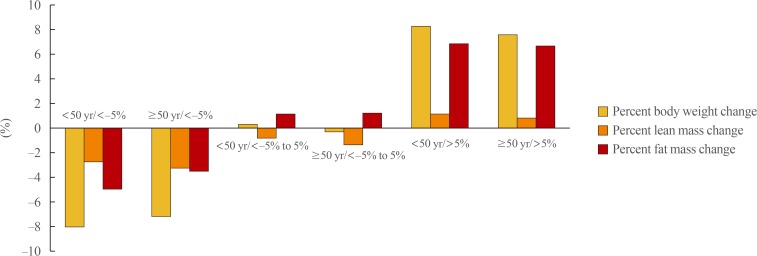
- Participants aged ≥50 years had significantly greater absolute losses in lean mass relative to those aged <50 years in both the <−5% and −5% to 5% weight change groups (−1.92 kg vs. −2.20 kg and −0.57 kg vs. −0.88 kg, respectively; P<0.01) (Table 3, Fig. 1). Similar results were observed for the percent change in lean mass (−2.81% vs. −3.29% and −0.89% vs. −1.36%, respectively; P<0.01). Otherwise, the absolute and percent losses of fat mass were significantly smaller among those aged ≥50 years versus those aged <50 years in the <−5% weight change group (−2.41 kg vs. −3.49 kg and −3.62% vs. −5.06%, respectively; P<0.01). Among participants who gained weight (>5%) during the 4-year period, the absolute and percent changes in lean mass were significantly smaller among participants aged ≥50 years than among those aged <50 years (0.60 kg vs. 0.83 kg and 0.89% vs. 1.25%, respectively; P<0.01) (Table 3, Fig. 1).
- Changes over time in the percent changes of lean mass and fat mass by age and sex
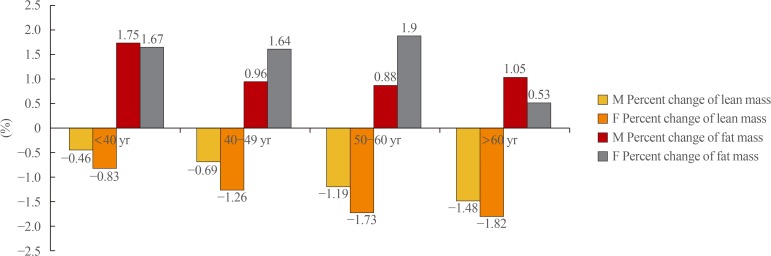
- Greater percent decreases in lean mass over the 4-year period were observed with increasing age, regardless of sex (Fig. 2). However, women experienced a greater percent decrease in lean mass relative to men, and older participants (≥50 years) experienced a greater decrease relative to younger participants. Regarding fat mass, women of all age groups younger than 60 years had similar differences in the percent change in fat mass over 4 years, whereas those aged ≥60 had a relatively smaller percent increase in fat mass. Among men, the percent increase in fat mass began to decrease from age 40 to 49 years and exhibited a similar trend thereafter (Fig. 2).
- Risk for rapid annual decrease of lean mass
- When the ORs for a rapid decrease in the percent lean mass, defined as members in the lowest quartile of the percent change in lean mass, were analyzed in different age groups, we observed a significantly increase in the OR with age (Table 4). Participants aged ≥60 years had a more than 2-fold increased risk of a rapid decrease in the percent lean mass, compared to those aged ≤40 years old after adjusting for confounding variables (OR, 2.081; 95% confidence interval, 1.678 to 2.581) (Table 4).
RESULTS
- In this large population study of young, non-diabetic Korean participants in a health check-up program, we found that the percent change in lean mass decreased and the percent change in fat mass increased as the participants aged. When participants were divided into two groups according to an age cutoff of 50 years, those older than 50 years had a significantly greater decrease in lean mass relative to those younger than 50 years. In addition, the decrease in lean mass with aging was more prominent among women than among men.
- In aging humans, the muscle mass decreases despite an increase in body weight [2829]. Recent studies have shown significant associations between sarcopenia, muscle mass and strength, and increased mortality in the elderly [3031]. A decreased muscle mass results in a decrease in the muscle strength needed to support the skeletal structure, leading to reduced bone mass and an increased incidence of osteoporosis in the elderly [32]. Most studies of the relationship of muscle mass and strength with metabolic disease have been performed in the elderly. By contrast, the results of our study suggest the importance of muscle mass maintenance, even in a relatively young population.
- In our study, women had a significantly higher tendency toward a decreased lean mass with increasing age, compared with men. Women generally have a greater proportion of fat tissue and smaller proportion of lean mass, compared with men [33]. Therefore, one might assume that women would experience smaller weight losses relative to men because of this remaining fat mass. This supposition has been proven in several previous studies [7152834]. However, women in our study population had greater weight losses relative to men. This difference might be attributable to the relatively younger population of female participants, compared to those in other previous studies. The mean age of our study population was 39.1 years, and most female participants were perimenopausal. Data from cross-sectional and longitudinal studies suggest that the greatest rate of decline in lean mass may occur during the perimenopausal years, followed by a more gradual decline thereafter [3536].
- One strength of our study is the demonstration for the first time that even among young women, weight loss would lead to a greater loss of lean mass with increasing age. Postmenopausal women often experience a decrease in lean mass and increase in fat mass [37], and often an increase in body weight. However, our study observed a steady decrease in body weight and a decrease in fat mass with aging among women. This difference might be attributable to racial differences between the Asian women who participated in our study and women of Caucasian or African descent who participated in previous studies, or to other individual medical factors such as the use of hormone replacement therapy [3839].
- Our study also has a few limitations. First, this was a single-center study, and therefore may not be generalizable to the entire Korean population. Second, as we did not consider individual medication histories, we could evaluate the potential effects of medications such as hormone replacement therapy. Third, the 4-year follow-up period was fairly short, and a longer follow-up is needed to investigate actual patterns of changes in body composition. Lastly, we excluded patients with diabetes at baseline to avoid bias, but did not absolutely exclude other diseases that could influence body weight, such as chronic kidney disease [40], albuminuria [41], or hidden malignancy [42], because our study based on medical checkup program in apparently healthy young people. In fact, there were relatively small numbers of participants who answered ‘yes’ to the question of past history of cancer (~less than 200 subjects), which proportion that could rarely affect the result of this study. Nevertheless, our study is clinically important in that it is the first large-population retrospective study of healthy Korean young adults to demonstrate changing body composition patterns.
- In conclusion, we observed body weight changes and body composition changes during a large 4-year follow-up study of non-diabetic Korean young adults, and found that the lean mass significantly decreased with increasing age, even among relatively young adults. In addition, women had a greater risk of a rapid decrease in lean mass, relative to men. This difference in body composition during the 4-year study might be attributable to aging processes and sex-related genetic differences, as well as racial differences. A larger population that includes multiple races and is conducted over a longer period of time is needed to understand the mechanism underlying the observed changes in body composition patterns; thus, facilitating the application of these findings to the management of elderly and social health.
DISCUSSION
-
CONFLICTS OF INTEREST: No potential conflict of interest relevant to this article was reported.
Article information
- 1. World Health Organization. Obesity and overweight [Internet]; Geneva: World Health Organization; c2017. cited 2017 Oct 19. Available from: http://www.who.int/mediacentre/factsheets/fs311/en/.
- 2. Garthe I, Raastad T, Sundgot-Borgen J. Long-term effect of nutritional counselling on desired gain in body mass and lean body mass in elite athletes. Appl Physiol Nutr Metab 2011;36:547–554. ArticlePubMed
- 3. Seo MH, Rhee EJ. Metabolic and cardiovascular implications of a metabolically healthy obesity phenotype. Endocrinol Metab (Seoul) 2014;29:427–434. ArticlePubMedPMC
- 4. Kang YM, Jung CH, Cho YK, Jang JE, Hwang JY, Kim EH, et al. Visceral adiposity index predicts the conversion of metabolically healthy obesity to an unhealthy phenotype. PLoS One 2017;12:e0179635. ArticlePubMedPMC
- 5. Choi KM. Sarcopenia and sarcopenic obesity. Endocrinol Metab (Seoul) 2013;28:86–89. ArticlePubMedPMC
- 6. Newman AB, Yanez D, Harris T, Duxbury A, Enright PL, Fried LP, et al. Weight change in old age and its association with mortality. J Am Geriatr Soc 2001;49:1309–1318. ArticlePubMed
- 7. Newman AB, Lee JS, Visser M, Goodpaster BH, Kritchevsky SB, Tylavsky FA, et al. Weight change and the conservation of lean mass in old age: the Health, Aging and Body Composition Study. Am J Clin Nutr 2005;82:872–878. ArticlePubMedPDF
- 8. Arnold AM, Newman AB, Cushman M, Ding J, Kritchevsky S. Body weight dynamics and their association with physical function and mortality in older adults: the Cardiovascular Health Study. J Gerontol A Biol Sci Med Sci 2010;65:63–70. ArticlePubMedPDF
- 9. Williamson DF, Pamuk ER. The association between weight loss and increased longevity. A review of the evidence. Ann Intern Med 1993;119(7 Pt 2):731–736. ArticlePubMed
- 10. Allen TH, Anderson EC, Langham WH. Total body potassium and gross body composition in relation to age. J Gerontol 1960;15:348–357. ArticlePubMedPDF
- 11. Pierson RN Jr, Lin DH, Phillips RA. Total-body potassium in health: effects of age, sex, height, and fat. Am J Physiol 1974;226:206–212. ArticlePubMed
- 12. Borkan GA, Norris AH. Fat redistribution and the changing body dimensions of the adult male. Hum Biol 1977;49:495–513. PubMed
- 13. Chumlea WC, Garry PJ, Hunt WC, Rhyne RL. Distributions of serial changes in stature and weight in a healthy elderly population. Hum Biol 1988;60:917–925. PubMed
- 14. Roberts SB, Fuss P, Heyman MB, Evans WJ, Tsay R, Rasmussen H, et al. Control of food intake in older men. JAMA 1994;272:1601–1606. ArticlePubMed
- 15. Visser M, Pahor M, Tylavsky F, Kritchevsky SB, Cauley JA, Newman AB, et al. One- and two-year change in body composition as measured by DXA in a population-based cohort of older men and women. J Appl Physiol (1985) 2003;94:2368–2374. ArticlePubMed
- 16. Hughes VA, Frontera WR, Roubenoff R, Evans WJ, Singh MA. Longitudinal changes in body composition in older men and women: role of body weight change and physical activity. Am J Clin Nutr 2002;76:473–481. ArticlePubMedPDF
- 17. Karvonen-Gutierrez C, Kim C. Association of mid-life changes in body size, body composition and obesity status with the menopausal transition. Healthcare (Basel) 2016;4:E42Article
- 18. Lovejoy JC, Champagne CM, de Jonge L, Xie H, Smith SR. Increased visceral fat and decreased energy expenditure during the menopausal transition. Int J Obes (Lond) 2008;32:949–958. ArticlePubMedPMCPDF
- 19. Wellons M, Ouyang P, Schreiner PJ, Herrington DM, Vaidya D. Early menopause predicts future coronary heart disease and stroke: the Multi-Ethnic Study of Atherosclerosis. Menopause 2012;19:1081–1087. ArticlePubMedPMC
- 20. Chen H, Bermudez OI, Tucker KL. Waist circumference and weight change are associated with disability among elderly Hispanics. J Gerontol A Biol Sci Med Sci 2002;57:M19–M25. ArticlePubMedPDF
- 21. Houston DK, Stevens J, Cai J, Morey MC. Role of weight history on functional limitations and disability in late adulthood: the ARIC study. Obes Res 2005;13:1793–1802. ArticlePubMed
- 22. Lee JS, Kritchevsky SB, Tylavsky F, Harris T, Simonsick EM, Rubin SM, et al. Weight change, weight change intention, and the incidence of mobility limitation in well-functioning community-dwelling older adults. J Gerontol A Biol Sci Med Sci 2005;60:1007–1012. ArticlePubMedPDF
- 23. Launer LJ, Harris T, Rumpel C, Madans J. Body mass index, weight change, and risk of mobility disability in middle-aged and older women. The epidemiologic follow-up study of NHANES I. JAMA 1994;271:1093–1098. ArticlePubMed
- 24. American Diabetes Association. 2. Classification and diagnosis of diabetes. Diabetes Care 2017;40(Suppl 1):S11–S24. ArticlePubMed
- 25. Wang H, Hai S, Cao L, Zhou J, Liu P, Dong BR. Estimation of prevalence of sarcopenia by using a new bioelectrical impedance analysis in Chinese community-dwelling elderly people. BMC Geriatr 2016;16:216. ArticlePubMedPMCPDF
- 26. Gibson AL, Holmes JC, Desautels RL, Edmonds LB, Nuudi L. Ability of new octapolar bioimpedance spectroscopy analyzers to predict 4-component-model percentage body fat in Hispanic, black, and white adults. Am J Clin Nutr 2008;87:332–338. ArticlePubMedPDF
- 27. Kyle UG, Genton L, Karsegard L, Slosman DO, Pichard C. Single prediction equation for bioelectrical impedance analysis in adults aged 20: 94 years. Nutrition 2001;17:248–253. ArticlePubMed
- 28. Forbes GB. Longitudinal changes in adult fat-free mass: influence of body weight. Am J Clin Nutr 1999;70:1025–1031. ArticlePubMedPDF
- 29. Williamson DF. Descriptive epidemiology of body weight and weight change in U.S. adults. Ann Intern Med 1993;119(7 Pt 2):646–649. Article
- 30. Brown JC, Harhay MO, Harhay MN. Sarcopenia and mortality among a population-based sample of community-dwelling older adults. J Cachexia Sarcopenia Muscle 2016;7:290–298. ArticlePubMed
- 31. Roshanravan B, Patel KV, Fried LF, Robinson-Cohen C, de Boer IH, Harris T, et al. Association of muscle endurance, fatigability, and strength with functional limitation and mortality in the health aging and body composition study. J Gerontol A Biol Sci Med Sci 2017;72:284–291. ArticlePubMedPDF
- 32. Verschueren S, Gielen E, O'Neill TW, Pye SR, Adams JE, Ward KA, et al. Sarcopenia and its relationship with bone mineral density in middle-aged and elderly European men. Osteoporos Int 2013;24:87–98. ArticlePubMedPDF
- 33. Mauvais-Jarvis F. Sex differences in metabolic homeostasis, diabetes, and obesity. Biol Sex Differ 2015;6:14ArticlePubMedPMCPDF
- 34. Heitmann BL, Garby L. Composition (lean and fat tissue) of weight changes in adult Danes. Am J Clin Nutr 2002;75:840–847. ArticlePubMedPDF
- 35. Poehlman ET, Toth MJ, Gardner AW. Changes in energy balance and body composition at menopause: a controlled longitudinal study. Ann Intern Med 1995;123:673–675. ArticlePubMed
- 36. Aloia JF, McGowan DM, Vaswani AN, Ross P, Cohn SH. Relationship of menopause to skeletal and muscle mass. Am J Clin Nutr 1991;53:1378–1383. ArticlePubMedPDF
- 37. Aloia JF, Vaswani A, Russo L, Sheehan M, Flaster E. The influence of menopause and hormonal replacement therapy on body cell mass and body fat mass. Am J Obstet Gynecol 1995;172:896–900. ArticlePubMed
- 38. Sorensen MB, Rosenfalck AM, Hojgaard L, Ottesen B. Obesity and sarcopenia after menopause are reversed by sex hormone replacement therapy. Obes Res 2001;9:622–626. ArticlePubMed
- 39. Chen Z, Bassford T, Green SB, Cauley JA, Jackson RD, LaCroix AZ, et al. Postmenopausal hormone therapy and body composition: a substudy of the estrogen plus progestin trial of the Women's Health Initiative. Am J Clin Nutr 2005;82:651–656. ArticlePubMedPDF
- 40. Souza VA, Oliveira D, Barbosa SR, Correa JODA, Colugnati FAB, Mansur HN, et al. Sarcopenia in patients with chronic kidney disease not yet on dialysis: analysis of the prevalence and associated factors. PLoS One 2017;12:e0176230. ArticlePubMedPMC
- 41. Han E, Lee YH, Kim G, Kim SR, Lee BW, Kang ES, et al. Sarcopenia is associated with albuminuria independently of hypertension and diabetes: KNHANES 2008-2011. Metabolism 2016;65:1531–1540. ArticlePubMed
- 42. Solheim TS, Blum D, Fayers PM, Hjermstad MJ, Stene GB, Strasser F, et al. Weight loss, appetite loss and food intake in cancer patients with cancer cachexia: three peas in a pod?: analysis from a multicenter cross sectional study. Acta Oncol 2014;53:539–546. ArticlePubMed
References
Comparison of the mean percent change of body weight, lean mass, and fat mass among three groups divided by the percent weight change over 4 years and age at baseline.
General Characteristics of the Participants at Baseline and after 4 Years (n=65,856)
Baseline Values and Changes in Metabolic Parameters during the 4-Year Follow-up Period
Comparison of Mean Metabolic Parameter Values among the Groups Divided by Age and Weight Changea
Odds Ratios for a Rapid Annual Decrease in Lean Mass (Lowest Quartilea)
Model 1, no adjustment; Model 2, adjusted for sex, body mass index; Model 3, adjusted for model 2 plus fat mass, lean mass, glycated hemoglobin, and waist circumference; Model 4, model 3 plus exercise, alcohol drinking, and smoking status.
aThe cutoffs for the lowest quartile groups are as follows: <−0.54% in men, <−0.67% in women.
Figure & Data
References
Citations

- Obesity, Physical Performance, Balance Confidence, and Falls in Community-Dwelling Older Adults: Results from the Korean Frailty and Aging Cohort Study
Ga Yang Shim, Myung Chul Yoo, Yunsoo Soh, Jinmann Chon, Chang Won Won
Nutrients.2024; 16(5): 614. CrossRef - Multisystem physiological perspective of human frailty and its modulation by physical activity
Joseph A. Taylor, Paul L. Greenhaff, David B. Bartlett, Thomas A. Jackson, Niharika A. Duggal, Janet M. Lord
Physiological Reviews.2023; 103(2): 1137. CrossRef - Partial weight reduction protocols in cats lead to better weight outcomes, compared with complete protocols, in cats with obesity
Alexander J. German, Georgiana R. T. Woods-Lee, Vincent Biourge, John Flanagan
Frontiers in Veterinary Science.2023;[Epub] CrossRef - Multifaceted effects of obesity on cancer immunotherapies: Bridging preclinical models and clinical data
Logan V. Vick, Robert J. Canter, Arta M. Monjazeb, William J. Murphy
Seminars in Cancer Biology.2023; 95: 88. CrossRef - Age-Related Trends in Body Composition among Women Aged 20–80 Years: A Cross-Sectional Study
Nirmala Rathnayake, Hasanga Rathnayake, Sarath Lekamwasam, Aron Weller
Journal of Obesity.2022; 2022: 1. CrossRef - Increased Consumption of Unsaturated Fatty Acids Improves Body Composition in a Hypercholesterolemic Chinese Population
Sumanto Haldar, Shalini Ponnalagu, Farhana Osman, Shia Lyn Tay, Long Hui Wong, Yuan Rong Jiang, Melvin Khee Shing Leow, Christiani Jeyakumar Henry
Frontiers in Nutrition.2022;[Epub] CrossRef - Development and Evaluation of a Low-cost Dairy Food Supplement with Mauritia Flexuosa (Buriti) to Combat Malnutrition: Translational Study in Mice and Institutionalized Elderly Woman
Audrey Handyara Bicalho, Fabio Ribeiro Santos, Daniele Cristina Moreira, Victor Hugo Dantas Guimarães, Guilherme Henrique Ribeiro, Alfredo Mauricio Batista De Paula, André Luis Sena Guimarães, Ulisses A. Pereira, Theles Costa, Caroline Liboreiro Paiva, Ma
Current Aging Science.2022; 15(1): 37. CrossRef - The missense variant, rs373863828, in CREBRF plays a role in longitudinal changes in body mass index in Samoans
Haoyi Fu, Nicola L. Hawley, Jenna C. Carlson, Emily M. Russell, Alysa Pomer, Hong Cheng, Take Naseri, Muagututi‘a Sefuiva Reupena, Ranjan Deka, Courtney C. Choy, Stephen T. McGarvey, Ryan L. Minster, Daniel E. Weeks
Obesity Research & Clinical Practice.2022; 16(3): 220. CrossRef - Relationship Between Handgrip Strength and the Prevalence of Diabetes Mellitus Among Korean Adults: Korean National Health and Nutrition Examination Survey, 2014-2018
Sung-hyun Hong, Ji-yong Byeon, Ji-hee Min, Dong-hyuk Park, Won-hee Cho, Justin Y. Jeon
Exercise Science.2021; 30(1): 110. CrossRef - Cutoff points of adiposity anthropometric indices for low muscle mass screening in middle-aged and older healthy women
Rafaela Andrade do Nascimento, Mariana Carmem Apolinário Vieira, Rafaella Silva dos Santos Aguiar Gonçalves, Mayle Andrade Moreira, Maria Socorro Medeiros de Morais, Saionara Maria Aires da Câmara, Álvaro Campos Cavalcanti Maciel
BMC Musculoskeletal Disorders.2021;[Epub] CrossRef - Edema-like symptoms are common in ultra-distance cyclists and driven by overdrinking, use of analgesics and female sex – a study of 919 athletes
Philipp Gauckler, Jana S. Kesenheimer, Andreas Kronbichler, Fiona R. Kolbinger
Journal of the International Society of Sports Nutrition.2021;[Epub] CrossRef - Prevalence of low muscle mass and associated factors in community-dwelling older adults in Singapore
Siew Ling Tey, Dieu Thi Thu Huynh, Yatin Berde, Geraldine Baggs, Choon How How, Yen Ling Low, Magdalin Cheong, Wai Leng Chow, Ngiap Chuan Tan, Samuel Teong Huang Chew
Scientific Reports.2021;[Epub] CrossRef - Effects of low skeletal muscle mass and sarcopenic obesity on albuminuria: a 7-year longitudinal study
Jee Hee Yoo, Gyuri Kim, Sung Woon Park, Min Sun Choi, Jiyeon Ahn, Sang-Man Jin, Kyu Yeon Hur, Moon-Kyu Lee, Mira Kang, Jae Hyeon Kim
Scientific Reports.2020;[Epub] CrossRef - Age group and gender-wise comparison of obesity indices in subjects of Varanasi
Kumar Sarvottam, Prabhat Ranjan, Umashree Yadav
Indian Journal of Physiology and Pharmacology.2020; 64: 109. CrossRef - DNA Methylation in Inflammatory Pathways Modifies the Association between BMI and Adult-Onset Non-Atopic Asthma
Ayoung Jeong, Medea Imboden, Akram Ghantous, Alexei Novoloaca, Anne-Elie Carsin, Manolis Kogevinas, Christian Schindler, Gianfranco Lovison, Zdenko Herceg, Cyrille Cuenin, Roel Vermeulen, Deborah Jarvis, André Amaral, Florian Kronenberg, Paolo Vineis, Nic
International Journal of Environmental Research and Public Health.2019; 16(4): 600. CrossRef - Body shape, fear of falling, physical performance, and falls among individuals aged 55 years and above
Sheng Hui Kioh, Sumaiyah Mat, Shahrul B. Kamaruzzaman, Fatimah Ibrahim, Mas Sahidayana Mokhtar, Noran N. Hairi, Robert G. Cumming, Phyo Kyaw Myint, Maw Pin Tan
European Geriatric Medicine.2019; 10(5): 801. CrossRef - Low lean tissue mass can be a predictor of one-year survival in hemodialysis patients
Aleksandra Rymarz, Julia Gibińska, Maria Zajbt, Wiesław Piechota, Stanisław Niemczyk
Renal Failure.2018; 40(1): 231. CrossRef - Relationship Between Relative Skeletal Muscle Mass and Nonalcoholic Fatty Liver Disease: A 7‐Year Longitudinal Study
Gyuri Kim, Seung‐Eun Lee, You‐Bin Lee, Ji Eun Jun, Jiyeon Ahn, Ji Cheol Bae, Sang‐Man Jin, Kyu Yeon Hur, Jae Hwan Jee, Moon‐Kyu Lee, Jae Hyeon Kim
Hepatology.2018; 68(5): 1755. CrossRef - Association between abdominal obesity and increased risk for the development of hypertension regardless of physical activity: A nationwide population‐based study
Eun‐Jung Rhee, Jung‐Hwan Cho, Hyemi Kwon, Se‐Eun Park, Jin‐Hyung Jung, Kyung‐Do Han, Yong‐Gyu Park, Hye Soon Park, Yang‐Hyun Kim, Soon‐Jib Yoo, Won‐Young Lee
The Journal of Clinical Hypertension.2018; 20(10): 1417. CrossRef - Decreasing Lean Body Mass with Age: Challenges and Opportunities for Novel Therapies
Chrysoula Boutari, Christos S. Mantzoros
Endocrinology and Metabolism.2017; 32(4): 422. CrossRef
 PubReader
 Cite
Cite XML Download