
Articles
- Page Path
- HOME > Endocrinol Metab > Volume 39(2); 2024 > Article
-
Original ArticleDiabetes, obesity and metabolism Effects of an Electronic Medical Records-Linked Diabetes Self-Management System on Treatment Targets in Real Clinical Practice: Retrospective, Observational Cohort Study
-
So Jung Yang1
 , Sun-Young Lim1, Yoon Hee Choi2,3, Jin Hee Lee4, Kun-Ho Yoon1,2
 -
Endocrinology and Metabolism 2024;39(2):364-374.
DOI: https://doi.org/10.3803/EnM.2023.1878
Published online: March 21, 2024
1Department of Medical Informatics, College of Medicine, The Catholic University of Korea, Seoul, Korea
2Division of Endocrinology and Metabolism, Department of Internal Medicine, Seoul St. Mary’s Hospital, College of Medicine, The Catholic University of Korea, Seoul, Korea
3Medical Excellence Inc., Seoul, Korea
4The Catholic Institute of Smart Healthcare Center, The Catholic University of Korea, Seoul, Korea
- Corresponding authors: Jin Hee Lee The Catholic Institute of Smart Healthcare Center, The Catholic University of Korea, 222 Banpo-daero, Seocho-gu, Seoul 06591, Korea Tel: +82-2-3147-9565, Fax: +82-2-2258-8297, E-mail: jheelee@catholic.ac.kr
- Kun-Ho Yoon Department of Medical Informatics, College of Medicine, The Catholic University of Korea, 222 Banpo-daero, Seocho-gu, Seoul 06591, Korea Tel: +82-2-2258-8262, Fax: +82-2-2258-8297, E-mail: yoonk@catholic.ac.kr
Copyright © 2024 Korean Endocrine Society
This is an Open Access article distributed under the terms of the Creative Commons Attribution Non-Commercial License (http://creativecommons.org/licenses/by-nc/4.0/) which permits unrestricted non-commercial use, distribution, and reproduction in any medium, provided the original work is properly cited.
- 415 Views
- 10 Download
ABSTRACT
-
Background
- This study evaluated the effects of a mobile diabetes management program called “iCareD” (College of Medicine, The Catholic University of Korea) which was integrated into the hospital’s electronic medical records system to minimize the workload of the healthcare team in the real clinical practice setting.
-
Methods
- In this retrospective observational study, we recruited 308 patients. We categorized these patients based on their compliance regarding their use of the iCareD program at home; compliance was determined through self-monitored blood glucose inputs and message subscription rates. We analyzed changes in the ABC (hemoglobin A1c, blood pressure, and low-density lipoprotein cholesterol) levels from the baseline to 12 months thereafter, based on the patients’ iCareD usage patterns.
-
Results
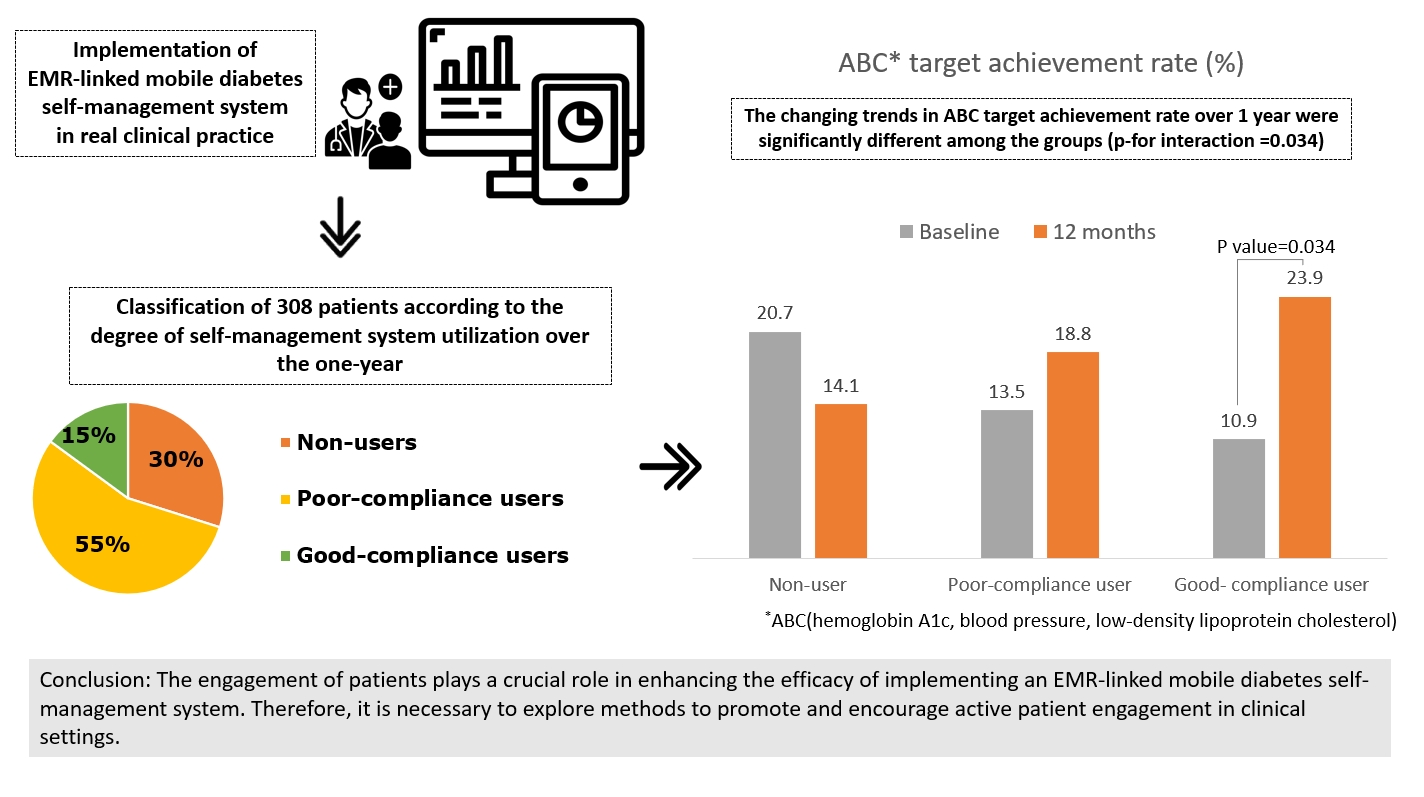
- The patients comprised 92 (30%) non-users, 170 (55%) poor-compliance users, and 46 (15%) good-compliance users; the ABC target achievement rate showed prominent changes in good-compliance groups from baseline to 12 months (10.9% vs. 23.9%, P<0.05), whereas no significant changes were observed for poor-compliance users and non-users (13.5% vs. 18.8%, P=0.106; 20.7% vs. 14.1%, P=0.201; respectively).
-
Conclusion
- Implementing the iCareD can improve the ABC levels of patients with diabetes with minimal efforts of the healthcare team in real clinical settings. However, the improvement of patients’ compliance concerning the use of the system without the vigorous intervention of the healthcare team needs to be solved in the future.
- The epidemic of type 2 diabetes mellitus and its chronic complications are a major concern all over the world [1]. The detection rate of the disease and achievement of treatment goals in diabetes have not reached appropriate levels not only in underdeveloped or developing countries but also in developed countries [1,2]. This has resulted in a phenomenal increase in total medical expenditure in all countries [3]. With complications such as microvascular disease, the management costs further increase by 4.7 times [4].
- To prevent complications and provide comprehensive care for diabetes, we should treat not only the blood glucose levels but also blood pressure and cholesterol. In accordance with the American Diabetes Association standard of care for diabetes, the components of the comprehensive diabetes medical evaluation include blood pressure and cholesterol along with blood glucose level [5]. Thus, it is crucial to evaluate blood pressure, cholesterol, and blood glucose levels when we explore the effectiveness of care for diabetes.
- Patients’ empowerment and engagement are the most important factors [6-8] to achieve the treatment target to prevent chronic debilitating complications of the disease [9]. However, patients’ motivation regarding their disease management is the most important treatment barrier [10] and is hard to overcome with the current analogue medical system model that depends on face-to-face contact. For decades, many studies have reported the effects of mobile healthcare programs for diabetes care, but the results were inconsistent [11-16]. The most important factor for effective diabetes care involving mobile health care programs is the patient’s compliance in using the program. To enhance the compliance of patients, frequent contact, education, and motivation [17] of the patients by the care team (including physicians, nutritionists, and nurses) is essential [18]. The workload of the care team incurs considerable medical costs, without a proper incentive system in place [19,20]. Most of the programs are run temporarily, only for research purposes.
- To develop a sustainable and adaptable mobile diabetes management program for real clinical practice, our team designed a new diabetes self-management system called “iCareD” (College of Medicine, The Catholic University of Korea, Seoul, Korea). To minimize the time and effort of the care team to make an affordable, cost-effective system, we integrated iCareD into the hospital’s electronic medical records (EMR) system, and the motivational messages were automatically sent out between regular appointments at the outpatient clinics, and the messaging algorithm was set based on our previous studies [21,22]. Patients with urgent questions or problems could contact the care team through the program. Since iCareD was launched in April 2017, the system has been tested for several years, and we have been managing diabetes in real-world settings and not under controlled conditions (as in the previous randomized controlled trials).
- This retrospective observational study aimed to explore the effects of controlling ABC (hemoglobin A1c [HbA1c], blood pressure, and low-density lipoprotein cholesterol [LDL-C]) on diabetes using the iCareD in a real clinical setting.
INTRODUCTION
- Ethical considerations
- All procedures were in accordance with the ethical standards of the responsible committee on human experimentation (institutional and national) and with the Helsinki Declaration of 1975, as revised in 2000. This study was approved by the Institutional Review Board of St. Mary’s Hospital, Seoul (KIRB-018524-025). Written informed consent was not required because this retrospective observational study was performed without intervention.
- Study population
- This study was conducted on patients with diabetes who visited the outpatient clinic. The medical staff introduced the diabetes management service to the patients using the EMR-linked mobile application iCareD. For patients who consented to use the service after receiving overall instructions on their health data and iCareD, the medical staff installed the application on their mobile phones and provided instructions on how to use it. When a patient registered as a member, consent was obtained for their data to be linked to the service platform and for medical staff to utilize their data for treatment.
- During regular medical visits thereafter, doctors utilized information from iCareD to provide customized treatment and education to patients. This study targeted patients with type 1 and type 2 diabetes who were over 19 years old and agreed to use the application.
- EMR-liked diabetes self-management system (iCareD)
- The iCareD integrates an EMR-linked physician’s website with the patients’ mobile application; it was introduced in the endocrinology department of our hospital. Of the five physicians who volunteered to use iCareD, two actively used it in their clinics. We retrospectively extracted 1-year real-world data of patients seen by the two physicians (i.e., data recorded since the patients’ first visit [April 2017 to November 2019]). The iCareD integrates two databases (the CMCnU [EMR of Catholic Medical Center] and the patient-faced databases) connected to an interface server. The system is powered by a mobile phone where the iCareD application is installed.
- First, the CMCnU database (physician side) contains joining or withdrawal information, institutional codes, and hospital registration numbers. The physicians can see the patient list virtually, select the patient, and then access the EMR-linked website in a real-world setting. Second, the self-management server, i.e., the customer database, consists of biological and hospital data (laboratory results, body weight, height, body mass index [BMI], and messages from the physicians or medical staff). On the other hand, patients were required to download the application, request service usage, complete real-name authentication, and actively utilize the application. On the day the patient registered, they were first asked to read and agree to the terms of use. Thereafter, a trained clinical research coordinator (CRC) checked the patient’s identity by comparing it with the EMR data for the first time only and provided a brief introduction of the iCareD application for approximately 15 minutes; the patient’s identification (ID) was then linked to their assigned physician. After this process, the designated physician could see the registered patient’s status. Subsequently, during an outpatient visit, physicians reviewed the patient’s self-monitored dataset, comprising data such as blood sugar levels, blood pressure readings, physical activity metrics, and dietary intake. This information was then utilized to facilitate both patient care and counselling objectives. Specifically, tailored counselling sessions were provided to patients who demonstrated proficient engagement with the application and effectively amassed relevant data, while those who had not utilized the application were proactively encouraged to adopt its usage.
- The iCareD has several features that reduce the workload for physicians. The weekly and monthly reports are generated automatically, and each patient’s current health status is analyzed and summarized. Without requiring their physicians’ intervention, patients can see their analysis results and maintain their blood glucose at an optimal level. Motivational messages are also automatically sent to the patients on a weekly and monthly basis considering various metabolic factors (such as the type of diabetes, BMI, fasting blood sugar [FBS] level, sex, age, and comorbidities) and other risk factors (prehypertension, abdominal obesity, elevated triglycerides, decreased high-density lipoprotein cholesterol [HDL-C] levels, and prediabetes status). The functionalities integrated into the application are implemented as algorithms that conform to the guidelines for diabetes treatment [23].
- Clinical data collection
- After initiating the application service, clinical data were collected on the HbA1c, FBS, blood pressure (systolic [SBP], diastolic [DBP]), and lipid profiles (triglycerides, HDL-C, and LDL-C levels) to examine the glucose-lowering effect and chronic disease-prevention impact of this application in real-world settings.
- We obtained the clinical results over time. Because this was a non-interventional study, we gathered the clinical data retrospectively. In terms of the baseline results, we allowed –30 days to 1 day (application registration day) from baseline; based on the initiation of the application service, we collected clinical laboratory data at 3, 6, 9, and 12 months after initiation. After each visit, we also allowed an interval of ±1 month for each time point due to the retrospective study design. In addition, we collected data on medication use before and after 1 year of iCareD usage. When it comes to the change in medication (insulin or oral medication) before and after, we considered a timeframe of –30 days to 1 day (starting from the day of application registration).
- The administrator and authorized persons could access a patient’s registration file only with the patient’s registration number. Thus, the CRC matched the patient’s number using the application registration number, and the data were locked, i.e., any access or editing was not permitted. Using an electronic mail service, the administrator then transferred the patient’s ID with an automatically generated password to the assigned CRC to retrospectively collect the laboratory data. The CRC collected the laboratory data at five time points: baseline and 3, 6, 9, and 12 months after registration. Using these data, we analyzed the blood glucose-lowering effect of the iCareD system.
- Group definition
- To define the degree of compliance, we calculated the number of self-monitored blood glucose (SMBG) inputs and message subscription rates using a specific formula: (total number of messages read/total number of messages sent)×100. This can be used to detect the level of compliance with the diabetes management system. After uploading the patients’ SMBG data in the iCareD system application, additional tasks included linking a Bluetooth glucometer or manual recording and saving the patient’s assigned data. For the message subscription, when the “message read” status was on, the patient clicked the message and entered the message section to see the contents. Therefore, when the patient inputted the SMBG data or had a high message subscription rate, it indicated that the patient was complying well with the mobile application services.
- We classified the patients into three groups: “non-users,” “poor-compliance users,” and “good-compliance users.” During enrolment, the patients’ baseline SMBG data were input involuntarily. Users (both poor- and good-compliance users) comprised those who used the iCareD system for more than 3 days (including the first day), i.e., their SMBG data were input voluntarily for more than 2 days. Conversely, non-users comprised those who used the iCareD system for less than 3 days or achieved non-compliance with SMBG input or message subscription. Good-compliance users were those who complied with the recommended frequency of SMBG inputs and showed good-compliance with the message subscription rate. At enrolment, we instructed the patients to check their SMBG data at least once a day for when the target range of HbA1c was achieved. Good compliance was defined as achieving more than 50% of the recommended SMBG frequency [21] and showing 100% compliance with message subscriptions. Poor-compliance users were those who did not comply with the recommended frequency of SMBG inputs, achieved less than 50% of the recommended SMBG frequency, or showed poor-compliance with message subscriptions.
- Therefore, to analyze the factors that could affect glucose levels or chronic disease care, we merged each patient’s data on the application (including the number of SMBG inputs and messages read), with the clinical laboratory data from the EMR (both collected over a period of 1 year). Because not all patients were registered on the same day, we separately followed each patient for 1 year. The first and last patients were enrolled in April 2017 and November 2018, respectively.
- For supplemental analysis, we navigated ABC drug usages across groups (non-user, poor-compliance users, good-compliance users) from baseline to 1-year and if there were no change in type and dosage of medication, we defined its status as ‘no change,’ and if addition or increased dosage of medication, and if reduction or decrease in the number of medication, we classified those to ‘increased’ and ‘decreased,’ respectively.
- Privacy protection
- At the time of the study, privacy protection and confidentiality were ensured by encrypting data that could identify the patients based on their personal information in accordance with the Korean Personal Information Protection Act. The data were managed by assigning a random ID to classify the patients during data collection, and only a designated researcher was able to access the data linking the patients’ identifying information with their IDs in the hospital.
- Statistical analysis
- To test the differences among variables at baseline and follow-up between the groups (non-users, poor-compliance users, and good-compliance users), we used the chi-square test for categorical variables and either analysis of variance or the Kruskal-Wallis test depending on the normality of the continuous variables. If there were significant differences between groups in the continuous variables, multiple comparison tests based on the Bonferroni correction were applied.
- In each group, we tested the differences in the changes of the 1-year levels of HbA1c, weight, BMI, SBP, DBP, and LDL-C using a paired t test or a non-parametric test, Wilcoxon signed rank test. Moreover, within the P values in each group, differences in changes in 1-year ABC target achievement rate were estimated by performing the McNemar’s test. The participants who met all three criteria (HbA1c <7.0%, SBP/DBP <130/80 mm Hg, and LDL-C <100 mg/dL) were categorized as the ABC target achievement group. To investigate the effect of a 1-year use of the EMR-linked diabetes self-management system on HbA1c levels and ABC target achievement rates compared to baseline, generalized estimating equation (GEE) models were used. GEE models for HbA1c were built with an exchangeable correlation structure to allow for analyses of repeated measurements at baseline, 3, 6, 9, and 12 months. If significant interaction effects between time and group were present, to understand the interaction, the significance of the differences in each variable over time was tested according to the group. To study 1-year pre-post change of ABC medication data among groups, ABC medication usage after 1-year usage of iCareD was compared to baseline and the number of patients of each group was analyzed using chi-square test and Fisher’s exact test was applied in cases where the expected frequencies were less than 5 and constituted more than 20% of the total. Statistical analyses were performed using the SPSS software version 24.0 for Windows (IBM Corp., Armonk, NY, USA).
METHODS
- Baseline characteristics
- A total of 308 patients were included in this study (female, 146 [47.4%]) (Table 1). Among these, 29 (9.4%) and 279 (90.6%) patients had type 1 and type 2 diabetes, respectively. Their average age was 58.3±12.9 years. Furthermore, 92 (30%), 170 (55%), and 46 (15%) patients were classified as “non-users,” “poor-compliance users,” and “good-compliance users,” respectively. The BMIs did not differ significantly among these groups (non-users 24.0±3.1 kg/m2, poor-compliance users 24.2±3.3 kg/m2, and good-compliance users 24.5±3.5 kg/m2; P=0.763). No significant differences in clinical outcomes were observed among the three groups. The baseline ABC medication was analyzed among groups and categorized into three categories: glucose-modifying agents (metformin, dipeptidyl peptidase-4 inhibitors, sodium-glucose co-transport 2 [SGLT2] inhibitors, sulfonylureas, alpha-glucosidase inhibitors, thiazolidinediones, glucagon-like peptide-1 receptor agonists, rapid/short-acting insulins, and basal insulins [intermediate/long-acting]), blood pressure-modifying agents (renin-angiotensin system blockers [angiotensin-converting inhibitors and angiotensin II receptor blockers], calcium channel blockers, and diuretics), and lipid-modifying agents (statins, fibric acid derivatives, and ezetimibe). Among glucose-modifying drugs, the SGLT2 inhibitors and basal insulins (intermediate/long-acting) were statistically different (P<0.05), but overall usage of glucose-modifying agents, blood pressure-modifying agents, and lipid-modifying agents were not significantly different (P>0.05) across groups.
- Changes in HbA1c levels according to the usage of the EMR-linked diabetes self-management system by time
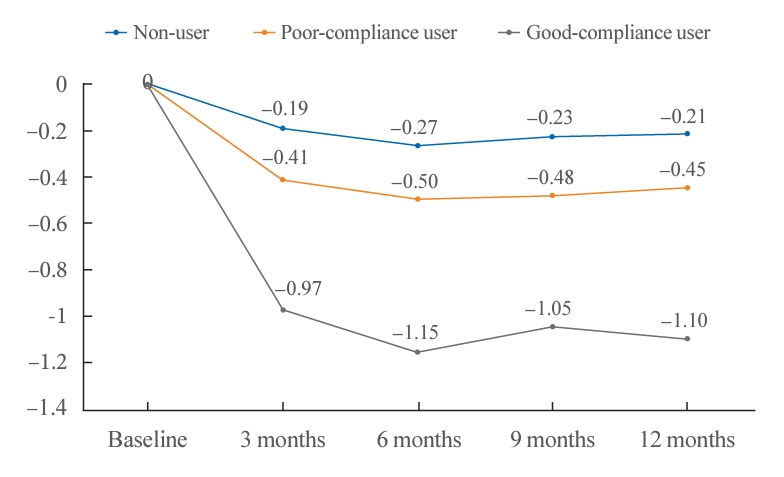
- The changes in the HbA1c values over time were not significantly different among the groups, and there were no interactions among the groups (P for interaction=0.171) (Fig. 1). The HbA1c value from baseline in non-users did not change significantly over time (baseline, 3, 6, 9, and 12 months: 7.7, 7.5, 7.5, 7.5, and 7.5, respectively; P=0.407). However, the HbA1c level from baseline was significantly improved over time in good-compliance users (baseline, 3, 6, 9, and 12 months after registration: 8.3, 7.3, 7.1, 7.2, and 7.2, respectively; P<0.001) and in poor-compliance users (baseline, 3, 6, 9, and 12 months after registration: 7.8, 7.4, 7.3, 7.4, and 7.4, respectively; P<0.001).
- Changes in 1-year ABC levels according to the usage of the EMR-linked diabetes self-management system
- The changes in 1-year HbA1c levels according to the time of the visit significantly differed among the groups (P=0.01) (Table 2). The mean values of HbA1c in non-users did not change significantly over time (baseline 7.7±1.8; and 12 months after registration 7.5±1.3; P=0.642). However, they changed significantly over time in good-compliance users (baseline 8.3±1.7; and 12 months after registration 7.2±0.9; P<0.001) and in poor-compliance users (baseline 7.8±1.4; and 12 months after registration 7.4±1.1; P<0.001). Post hoc analysis of the degree of HbA1c level change at 12 months in the three groups showed a significant difference (P<0.05).
- The mean values of BMI in non-users also did not change significantly over time (baseline 66.7±12.2; and 12 months after registration 66.4±12.2; P=0.251). However, they changed significantly over time in good-compliance users (baseline 24.5±3.5; and 12 months after registration 24.1±3.2; P<0.01). Post hoc analysis of the degree of 1-year BMI change was not significantly different among the groups (P=0.06 and P=0.07, respectively).
- The changes in the LDL-C according to the time of visit were significantly different among the groups (P<0.05). The mean values of LDL-C in non-users did not change significantly over time (baseline 81.6±29.4; and 12 months after registration 81.5±25.5; P=0.442). However, they changed significantly over time in good-compliance users (baseline 89.2±26.4; and 12 months after registration 79.4±23.4; P<0.05) and in poor-compliance users (baseline 87.4±32.8; and 12 months after registration 79.3±24.3; P<0.05). Post hoc analysis of the degree of 1-year LDL-C change in the three groups showed significant differences from the baseline levels (P<0.05).
- Changes in 1-year ABC target achievement rate (%) according to the usage of the EMR-linked diabetes self-management system
- The ABC target achievement rates were defined as HbA1c <7% [24], blood pressure (SBP/DBP) <130/80 mm Hg [25], and LDL-C <100 mg/dL [26]. The changing trends in ABC target achievement rate over 1 year were significantly different among the groups (P for interaction=0.034) (Table 3). The ABC target achievement rate was not significantly different among the groups at each point. However, when we analyzed groups separately, we observed a significant improving trend of ABC target achievement rate in a good-compliance group before and after 1 year. The ABC target achievement rate in non-users and the poor-compliance users did not change significantly after 1 year of usage (20.7 and 14.1 [baseline and 1-year], P=0.201; and 13.5 and 18.8 [baseline and 1-year], P=0.106; respectively). However, they changed significantly over time in good-compliance users (baseline 10.9; and 12 months after registration 23.9; P=0.034).
- Changes in 1-year ABC medication based on the utilization of the EMR-linked diabetes self-management system
- The number of changes in the ABC medications at before and after using of iCareD was not significantly different among the groups (P>0.05). We investigated the number of patients whose prescription was changed (including changes in the type and dosage of medication, as well as addition or increased dosage of medication, and reduction in dose or decrease in medication number in the ABC medication) and the number of patients whose prescription was not changed of each group. We compared changes from baseline to 1-year medication, including dosage in every route. The numbers for all three agents showed no significant differences from the baseline in total users: glucose-modifying agents (P=0.632), blood pressure-modifying agents (P=0.092), and lipid-modifying agents (P=0.195) (Supplemental Table S1).
RESULTS
- This study demonstrated the effects of controlling HbA1c levels and ABC target achievement rates according to the degree of compliance with the EMR-linked diabetes self-management application and revealed a significant improvement in the HbA1c level and ABC target achievement rate from its baseline value. Moreover, it demonstrated that the longer the active use of the application at a high compliance level, the higher the possibility that the target ABC level was achieved. This study is the first to use this system in an environment where medical staff at a medical site could continuously access data from the patients’ applications and view them on the EMR screen at the click of a button.
- Based on the compliance rate (in terms of the SMBG data input frequency and message subscription rate), we found that when patients showed good compliance, their ABC target achievement rates also enhanced after an entire year.
- The active use of the EMR-linked diabetes self-management application (which was equipped with weekly and monthly evaluations and automatically sent motivational messages based on an analysis of the patient’s condition [laboratory results, SMBG data]) was effective in achieving an ABC target range with minimal effort from the medical staff. Unlike other services that provide patients with mobile phones and glucometers for free, which could result in biased results, we uploaded our application to the Apple App Store and Google Play Store and requested the patients to download it voluntarily for use.
- Another crucial factor in another study that leads to good compliance is the patient’s satisfaction with the system or treatment. A diabetes management application was provided to patients with diabetes who were grouped into “satisfied” and “dissatisfied” groups. The more satisfied the patient was, the better the HbA1c-lowering effect [27].
- While the number of prescriptions for ABC-modifying agents that were changed varied among groups, the differences were not statistically significant (Supplemental Table S1). The active utilization of iCareD allowed physicians to meticulously monitor patient data during routine clinical visits, resulting in the prescription of higher dosages aimed at improving the overall ABC levels of patients.
- According to Table 1, the average age of the total population was 58.3±12.9. Due to their advanced age, older adults had a limited likelihood of achieving high compliance. However, when comparing different groups, there were no statistically significant differences in age between each group. Contrary to conventional expectations, recent research suggests that application compliance is not solely determined by age itself; instead, factors such as self-confidence become more relevant, particularly for individuals aged 50 and above [28].
- Moreover, considering the retrospective design without intervention, even with comprehensive guidance given to all users, only 15% of patients consistently complied in the long term. To simplify the workload of medical staff and minimize the frequency of unnecessary interventions, we refrained from providing additional training to patients unless requested. For patients who sought guidance, we offered repetitive training, particularly for those who experienced challenges with the mobile application system during outpatient clinic visits.
- The primary objective of this study was to investigate whether an EMR-linked mobile application could be used efficiently in a real-world setting. Consequently, the percentages of non-users (30%) and users with poor-compliance (55%) were relatively low compared to good-compliance users (15%), which accurately challenges of implementing such an application in the real-world. The non-user group consisted of regular patients who visited outpatient clinics for routine follow-ups. Thus, by presenting the compliance rates among the participants, our aim was to provide an accurate representation of outpatient clinic patients, both with and without access to this EMR-linked diabetes self-management application.
- Because it was not easy to actively encourage clinicians and patients to use the EMR-lined system for over a year, it is crucial to adapt and widely use the EMR-linked diabetes self-management system in real-world clinical settings and encourage both sets of users (physicians and patients) to actively use the mobile application. A strength of our study is that we linked EMR and a mobile health system, which is user-friendly for physicians (e.g., printing a weekly/monthly summary for each patient, monitoring laboratory results along with the patient’s SMBG results); however, there remains room for improvement in terms of encouraging patient engagement.
- Given the importance of maintaining a positive ABC profile in real-world settings, we can expect a positive effect using an EMR-linked diabetes self-management system that does not require extra effort and is sustainable. Because this was an observational study that aimed to investigate this system’s possibilities in a real-world setting, a randomized controlled trial is necessary to evaluate the effectiveness of this system. To engage patients over the long term, clinicians must develop patient-attraction strategies, such as easy-to-use user interfaces/user experiences for patients with low health data literacy. In addition, it could be beneficial to develop a function that summarizes the health data (e.g., clinical laboratory change status and change in prescription) for each clinic as a report that its physicians can easily print.
- In conclusion, this study explored the changes in ABC level with an EMR-linked diabetes self-management system. A clear ABC target achievement effect was observed in patients who actively engaged with the application and managed their health. Furthermore, without strict intervention from or undue pressure on the physicians, the EMR-linked diabetes self-management system operated by sending weekly or monthly analytical reports and motivational messages to the patients and eventually improved the blood glucose control rate. We found that the more actively engaged the user, the better the possibility of achieving the target ABC level (HbA1c <7.0%, SBP/DBP <130/80 mm Hg, and LDL-C <100 mg/dL) over time. Therefore, clinicians should recommend this system and actively utilize it in their clinics to improve the ABC levels of their patients and reduce the risks of comorbidities that arise from high ABC levels. Thus, we developed a novel system that is linked to an EMR database that can perform in real-world settings.
DISCUSSION
Supplementary Material
Supplemental Table S1.
-
CONFLICTS OF INTEREST
There was no financial support or any conflicts of interest with Medical Exellence Inc.
-
AUTHOR CONTRIBUTIONS
Conception or design: S.J.Y., J.H.L., K.H.Y. Acquisition, analysis, or interpretation of data: S.J.Y., S.Y.L., Y.H.C., J.H.L., K.H.Y. Drafting the work or revising: S.J.Y., J.H.L., K.H.Y. Final approval of the manuscript: J.H.L., K.H.Y.
Article information
-
Acknowledgements
- The authors are grateful to Semi-An and Jin Yu for their wonderful assistance and contribution to the implementation of this study. The authors also thank the patients and colleagues who contributed to this study. This research was supported by the R&D Program of the Society of the National Research Foundation, funded by the Ministry of Science and ICT (NRF-2015M3A9D7076174), and by a grant of Patient-Centered Clinical Research Coordinating Center (PACEN) funded by the Ministry of Health & Welfare, Republic of Korea (grant number: HC19C0341). The funders had no role in study design, data collection and analysis, decision to publish, or preparation of the manuscript.
| Characteristic | Total | Non-user | Poor-compliance users | Good-compliance users | P value |
|---|---|---|---|---|---|
| Number | 308 | 92 | 170 | 46 | |
| Male sex | 162 (52.6) | 48 (52.2) | 95 (55.9) | 19 (41.3) | 0.213a |
| Age, yr | 58.3±12.9 | 60.4±13.8 | 58.0±12.2 | 55.2±13.5 | 0.094b |
| Height, cm | 164.7±8.6 | 163.7±8.2 | 165.5±8.7 | 163.5±8.9 | 0.227b |
| Weight, kg | 66.0±12.2 | 64.7±11.5 | 66.7±12.2 | 66.0±13.7 | 0.359b |
| BMI, kg/m2 | 24.2±3.3 | 24.0±3.1 | 24.2±3.3 | 24.5±3.5 | 0.763b |
| DM diagnosed, yr | 14.5±10.3 | 16.6±10.6 | 13.8±10.1 | 12.8±9.5 | 0.057b |
| Type of DM | |||||
| Type 1 DM | 29 (9.4) | 7 (7.6) | 14 (8.2) | 8 (17.4) | 0.131a |
| Type 2 DM | 279 (90.6) | 85 (92.4) | 156 (91.8) | 38 (82.6) | |
| FBS, mg/dL | 153.7±58.3 | 147.5±54.0 | 154.5±58.3 | 162.8±66.3 | 0.664b |
| HbA1c, % | 7.9±1.6 | 7.7±1.8 | 7.8±1.4 | 8.3±1.7 | 0.063b |
| SBP, mm Hg | 122.6±13.8 | 121.4±13.5 | 124.0±14.4 | 119.5±12.0 | 0.091c |
| DBP, mm Hg | 75.2±10.9 | 73.6±10.6 | 76.1±11.3 | 75.0±9.8 | 0.215c |
| LDL-C, mg/dL | 85.9±31.0 | 81.6±29.4 | 87.4±32.8 | 89.2±26.4 | 0.084b |
| Glucose-modifying agents | - | ||||
| Metformin | 68 (73.9) | 126 (74.1) | 28 (60.9) | 0.185 | |
| DPP-4 inhibitors | 45 (48.9) | 102 (60.0) | 22 (47.8) | 0.132 | |
| SGLT2 inhibitors | 24 (26.1) | 27 (15.9) | 4 (8.7) | 0.026f | |
| Sulfonylureas | 27 (29.4) | 48 (28.2) | 13 (28.3) | 0.981 | |
| Alpha-glucosidase-inhibitors | 5 (5.4) | 3 (1.8) | 0 | 0.146d | |
| Thiazolidinediones | 9 (9.8) | 25 (14.7) | 3 (6.5) | 0.233 | |
| GLP-1 receptor agonists | 2 (2.2) | 2 (1.2) | 1 (2.2) | 0.559d | |
| Rapid/short-acting insulins | 23 (25.0) | 37 (21.8) | 15 (32.6) | 0.310 | |
| Basal insulins (intermediate/long-acting) | 12 (13.0) | 29 (17.1) | 16 (34.8) | 0.006g | |
| Blood pressure-modifying agents | - | ||||
| RAS blockerse | 33 (35.9) | 43 (25.3) | 13(28.3) | 0.196 | |
| Calcium channel blockers | 9 (9.8) | 10 (5.9) | 5 (10.9) | 0.372 | |
| Diuretics | 8 (8.7) | 7 (4.1) | 3 (6.5) | 0.314 | |
| Lipid-modifying agents | - | ||||
| Statins | 58 (63.0) | 93 (54.7) | 22 (47.8) | 0.201 | |
| Fibric acid derivatives | 2 (2.2) | 4 (2.4) | 1 (2.2) | 1.000d | |
| Ezetimibe | 5 (5.4) | 14 (8.2) | 6 (13.0) | 0.303 |
Values are expressed as mean±standard deviation or number (%).
BMI, body mass index; DM, diabetes mellitus; FBS, fasting blood sugar; HbA1c, hemoglobin A1c; SBP, systolic blood pressure; DBP, diastolic blood pressure; LDL, low-density lipoprotein cholesterol; DPP-4, dipeptidyl peptidase 4; SGLT2, sodium-glucose co-transport 2; GLP-1, glucagon-like peptide 1; RAS, renin-angiotensin system.
a Chi-square test;
b Kruskal-Wallis test;
c Analysis of variance;
d Fisher’s exact test;
e Angiotensin-converting enzyme inhibitors and angiotensin II receptor blockers;
f P≤0.05;
g P≤0.01.
| Variable | Non-user | Poor-compliance user | Good-compliance user | Between P value (post hoc) | |
|---|---|---|---|---|---|
| HbA1c, % | |||||
| Pre | 7.7±1.8 | 7.8±1.4 | 8.3±1.7 | 0.063b | |
| Post | 7.5±1.3 | 7.4±1.1 | 7.2±0.9 | 0.352b | |
| Diff | −0.2±1.6 | −0.4±1.4 | −1.1±1.8a | 0.014b,e | |
| Within P value | 0.642c | <0.001c,f | <0.001c,f | ||
| Weight, kg | |||||
| Pre | 64.7±11.5 | 66.7±12.2 | 66.0±13.7 | 0.359b | |
| Post | 64.4±10.9 | 66.4±12.2 | 64.8±13.2 | 0.331b | |
| Diff | −0.3±3.5 | −0.3±2.5 | −1.2±2.7 | 0.062b | |
| Within P value | 0.194c | 0.251c | 0.001c,f | ||
| BMI, kg/m2 | |||||
| Pre | 24.0±3.1 | 24.2±3.3 | 24.5±3.5 | 0.763b | |
| Post | 23.9±2.9 | 24.1±3.2 | 24.1±3.2 | 0.984b | |
| Diff | −0.1±1.3 | −0.1±0.9 | −0.5±1.0 | 0.073b | |
| Within P value | 0.247c | 0.223c | 0.001c,f | ||
| SBP, mm Hg | |||||
| Pre | 121.4±13.5 | 124.0±14.4 | 119.5±12.0 | 0.091a | |
| Post | 122.1±13.8 | 123.0±14.1 | 119.6±13.9 | 0.342a | |
| Diff | 0.7±14.9 | −1.0±14.2 | 0.1±14.1 | 0.944b | |
| Within P value | 0.830c | 0.519c | 0.975d | ||
| DBP, mm Hg | |||||
| Pre | 73.6±10.6 | 76.1±11.3 | 75.0±9.8 | 0.215a | |
| Post | 13.8±11.0 | 74.1±11.1 | 72.7±11.9 | 0.736a | |
| Diff | 0.2±10.4 | −2.0±10.5 | −2.3±9.2 | 0.272b | |
| Within P value | 0.873d | 0.039c,e | 0.091d | ||
| LDL-C, mg/dL | |||||
| Pre | 81.6±29.4 | 87.4±32.8 | 89.2±26.4 | 0.084b | |
| Post | 81.5±25.5 | 79.3±24.3 | 79.4±23.4 | 0.787b | |
| Diff | −0.1±23.5 | −8.1±33.6 | −9.8±28.3a | 0.046b,e | |
| Within P value | 0.442c | 0.049c,e | 0.030c,e |
Values are expressed as mean±standard deviation.
ABC, HbA1c, blood pressure, and LDL-C; HbA1c, hemoglobin A1c; BMI, body mass index; SBP, systolic blood pressure; DBP, diastolic blood pressure; LDL-C, low-density lipoprotein cholesterol.
a Statistically significant compared to the non-user group according to multiple comparison tests by the Bonferroni correction;
b Kruskal-Wallis test;
c Signed Rank test;
d Paired t test;
e P≤0.05;
f P≤0.001.
| Variable | Non-user | Poor-compliance user | Good-compliance user | Between P valueb | P value for interactionc | |
|---|---|---|---|---|---|---|
| HbA1c <7%, % | ||||||
| Pre | 33.7 | 27.7 | 26.1 | 0.519 | 0.118 | |
| Post | 34.8 | 39.4 | 47.8 | 0.335 | ||
| Within P valuea | 0.457 | 0.010d | 0.012d | |||
| BP <130/80 mm Hg, % | ||||||
| Pre | 56.5 | 52.4 | 54.4 | 0.810 | 0.207 | |
| Post | 51.1 | 60.0 | 63.0 | 0.279 | ||
| Within P valuea | 0.411 | 0.063 | 0.258 | |||
| LDL-C <100 mg/dL, % | ||||||
| Pre | 76.1 | 72.9 | 67.4 | 0.554 | 0.066 | |
| Post | 76.1 | 81.8 | 84.8 | 0.396 | ||
| Within P valuea | 1.000 | 0.029d | 0.011d | |||
| ABC target achievement rate, % | ||||||
| Pre | 20.7 | 13.5 | 10.9 | 0.207 | 0.034d | |
| Post | 14.1 | 18.8 | 23.9 | 0.354 | ||
| Within P valuea | 0.201 | 0.106 | 0.034d |
- 1. International Diabetes Federation. IDF Diabetes Atlas; 10th ed. Brussels: International Diabetes Federation; 2021.
- 2. Jung CH, Son JW, Kang S, Kim WJ, Kim HS, Kim HS, et al. Diabetes fact sheets in Korea, 2020: an appraisal of current status. Diabetes Metab J 2021;45:1–10.ArticlePubMedPMCPDF
- 3. American Diabetes Association. 3. Comprehensive medical evaluation and assessment of comorbidities. Diabetes Care 2017;40(Suppl 1):S25–32.ArticlePubMedPDF
- 4. Lee KW. Costs of diabetes mellitus in Korea. Diabetes Metab J 2011;35:567–70.ArticlePubMedPMC
- 5. American Diabetes Association. Standards of care in diabetes: 2023 abridged for primary care providers. Clin Diabetes 2022;41:4–31.ArticlePubMedPDF
- 6. Cahn A, Akirov A, Raz I. Digital health technology and diabetes management. J Diabetes 2018;10:10–7.ArticlePubMedPDF
- 7. Perestelo-Perez L, Rivero-Santana A, Abt-Sacks A, Toledo-Chavarri A, Brito N, Alvarez-Perez Y, et al. Patient empowerment and involvement in research. Adv Exp Med Biol 2017;1031:249–64.PubMed
- 8. Abrahams N, Gilson L, Levitt NS, Dave JA. Factors that influence patient empowerment in inpatient chronic care: early thoughts on a diabetes care intervention in South Africa. BMC Endocr Disord 2019;19:133.ArticlePubMedPMCPDF
- 9. American Diabetes Association. Standards of medical care in diabetes: 2022 abridged for primary care providers. Clin Diabetes 2022;40:10–38.ArticlePubMedPMCPDF
- 10. Schmidt SK, Hemmestad L, MacDonald CS, Langberg H, Valentiner LS. Motivation and barriers to maintaining lifestyle changes in patients with type 2 diabetes after an intensive lifestyle intervention (The U-TURN Trial): a longitudinal qualitative Study. Int J Environ Res Public Health 2020;17:7454.ArticlePubMedPMC
- 11. Williams DM, Parsons SN, Dunseath GJ, Stephens JW, Luzio SD, Owens DR. The impact of structured self-monitoring of blood glucose on glycaemic variability in non-insulin treated type 2 diabetes: the SMBG study, a 12-month randomized controlled trial. Diabetes Metab Syndr 2020;14:101–6.PubMed
- 12. Young LA, Buse JB, Weaver MA, Vu MB, Mitchell CM, Blakeney T, et al. Glucose self-monitoring in non-insulintreated patients with type 2 diabetes in primary care settings: a randomized trial. JAMA Intern Med 2017;177:920–9.ArticlePubMedPMC
- 13. Zhu H, Zhu Y, Leung SW. Is self-monitoring of blood glucose effective in improving glycaemic control in type 2 diabetes without insulin treatment: a meta-analysis of randomised controlled trials. BMJ Open 2016;6:e010524.ArticlePubMedPMC
- 14. Davis WA, Bruce DG, Davis TM. Is self-monitoring of blood glucose appropriate for all type 2 diabetic patients? The Fremantle Diabetes Study. Diabetes Care 2006;29:1764–70.ArticlePubMedPDF
- 15. Karter AJ, Parker MM, Moffet HH, Spence MM, Chan J, Ettner SL, et al. Longitudinal study of new and prevalent use of self-monitoring of blood glucose. Diabetes Care 2006;29:1757–63.ArticlePubMedPDF
- 16. Fioravanti A, Fico G, Salvi D, Garcia-Betances RI, Arredondo MT. Automatic messaging for improving patients engagement in diabetes management: an exploratory study. Med Biol Eng Comput 2015;53:1285–94.ArticlePubMedPDF
- 17. de Ridder M, Kim J, Jing Y, Khadra M, Nanan R. A systematic review on incentive-driven mobile health technology: as used in diabetes management. J Telemed Telecare 2017;23:26–35.ArticlePubMedPDF
- 18. Hartz J, Yingling L, Powell-Wiley TM. Use of mobile health technology in the prevention and management of diabetes mellitus. Curr Cardiol Rep 2016;18:130.ArticlePubMedPDF
- 19. Bults M, van Leersum CM, Olthuis TJ, Bekhuis RE, den Ouden ME. Barriers and drivers regarding the use of mobile health apps among patients with type 2 diabetes mellitus in the Netherlands: Explanatory Sequential Design Study. JMIR Diabetes 2022;7:e31451.ArticlePubMedPMC
- 20. Lluch M. Incentives for telehealthcare deployment that support integrated care: a comparative analysis across eight European countries. Int J Integr Care 2013;13:e042.ArticlePubMedPMC
- 21. Yang Y, Lee EY, Kim HS, Lee SH, Yoon KH, Cho JH. Effect of a mobile phone-based glucose-monitoring and feedback system for type 2 diabetes management in multiple primary care clinic settings: cluster randomized controlled trial. JMIR Mhealth Uhealth 2020;8:e16266.ArticlePubMedPMC
- 22. Cho JH, Choi YH, Kim HS, Lee JH, Yoon KH. Effectiveness and safety of a glucose data-filtering system with automatic response software to reduce the physician workload in managing type 2 diabetes. J Telemed Telecare 2011;17:257–62.ArticlePubMedPDF
- 23. Korean Diabetes Association. Treatment guideline for diabetes; 6th ed. Seoul: Medcus; 2019. p. 33-5, 88-100.
- 24. ElSayed NA, Aleppo G, Aroda VR, Bannuru RR, Brown FM, Bruemmer D, et al. 6. Glycemic targets: standards of care in diabetes-2023. Diabetes Care 2023;46(Suppl 1):S97–110.ArticlePubMedPDF
- 25. ElSayed NA, Aleppo G, Aroda VR, Bannuru RR, Brown FM, Bruemmer D, et al. 10. Cardiovascular disease and risk management: standards of care in diabetes-2023. Diabetes Care 2023;46(Suppl 1):S158–90.PubMed
- 26. Jellinger PS, Handelsman Y, Rosenblit PD, Bloomgarden ZT, Fonseca VA, Garber AJ, et al. American Association of Clinical Endocrinologists and American College of Endocrinology guidelines for management of dyslipidemia and prevention of cardiovascular disease. Endocr Pract 2017;23(Suppl 2):1–87.
- 27. Cho JH, Kim HS, Yoo SH, Jung CH, Lee WJ, Park CY, et al. An internet-based health gateway device for interactive communication and automatic data uploading: clinical efficacy for type 2 diabetes in a multi-centre trial. J Telemed Telecare 2017;23:595–604.ArticlePubMedPDF
- 28. Lee M, Kang D, Yoon J, Shim S, Kim IR, Oh D, et al. The difference in knowledge and attitudes of using mobile health applications between actual user and non-user among adults aged 50 and older. PLoS One 2020;15:e0241350.ArticlePubMedPMC
 PubReader
 ePub Link
 Cite
Cite


