Articles
- Page Path
- HOME > Endocrinol Metab > Volume 28(4); 2013 > Article
-
Original ArticleGlycogen Synthase Kinase 3 Inactivation Induces Cell Senescence through Sterol Regulatory Element Binding Protein 1-Mediated Lipogenesis in Chang Cells
- You-Mie Kim1, Insun Song1, Yong-Hak Seo1,2, Gyesoon Yoon1,2
-
Endocrinology and Metabolism 2013;28(4):297-308.
DOI: https://doi.org/10.3803/EnM.2013.28.4.297
Published online: December 12, 2013
1Department of Biochemistry and Molecular Biology, Ajou University School of Medicine, Suwon, Korea.
2Department of Biomedical Science, The Graduate School of Ajou University, Suwon, Korea.
- Corresponding author: Gyesoon Yoon. Department of Biochemistry and Molecular Biology, Ajou University School of Medicine, 206 World cup-ro, Yeongtong-gu, Suwon 443-721, Korea. Tel: +82-31-219-5054, Fax: +82-31-219-5059, ypeace@ajou.ac.kr
• Received: May 9, 2013 • Accepted: July 14, 2013
Copyright © 2013 Korean Endocrine Society
This is an Open Access article distributed under the terms of the Creative Commons Attribution Non-Commercial License (http://creativecommons.org/licenses/by-nc/3.0/) which permits unrestricted non-commercial use, distribution, and reproduction in any medium, provided the original work is properly cited.
- 4,184 Views
- 38 Download
- 16 Crossref
ABSTRACT
-
Background
- Enhanced lipogenesis plays a critical role in cell senescence via induction of expression of the mature form of sterol regulatory element binding protein 1 (SREBP1), which contributes to an increase in organellar mass, one of the indicators of senescence. We investigated the molecular mechanisms by which signaling molecules control SREBP1-mediated lipogenesis and senescence.
-
Methods
- We developed cellular models for stress-induced senescence, by exposing Chang cells, which are immortalized human liver cells, to subcytotoxic concentrations (200 µM) of deferoxamine (DFO) and H2O2.
-
Results
- In this model of stress-induced cell senescence using DFO and H2O2, the phosphorylation profile of glycogen synthase kinase 3α (GSK3α) and β corresponded closely to the expression profile of the mature form of SREBP-1 protein. Inhibition of GSK3 with a subcytotoxic concentration of the selective GSK3 inhibitor SB415286 significantly increased mature SREBP1 expression, as well as lipogenesis and organellar mass. In addition, GSK3 inhibition was sufficient to induce senescence in Chang cells. Suppression of GSK3 expression with siRNAs specific to GSK3α and β also increased mature SREBP1 expression and induced senescence. Finally, blocking lipogenesis with fatty acid synthase inhibitors (cerulenin and C75) and siRNA-mediated silencing of SREBP1 and ATP citrate lyase (ACL) significantly attenuated GSK3 inhibition-induced senescence.
-
Conclusion
- GSK3 inactivation is an important upstream event that induces SREBP1-mediated lipogenesis and consequent cell senescence.
- Cellular senescence is defined as a state in which normal somatic cells lose their ability to divide, due to either prolonged cell division in culture or exposure to subcytotoxic stressors, thereby entering irreversible growth arrest [1]. In addition to loss of replicative capacity, senescent cells display alterations in morphology, mass, and the dynamics of subcellular organelles [2-4]. For example, increases in cellular mass have been documented as a typical feature of senescence and are known to be associated with enlarged cell morphology. However, it is unclear which molecular events have critical roles in these features. An increase in the mass of any specific cellular compartment has been suggested as a potential cause of senescence. For example, lysosomes have long been recognized to increase in both senescent and aged cells [5,6]. Increased mitochondrial mass has also been reported in stress-induced senescence systems [7,8]. These phenomena were thought to be the result of an accumulation of damaged organelles, because senescent lysosomes are known to be nonfunctional [9]. However, the accumulation of indigestible organelles is not sufficient to explain the enlarged morphology observed in senescent cells. We suggested a more plausible explanation based on the results of our recent study, which found that enhanced lipogenesis in response to expression of sterol regulatory element binding protein 1 (SREBP1, also known as SREBF1) is involved in the increase in the organellar mass observed in senescent cells [10].
- SREBP1 is a master transcription factor that regulates the expression of several lipogenic enzymes, including ATP citrate lyase (ACL), acetyl-CoA carboxylase (ACC), and fatty acid synthase (FAS) [11]. During lipid synthesis, ACL converts cytosolic citrate into acetyl-CoA and oxaloacetate, the essential metabolites for lipid biosynthesis, and ACC carboxylates acetyl-CoA to produce malonyl-CoA. FAS then condenses acetyl-CoA and malonyl-CoA to generate long-chain fatty acids. Thus, activation of SREBP1 effectively enhances overall lipid biosynthesis, including fatty acid synthesis and the subsequent synthesis of triglycerides and membrane phospholipids. Enhanced lipogenesis provides the essential membrane components for the formation of subcellular organelles during cell growth [12,13]. SREBP1 is initially localized to the rough endoplasmic reticulum (ER) membrane. Upon activation, it is cleaved to liberate the N-terminal fragment, which contains a basic helix-loop-helix leucine-zipper domain. The cleaved active fragment, called mature-form SREBP1 (mSREBP1), enters the nucleus, where it binds to specific sterol response elements within the promoter regions of the lipogenic genes and activates their transcription [11,14]. Thus, SREBP1 is an excellent target molecule for studies of cellular lipogenesis regulation.
- Glycogen synthase kinase 3 (GSK3) is a serine/threonine kinase that is involved in the control of a wide range of cellular metabolic processes, including insulin sensitivity, glucose metabolism, and cell survival, via regulation of energy homeostasis [15,16]. In addition, it is a multifunctional kinase that performs a regulatory role in diverse cellular functions, such as embryonic development, cellular protein synthesis, mitosis, and survival [16-18]. GSK3 comprises two isoforms, GSK3α and GSK3β, which are negatively regulated by phosphorylation (inactivation) at Ser21 (GSK3α) or Ser9 (GSK3β) by several protein kinases, such as AKT and p90 ribosomal S6 kinase [19]. Although the involvement of GSK3 inhibition in Wnt signaling implies that it has a role in cell proliferation and cancer development [20,21], the death of GSK3β-null mice during embryogenesis as a result of liver degeneration caused by widespread hepatocyte apoptosis also suggests a contrasting role for GSK3, including participation in senescence-associated growth suppression [22]. Recently, we reported that GSK3-mediated glycogenesis is involved in cell senescence [23], which directly supports the importance of GSK3 modulation in cell senescence. Based on these reports, we can place GSK3 downstream of the key insulin like growth factor-1 receptor (IGF-1R)/phosphoinositide 3-kinase (PI3K)/AKT signaling pathway, which is known to regulate cellular and organismal lifespans [24-28].
- We previously reported that levels of the mature form of SREBP1 are commonly increased in Chang cells during cellular senescence induced by several stimuli, including deferoxamine (DFO) and hydrogen peroxide (H2O2). Under these conditions, SREBP1-mediated lipogenesis is critically involved in cellular senescence [10]. However, it was unclear which signaling molecules control the SREBP1-mediated senescence that accompanies enhanced lipogenesis. Recently, GSK3 was shown to modulate SREBP1 activity through phosphorylation-mediated ubiquitination [29]; this implies that GSK3 may play a key role as an upstream regulator in SREBP1-mediated senescence. To address this, we first developed a model for stress-induced senescence by exposing Chang cells, which are immortalized human liver cells, to subcytotoxic concentrations (200 µM) of DFO and H2O2, as described previously [7,30]. By employing these senescence systems, we demonstrated that GSK3 is one of the major regulators of SREBP1-mediated lipogenesis, and its inactivation contributes to the increase in the organellar mass that is a typical characteristic of senescence. Our results suggest a novel molecular background for aging and aging-related pathophysiology.
INTRODUCTION
- Cell culture, cell growth rate and generation of stress-induced senescence
- Chang cells were purchased from the American Type Culture Collection (Rockville, MD, USA) and were cultured in Dulbecco's modified Eagle's medium supplemented with 10% fetal bovine serum (GIBCO, Grand Island, NY, USA) and antibiotics at 37℃ in a humidified incubator with 5% CO2. Chang cells, an immortalized normal human hepatocyte line, were chosen to understand metabolic backgrounds related to stress-induced senescence.
- To evaluate cellular growth rate, cells were harvested by trypsinization and counted with a hemocytometer after staining with 0.4% (w/v) trypan blue (GIBCO) to exclude dead cells. The number of dead cells observed in the progress of the two different stress-induced senescence systems was not significant. The total cell number of trypan blue-negative live cells was determined upon completion of the experiments.
- To generate stress-induced senescence, Chang cells were exposed to the subcytotoxic dose (200 µM) of DFO or H2O2 for the indicated periods, as described previously [7,30].
- Estimation and visualization of subcellular organellar mass
- To estimate cellular organellar mass, cells were stained with organelle-specific fluorescence dyes according to the manufacturer's instruction. Briefly, proper concentrations and incubation periods for each organelle were first determined. Mitotracker Red CMXRos (100 nM, M7512, Molecular Probes, Eugene, OR, USA), Lyso Tracker Green DND-26 (1 µM, L7526, Molecular Probes), and ER Tracker Blue-White DPX (1 µM, E-12353, Molecular Probes) were applied for 30 minutes at 37℃. To stain Golgi body, cells were incubated for 30 minutes at 4℃ with 5 µM boron-dipyrromethene C5-ceramide (D3521, Molecular Probes) after preconjugating the dye with bovine serum albumin and were further incubated in fresh medium at 37℃ for 30 minutes. After staining cells with the dyes, cells were harvested in phosphate-buffered saline (PBS), and their fluorescence intensities were analyzed by flow cytometry (FACSCanto II, Becton Dickinson Corp., San Jose, CA, USA). Subcellular organellar masses are represented as mean value of arbitrary fluorescence units of 10,000 cells.
- To confirm specific staining of subcellular organelles with the dyes, fluorescence images of the stained cells were visualized by Axiovert 200 M with a cooled AxioCam HRm operated by the Axiovision 4.8 software (Carl Zeiss AG, Gottingen, Germany).
- Determination of intracellular reactive oxygen species, cell size, and cell granularity
- To estimate intracellular reactive oxygen species level, cells were stained with 10 µM 2',7'-dichlorodihydrofluorescein diacetate (Molecular Probes) for 15 minutes at 37℃ before performing flow cytometric analysis with FACSCanto II (Becton Dickinson Corp.). Cell size and granularity were evaluated by analyzing forward scatter and side scatter of the stained cells, respectively, as previously described [10].
- Thin layer chromatographic analysis of cellular lipids
- To analyze cellular lipid profiles, cellular lipids were extracted as described by Folch et al. [31] with slight modification. Briefly, the indicated numbers of cells were harvested into glass tubes and mixed with 1 mL of chloroform:methanol (2:1). After vortexing, distilled water (500 µL) was added into the tubes and centrifuged at 1,500 rpm for 15 minutes. The lower chloroform phase was collected and backwashed by adding methanol (300 µL) and distilled water (300 µL). After removing the top layer, chloroform phase were concentrated by evaporating chloroform under N2 gas and were loaded onto thin layer chromatography (TLC) plate (no. 1.05721.0001, 20×20, silica-coated, Merk, Darmstadt, Germany).
- To separate the cellular lipids, we used Kupke and Zeugner's method [32] with a slight modification. Briefly, the chromatogram was first developed in a saturated chamber with solvent I (chloroform:methanol:H2O, 65:30:5) to allow separation of polar lipids. The solvent front was allowed to migrate approximately 10 cm from the bottom of the plate. After evaporating the solvents, the nonpolar lipids were separated by developing the chromatogram with the solvent II (n-hexane:diethyl ether: acetic acid, 80:20:1.5) up to 1 cm from the top of the plate. The plates were dried under a stream of air and sprayed with primulin (Sigma, St Louis, MO, USA) solution (50 µg/mL in acetone :water, 80:20). The plates were dried again, and fluorescent lipid spots were scanned on a UV transilluminator (SL-20, Seoulin Scientific Co., Seoul, Korea) equipped with a camera (PC 1210, Canon Inc., Tokyo, Japan). The densities of lipid spots were estimated using Gel-Pro Analyzer 4.0 software (Media Cybernetics, Silver Spring, MD, USA). Standard lipids were obtained from Sigma: cholesteryl palmitate (CP; C6072), palmitate (PA; P5586), cholesterol (CL; C8667), cardiolipin (CA; C0563), 1,2-diacyl-sn-glycero-3-phospho-L-serine (PS; P7769), L-α-lysophosphatidylcholine (PC; L4129), and 3-snlyso phosphatidyl ethanolamine (PE; L4754).
- Western blot analysis and antibodies
- Cells were washed twice with PBS and lysed with lysis buffer (50 mM Tris-Cl, pH 7.5, 0.1 M NaCl, 1 mM ethylene diaminetetraacetic acid, 1% [v/v] Triton X-100, 10 µg/mL each of aprotinin and leupeptin, and 1 mM phenyl methan sulfonyl fluoride. A portion (30 µg) of the lysate was applied to Western blot analysis as previously described [10]. Antibodies against SREBP1 (cat. 557036) and SREBP2 (cat. 557037) were purchased from BD Biosciences (San Jose, CA, USA), and antibody for α-tubulin (Ab-1) was from Oncogene (Boston, MA, USA). Antibodies against FAS, ACC, and ACL were kindly provided by Prof. Kyung-Sup Kim (Yonsei University, Seoul, Korea). Antibodies against phosphor-GSK3α (pGSK3α, cat. 9337) and phosphor-GSK3β (pGSK3β, cat. 9336) were purchased from Cell Signaling (Beverly, MA, USA). Antibodies for GSK3 (sc-7291) and p21 (sc-397) were purchased from Santa Cruz Biotechnology (Santa Cruz, CA, USA). Antibody against Ab-1 (Oncogene) was used as the primary antibody. The expression level of each protein was estimated by comparing the band intensities exposed on X-ray film using Gel-Pro Analyzer 4.0 software.
- Introduction of siRNA into cells
- Oligonucleotides for GSK3α siRNA (5'-GAAAGACGAGCUUUACCUATT-3'), GSK3β siRNA (5'-CUCAAGAACUGUCAAGUAATT-3'), SREBP1 siRNA #1 (5'-GGCCGAAGGCAGUGCAAGAT-T-3'), SREBP1 siRNA #2 (5'-CCGAAGGCAGUGCAAGAGATT-3'), ACL siRNA #1 (5'-CAAAAUAUGUGGAGUAGUATT-3'), ACL siRNA #2 (5'-UGAAAUG-UCUUGUGUCUUATT-3'), and negative control siRNA (5'-UAGCGACUAAACACAUCAA-3') were produced by Samchully Pharm Co. (Seoul, Korea). siRNA duplexes were introduced into cells using Oligofectamine (Invitrogen, Grand Island, NY, USA) according to the manufacturer's instruction.
- Senescence-associated β-galactosidase assay
- Senescence-associated β-galactosidase (SA-β-gal) activity was assayed at pH 6.0 as described previously [10]. Briefly, cells were washed twice with PBS, fixed to plates by 3.5% formaldehyde for 5 minutes, and then incubated overnight in freshly prepared staining solution (40 mM citrate-phosphate buffer, pH 6.0, containing 1 mg/mL of 5-bromo-4-chloro-3-indolyl-β-D-galactopyranoside [X-gal, Sigma], 5 mM potassium ferrocyanide, 5 mM potassium ferricyanide, 150 mM NaCl, and 2 mM MgCl2). The stains were visible 24 hours after incubation at 37℃. By counting the numbers of the blue-stained and total cells using Image J software (NIH, Bethesda, MA, USA), percentage of SA-β-gal positive cells was obtained to estimate the degree of cellular senescence.
METHODS
- GSK3 phosphorylation (inactivation) occurs prior to increased mSREBP1 levels during stress-induced senescence
- When Chang cells were exposed to 200 µM DFO or 200 µM H2O2, three typical senescence markers-increases in cell size, cellular granularity, and SA-β-gal activity-were clearly observed (Fig. 1A, B). Next, we monitored the expression profile of mSREBP1 and the phosphorylation status of GSK3 during stress-induced senescence. Phosphorylation of GSK3 increased before the increase in mSREBP1 levels in cells in which senescence was induced by either DFO or H2O2 (Fig. 1C). These results imply that GSK3 inactivation may lead to increased mSREBP1 protein levels by blocking the phosphorylation and degradation of mSREBP1. We further examined activation (phosphorylation) status of AKT and S6K to elucidate common upstream modulator of GSK3 in these senescence systems. However, no common upstream signal to inactivate GSK3 was found in the two senescence systems (data not shown), implying that diverse signals activated by different stimuli may converge on GSK3 phosphorylation (inactivation).
- Pharmacological inhibition of GSK3 increases levels of mSREBP1 protein and lipogenesis
- To investigate whether GSK3 inactivation leads to increased mSREBP1 expression during senescence, we employed SB41528, a selective pharmacological inhibitor of GSK3 [33]. GSK3 inhibition by SB415286 was associated with increased mSREBP1 expression (Fig. 2A) and induction of the SREBP1-targeting lipogenic enzymes FAS, cardiolipin synthase, ACC, and ACL (Fig. 2B).
- To further evaluate whether GSK3 inhibition enhances cellular lipogenesis, we extracted total cellular lipids and separated them using TLC. As expected, the amount of total lipids (sum of the lipids indicated by numbers 1 to 5) (Fig. 2C) increased progressively during SB415286-induced senescence; on day 3, they were roughly twice as many compared to baseline measurements. Potential membrane lipids (sum of the lipids indicated by numbers 2 to 5): PE, phosphatidyl serine [PS], CA, and CL) (Fig. 2C) comprised approximately 82% of the total lipids in control cells and increased by 179% in SB412586-induced senescent cells; over the same period, the amount of potential storage lipids (indicated by number 1, CP) (Fig. 2C) increased minimally. These results indicate that GS K3 inhibition enhances cellular lipogenesis through increased mSREBP1 levels and transcriptional activity.
- GSK3 inhibition leads to increased organellar mass and eventually induces senescence in Chang cells
- As shown by the results in Fig. 2, GSK3 inhibition led to an increase in membrane lipids that was greater than the increase in storage lipids. Therefore, we next examined whether the increase in membrane lipid production contributed to the formation of cell organelles. When we monitored the mass of membranous organelles by flow cytometry after staining cells with organelle-specific fluorescence dyes, we found that levels of most intracellular organelles, including mitochondria, lysosomes, ER, and Golgi, increased significantly during GSK3 inhibition-mediated senescence (Fig. 3A). We also observed enlarged cellular morphology, one of the characteristic signs of senescence, in SB415286-induced senescent cells in all of the images of cells incubated with organelle-specific stains (Fig. 3A, lower panels). We eventually confirmed that GSK3 inhibition by SB415286 induced senescence of Chang cells, as shown by increases in cell size and cell granularity and the presence of SA-β-gal activity (Fig. 3B, C).
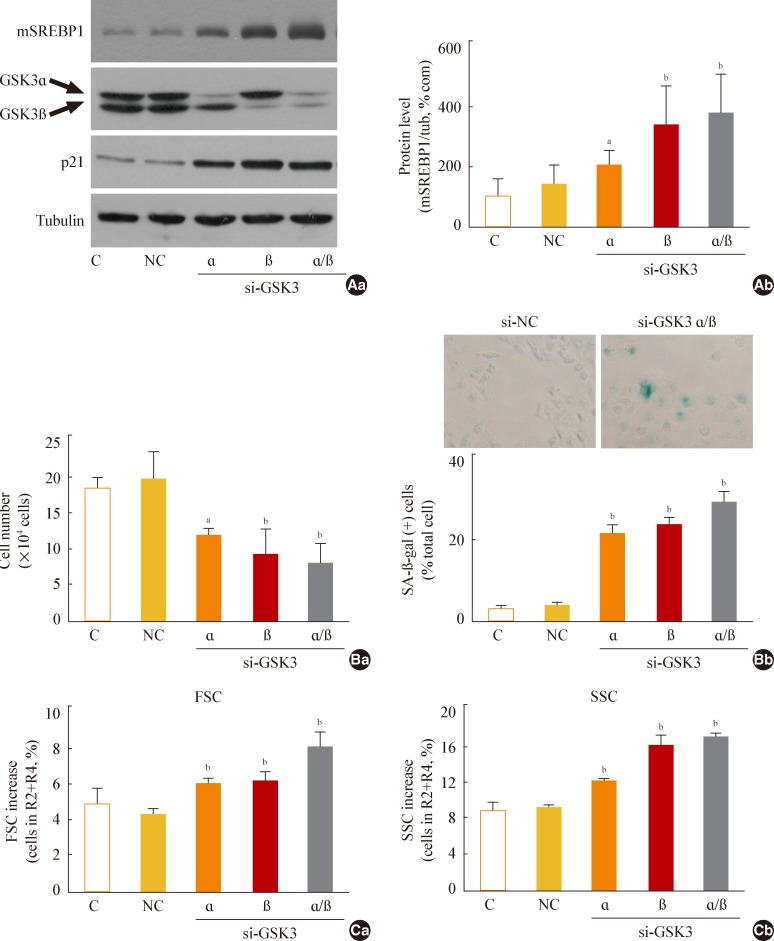
- Next, we further examined whether specific knockdown of GSK3α and β would increase mSREBP1 expression and induce senescence. When we suppressed GSK3α and β expression by siRNA-mediated knockdown, we observed a significant increase in mSREBP1 levels; a delay in the cell growth rate; and senescence phenotypes, such as increases in cell size and cell granularity and gain of SA-β-gal activity (Fig. 4). These data confirm that GSK3 inactivation is linked to cell senescence, along with the accompanying enhanced lipogenesis and increased organellar mass.
- SREBP1-mediated lipogenesis is critically involved in GSK3 inhibition-induced senescence of Chang cells
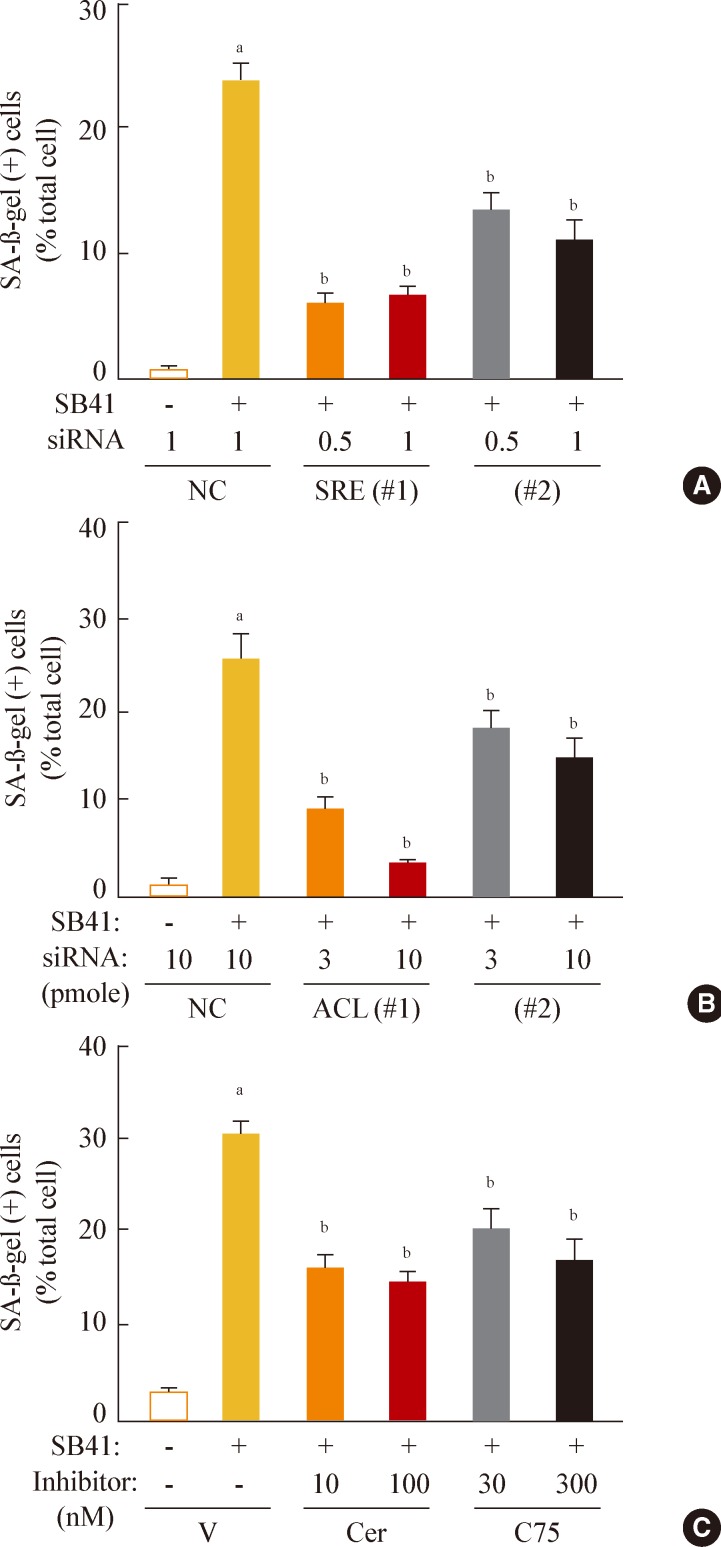
- Finally, we investigated whether inhibition of lipogenesis could reverse GSK3 inhibition-induced senescence. Knockdown of SREBP1 or ACL expression effectively attenuated the SA-β-gal activity induced by GSK3 inhibition (Fig. 5A, B). Moreover, inhibition of lipid synthesis with the FAS inhibitors cerulenin and C75 [34,35] also attenuated GSK3 inhibition-induced senescence (Fig. 5C). These data demonstrate that GSK3 inactivation is an upstream event that induces cellular senescence in Chang cells via SREBP1-mediated lipogenesis. In addition, our results also show that the axis of GSK3/SREBP1/lipogenesis is associated with increased organellar mass, an important indicator of senescence.
RESULTS
- In this study, we clearly demonstrate that inactivation of GSK3 is critically involved in enhanced lipogenesis mediated by SREBP1 and thereby contributes to the increase in organellar mass that is a typical characteristic of senescence. We also found that GSK3 inactivation induces the senescence of Chang cells through SREBP1-mediated lipogenesis. Our results confirm the role of GSK3 as a key metabolic controller that is closely associated with the metabolic phenotype of senescence, and they suggest a novel molecular background for aging and aging-related pathophysiology.
- We previously reported that GSK3-mediated glycogenesis is critically involved in cell senescence [23]; in the present study, we confirmed the role of GSK3 inactivation in lipogenesis-associated cell senescence. Both glycogenesis and lipogenesis are cellular anabolic processes, but their cellular functions are quite different: the former process stores energy, and the latter generates new cellular components. Glycogenesis may occur as the result of minimal use of energy due to the irreversible arrest of cell growth in senescence, while lipogenesis may be a passive cellular defense that is used to maintain the total number of normal cellular organelles in response to organellar damage by senescent stress. However, it is also clear that enhancement of both glycogenesis and lipogenesis act as major contributors of senescence, respectively, as evidenced by the facts that knockdown of glycogen synthase blocked glycogenesis-associated senescence induced by GSK3 knockdown [23] and overexpression of mSREBP1 alone induced senescence [10]. Therefore, these metabolic phenotypes may be double-edged swords for senescence, acting as both a cause of senescence (metabolic stressor) and a consequence of senescence (defensive response).
- There is another important question that remains to be answered: why does senescence enhance such different anabolic processes through inactivation of the single kinase GSK3? Moreover, a recent study suggested yet another role for GSK3 in cell functioning, in which GSK3 inactivation provokes and maintains oxidative stress by triggering mitochondrial respiratory defects [36]. Together, these results imply that GSK3 is a common regulator that activates anabolic processes and inhibits catabolic processes in mitochondria, and they emphasize the role of GSK3 as a metabolic switch to control cell senescence.
- GSK3 has long been known as a negative regulator of glycogen synthesis in response to insulin [17,18]. In addition, GSK3 inhibition was reported to improve insulin resistance by enhancing insulin action in rat skeletal muscle [37], and GSK3 inhibitors, including SB415286, have been developed as drugs for the disease [33]. Contrary to our results, these reports support the protective role of GSK3 inactivation in insulin resistance, an aging-associated disease. On the other hand, an insulin or insulin-like signaling cascade, involving IGF-1 receptor, IRS, PI3K, and AKT, has also been implicated in the control of organismal lifespan and senescence [25,38,39], well supporting that GSK3, one of the major downstream targets of the insulin signal cascade, may participate in senescence. Therefore, at the present stage, it seems that GSK3 has two opposing actions in modulating senescence and alleviating insulin resistance. Nevertheless, one may argue that the concentration (7.5 µg/mL) of SB415286 used in our study was so high that cells were placed in a stress condition. In our previous study, we repeatedly applied a low dose of SB415286 (3.6 µg/mL) to mimic the effect of continuous daily application of the drugs in vivo [23]. Three repeated daily applications with the low dose SB415286 were enough to induce senescence phenotypes, whereas a single treatment of low dose (3.6 µg/mL) SB 415286 did not. Collectively, our results may raise awareness of employing GSK3 modulation in therapeutic approach of insulin resistance.
- In conclusion, our results provide support for an important role for GSK3 in the modulation of SREBP1-mediated lipogenesis and senescence and in the regulation of increases in cellular mass, a phenotype typical of senescence. However, details of the mechanism by which GSK3 controls SREBP1 activity remain unclear, although a recent study indicated that phosphorylation-mediated ubiquitination is involved in the control of SREBP1 activity by GSK3, and that FBw7 is a ubiquitin ligase for SREBP1 [29]. We are currently exploring whether the senescence-associated increase in mSREBP1 expression is the result of blocking Fbw7-mediated ubiquitination or whether it is the result of increased transcriptional activation and/or activated maturation.
DISCUSSION
-
Acknowledgements
- This work was supported by the National Research Foundation of Korea (NRF) grant funded by the Korea government (MSIP) (NRF-2012R1A5A2048183).
ACKNOWLEDGMENTS
- 1. Campisi J, Kim SH, Lim CS, Rubio M. Cellular senescence, cancer and aging: the telomere connection. Exp Gerontol 2001;36:1619–1637. ArticlePubMed
- 2. Cristofalo VJ, Kritchevsky D. Cell size and nucleic acid content in the diploid human cell line WI-38 during aging. Med Exp Int J Exp Med 1969;19:313–320. ArticlePubMed
- 3. Greenberg SB, Grove GL, Cristofalo VJ. Cell size in aging monolayer cultures. In Vitro 1977;13:297–300. ArticlePubMedPDF
- 4. Hwang ES, Yoon G, Kang HT. A comparative analysis of the cell biology of senescence and aging. Cell Mol Life Sci 2009;66:2503–2524. ArticlePubMedPDF
- 5. De Priester W, Van Manen R, Knook DL. Lysosomal activity in the aging rat liver: II. morphometry of acid phosphatase positive dense bodies. Mech Ageing Dev 1984;26:205–216. ArticlePubMed
- 6. Lipetz J, Cristofalo VJ. Ultrastructural changes accompanying the aging of human diploid cells in culture. J Ultrastruct Res 1972;39:43–56. ArticlePubMed
- 7. Yoon YS, Yoon DS, Lim IK, Yoon SH, Chung HY, Rojo M, Malka F, Jou MJ, Martinou JC, Yoon G. Formation of elongated giant mitochondria in DFO-induced cellular senescence: involvement of enhanced fusion process through modulation of Fis1. J Cell Physiol 2006;209:468–480. ArticlePubMed
- 8. Goldstein S, Moerman EJ, Porter K. High-voltage electron microscopy of human diploid fibroblasts during ageing in vitro. Morphometric analysis of mitochondria. Exp Cell Res 1984;154:101–111. ArticlePubMed
- 9. Schmucker DL, Sachs H. Quantifying dense bodies and lipofuscin during aging: a morphologist's perspective. Arch Gerontol Geriatr 2002;34:249–261. ArticlePubMed
- 10. Kim YM, Shin HT, Seo YH, Byun HO, Yoon SH, Lee IK, Hyun DH, Chung HY, Yoon G. Sterol regulatory element-binding protein (SREBP)-1-mediated lipogenesis is involved in cell senescence. J Biol Chem 2010;285:29069–29077. ArticlePubMedPMC
- 11. Horton JD, Shah NA, Warrington JA, Anderson NN, Park SW, Brown MS, Goldstein JL. Combined analysis of oligonucleotide microarray data from transgenic and knockout mice identifies direct SREBP target genes. Proc Natl Acad Sci U S A 2003;100:12027–12032. ArticlePubMedPMC
- 12. Demoulin JB, Ericsson J, Kallin A, Rorsman C, Ronnstrand L, Heldin CH. Platelet-derived growth factor stimulates membrane lipid synthesis through activation of phosphatidylinositol 3-kinase and sterol regulatory element-binding proteins. J Biol Chem 2004;279:35392–35402. ArticlePubMed
- 13. Porstmann T, Santos CR, Lewis C, Griffiths B, Schulze A. A new player in the orchestra of cell growth: SREBP activity is regulated by mTORC1 and contributes to the regulation of cell and organ size. Biochem Soc Trans 2009;37(Pt 1):278–283. ArticlePubMedPDF
- 14. Horton JD, Goldstein JL, Brown MS. SREBPs: activators of the complete program of cholesterol and fatty acid synthesis in the liver. J Clin Invest 2002;109:1125–1131. ArticlePubMedPMC
- 15. Cross DA, Alessi DR, Cohen P, Andjelkovich M, Hemmings BA. Inhibition of glycogen synthase kinase-3 by insulin mediated by protein kinase B. Nature 1995;378:785–789. ArticlePubMedPDF
- 16. Embi N, Rylatt DB, Cohen P. Glycogen synthase kinase-3 from rabbit skeletal muscle. Separation from cyclic-AMP-dependent protein kinase and phosphorylase kinase. Eur J Biochem 1980;107:519–527. ArticlePubMed
- 17. Forde JE, Dale TC. Glycogen synthase kinase 3: a key regulator of cellular fate. Cell Mol Life Sci 2007;64:1930–1944. ArticlePubMedPDF
- 18. Rylatt DB, Aitken A, Bilham T, Condon GD, Embi N, Cohen P. Glycogen synthase from rabbit skeletal muscle. Amino acid sequence at the sites phosphorylated by glycogen synthase kinase-3, and extension of the N-terminal sequence containing the site phosphorylated by phosphorylase kinase. Eur J Biochem 1980;107:529–537. ArticlePubMed
- 19. Bain J, Plater L, Elliott M, Shpiro N, Hastie CJ, McLauchlan H, Klevernic I, Arthur JS, Alessi DR, Cohen P. The selectivity of protein kinase inhibitors: a further update. Biochem J 2007;408:297–315. ArticlePubMedPMCPDF
- 20. Huang W, Chang HY, Fei T, Wu H, Chen YG. GSK3 beta mediates suppression of cyclin D2 expression by tumor suppressor PTEN. Oncogene 2007;26:2471–2482. ArticlePubMedPDF
- 21. Shakoori A, Ougolkov A, Yu ZW, Zhang B, Modarressi MH, Billadeau DD, Mai M, Takahashi Y, Minamoto T. Deregulated GSK3beta activity in colorectal cancer: its association with tumor cell survival and proliferation. Biochem Biophys Res Commun 2005;334:1365–1373. ArticlePubMed
- 22. Hoeflich KP, Luo J, Rubie EA, Tsao MS, Jin O, Woodgett JR. Requirement for glycogen synthase kinase-3beta in cell survival and NF-kappaB activation. Nature 2000;406:86–90. ArticlePubMedPDF
- 23. Seo YH, Jung HJ, Shin HT, Kim YM, Yim H, Chung HY, Lim IK, Yoon G. Enhanced glycogenesis is involved in cellular senescence via GSK3/GS modulation. Aging Cell 2008;7:894–907. ArticlePubMed
- 24. Bartke A. Mutations prolong life in flies: implications for aging in mammals. Trends Endocrinol Metab 2001;12:233–234. ArticlePubMed
- 25. Holzenberger M, Dupont J, Ducos B, Leneuve P, Geloen A, Even PC, Cervera P, Le Bouc Y. IGF-1 receptor regulates lifespan and resistance to oxidative stress in mice. Nature 2003;421:182–187. ArticlePubMedPDF
- 26. Kimura KD, Tissenbaum HA, Liu Y, Ruvkun G. daf-2, an insulin receptor-like gene that regulates longevity and diapause in Caenorhabditis elegans. Science 1997;277:942–946. ArticlePubMed
- 27. Tatar M, Kopelman A, Epstein D, Tu MP, Yin CM, Garofalo RS. A mutant Drosophila insulin receptor homolog that extends life-span and impairs neuroendocrine function. Science 2001;292:107–110. ArticlePubMed
- 28. Tissenbaum HA, Ruvkun G. An insulin-like signaling pathway affects both longevity and reproduction in Caenorhabditis elegans. Genetics 1998;148:703–717. ArticlePubMedPMCPDF
- 29. Punga T, Bengoechea-Alonso MT, Ericsson J. Phosphorylation and ubiquitination of the transcription factor sterol regulatory element-binding protein-1 in response to DNA binding. J Biol Chem 2006;281:25278–25286. ArticlePubMed
- 30. Yoon YS, Byun HO, Cho H, Kim BK, Yoon G. Complex II defect via down-regulation of iron-sulfur subunit induces mitochondrial dysfunction and cell cycle delay in iron chelation-induced senescence-associated growth arrest. J Biol Chem 2003;278:51577–51586. ArticlePubMed
- 31. Folch J, Lees M, Sloane-Stanley GH. A simple method for the isolation and purification of total lipides from animal tissues. J Biol Chem 1957;226:497–509. ArticlePubMed
- 32. Kupke IR, Zeugner S. Quantitative high-performance thin-layer chromatography of lipids in plasma and liver homogenates after direct application of 0.5-microliter samples to the silica-gel layer. J Chromatogr 1978;146:261–271. ArticlePubMed
- 33. Coghlan MP, Culbert AA, Cross DA, Corcoran SL, Yates JW, Pearce NJ, Rausch OL, Murphy GJ, Carter PS, Roxbee Cox L, Mills D, Brown MJ, Haigh D, Ward RW, Smith DG, Murray KJ, Reith AD, Holder JC. Selective small molecule inhibitors of glycogen synthase kinase-3 modulate glycogen metabolism and gene transcription. Chem Biol 2000;7:793–803. ArticlePubMed
- 34. Omura S. The antibiotic cerulenin, a novel tool for biochemistry as an inhibitor of fatty acid synthesis. Bacteriol Rev 1976;40:681–697. ArticlePubMedPMC
- 35. Pizer ES, Chrest FJ, DiGiuseppe JA, Han WF. Pharmacological inhibitors of mammalian fatty acid synthase suppress DNA replication and induce apoptosis in tumor cell lines. Cancer Res 1998;58:4611–4615. PubMed
- 36. Byun HO, Jung HJ, Seo YH, Lee YK, Hwang SC, Hwang ES, Yoon G. GSK3 inactivation is involved in mitochondrial complex IV defect in transforming growth factor (TGF) β1-induced senescence. Exp Cell Res 2012;318:1808–1819. ArticlePubMed
- 37. Dokken BB, Sloniger JA, Henriksen EJ. Acute selective glycogen synthase kinase-3 inhibition enhances insulin signaling in prediabetic insulin-resistant rat skeletal muscle. Am J Physiol Endocrinol Metab 2005;288:E1188–E1194. ArticlePubMed
- 38. Kenyon C. The plasticity of aging: insights from long-lived mutants. Cell 2005;120:449–460. ArticlePubMed
- 39. Miyauchi H, Minamino T, Tateno K, Kunieda T, Toko H, Komuro I. Akt negatively regulates the in vitro lifespan of human endothelial cells via a p53/p21-dependent pathway. EMBO J 2004;23:212–220. ArticlePubMedPMC
References
Fig. 1Increase in glycogen synthase kinase 3 (GSK3) phosphorylation and mature sterol regulatory element binding protein 1 (SREBP1) in stress-induced senescence. Chang cells were treated with 200 µM deferoxamine (DFO) or H2O2 for the indicated periods. Dimethyl sulfoxide (DMSO) was used as vehicle control (V). (A) Flow cytometric analysis of the cell distribution after treatment of the stressors (200 µM DFO or H2O2) for 3 days. Cell size and cell granularity were analyzed by comparing forward scatter (FSC; R2+R4) and side scatter (SSC; R1+R2). Representative profiles (left) and their analyses for cell granularity (SCC analysis, right upper) and cell size (FSC analysis, right lower) are shown. (B) Representative images of senescence-associated β-galactosidase-positive cell populations are shown. (C) Western blot analysis. Quantitative analyses of the expression levels of SREBP1 mature form are shown in the lower panels. mSREBP1, mature-form SREBP1; pGSK, phosphor-GSK. aP<0.01 vs. V (DMSO control).
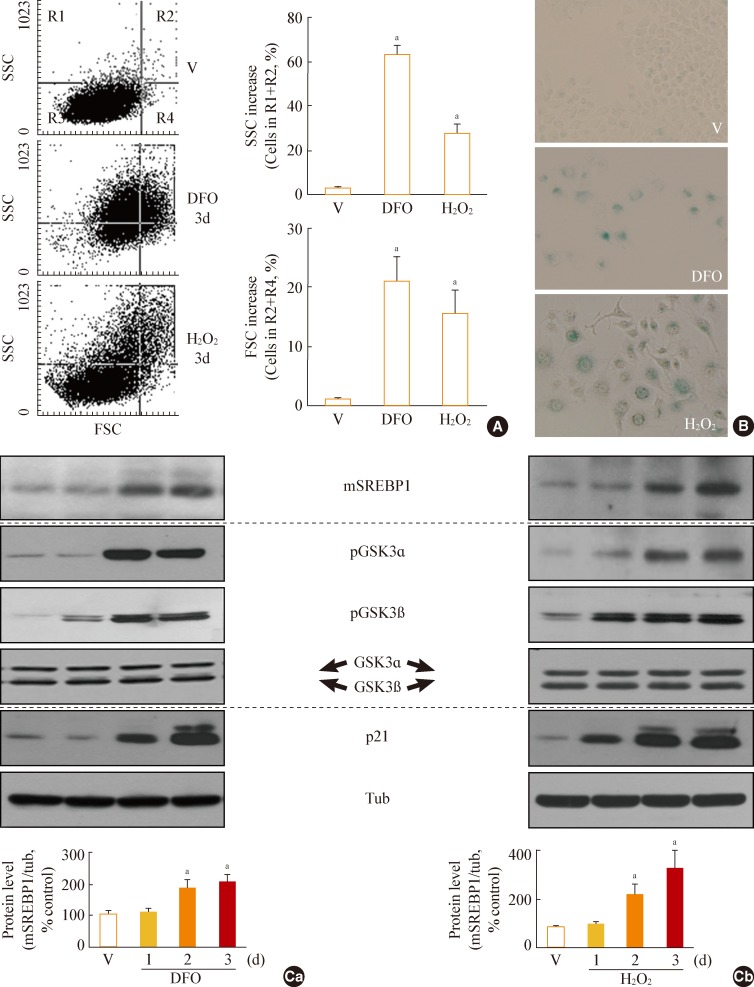
Fig. 2Glycogen synthase kinase 3 (GSK3) inhibition using SB415286, a specific GSK3 inhibitor, enhances cellular lipogenesis. Chang cells were treated with 7.5 µg/mL SB415286 for the indicated periods. Dimethyl sulfoxide (DMSO) was used as vehicle control (V). (A) Western blot analysis of protein expressions of mature sterol regulatory element binding protein 1 (SREBP1). Quantitative analyses of the expression levels of SREBP1 mature form are shown in the lower panels. (B) Western blot analyses for protein expressions of lipogenic enzymes, fatty acid synthase (FAS), acetyl-CoA carboxylase (ACC), ATP citrate lyase (ACL), and cardiolipin synthase (CRLS). (C) Cellular lipid profile of SB415286-treated cells was obtained by thin layer chromatography (TLC) as described in Methods. Representative TLC image (Ca) and quantitative estimation (Cb) of cellular lipids extracted from different numbers of cells are shown. Standard lipid mixture (Std) containing 10 µg each was used. Cholesteryl palmitate (CP, 1) belongs to nonpolar storage lipid, and cholesterol (CL, 2), cardiolipin (CA, 3), phosphatidyl choline (PC, 4) and phosphatidyl serine (PS, 5) belong to membrane lipids. 'd' in the x-axis stands for day. mSREBP1, mature-form SREBP1; PA, palmitate; PE, phosphatidyl ethanolamine. aP<0.01 vs. V (DMSO control).
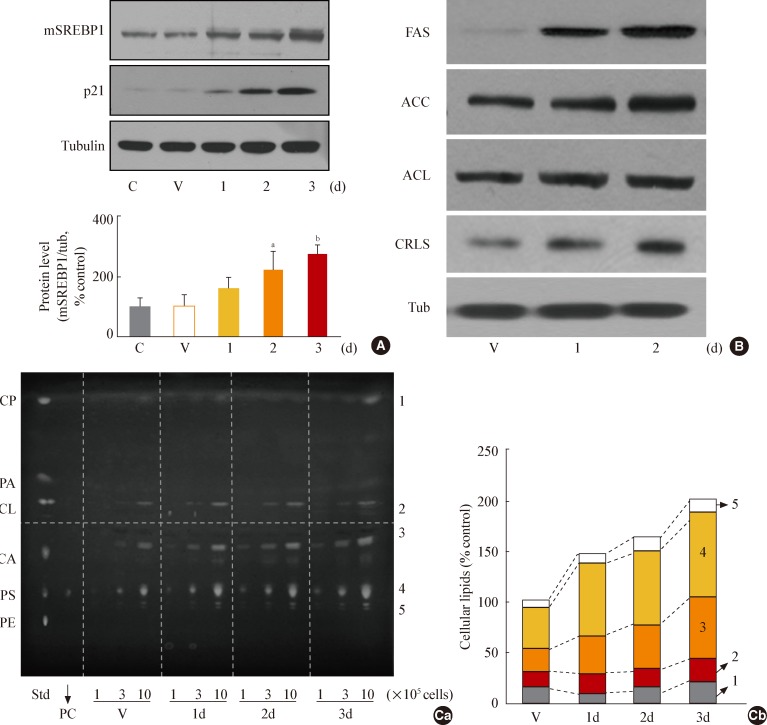
Fig. 3Glycogen synthase kinase 3 (GSK3) inhibition induces senescence of Chang cell, accompanying an increase in cellular membranous organellar mass. Chang cells were treated with 7.5 µg/mL SB415286 (SB) for the indicated periods. Dimethyl sulfoxide (DMSO) was used as vehicle control (V). (A) Subcellular organellar masses were estimated by comparing the fluorescence intensities with flow cytometry after staining cells with organelle-specific dyes as described in Methods. Representative images of the fluorescence stained cells are shown in the lower panels. (B) Cell size and cell granularity were analyzed by comparing forward scatter (FSC; R2+R4) and side scatter (SSC; R1+R2). (Ba) Quantitative analyses for cell size (FSC analysis, left) and cell granularity (SSC analysis, right). (Bb) Representative cell distribution profiles are shown. (C) Quantitative analysis for senescence-associated β-galactosidase-positive cell populations (left) and representative images (right) are shown. ER, endoplasmic reticulum; BODIPY, boron-dipyrromethene. aP<0.01 vs. V (DMSO control).
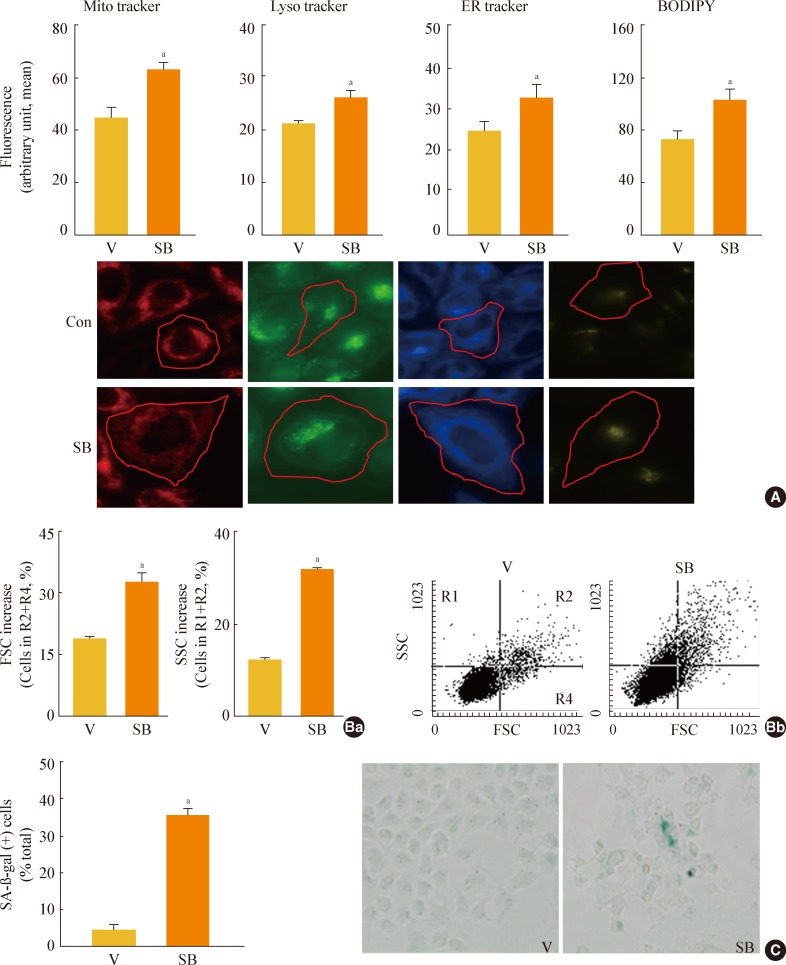
Fig. 4Glycogen synthase kinase 3 (GSK3) knockdown induces senescence, accompanying an increase of mature-form sterol regulatory element binding protein 1 (mSREBP1) expression. Chang cells were transfected with si-GSK3α, si-GSK3β, and both si-GSK3α/β for 3 days. (A) Western blot analysis (Aa) and quantitative analysis (Ab) of mSREBP1 (mature form) levels. (B) (Ba) Cell growth rate. (Bb) Representative images (upper) and quantitative analysis of senescence-associated β-galactosidase-positive cell populations (lower) are shown. (C) Quantitative analyses for cell size (Ca, forward scatter; FSC analysis, left) and cell granularity (Cb, side scatter; SSC analysis, right). aP<0.05; bP<0.01 vs. negative control (NC).

Fig. 5Sterol regulatory element binding protein 1 (SREBP1)-mediated lipogenesis is the key event of glycogen synthase kinase 3 (GSK3) inhibition-induced senescence. Quantitative analysis of senescence-associated β-galactosidase-positive cell populations was used to evaluate the extent of senescence. (A) Chang cells (1×10⁴) seeded on 6-well plates were transfected with siRNAs for SREBP1 and then treated with 7.5 µg/mL SB415286 for 4 days. (B) Chang cells were transfected with siRNAs for ATP citrate lyase (ACL) and then treated with 7.5 µg/mL SB415286 for 4 days. (C) Chang cells were pretreated with the indicated concentrations of cerulenin (Cer; Sigma C2389) and C75 (Sigma 5490) for 24 hours and then further treated with 7.5 µg/mL SB415286 for 4 days. siRNA with a random sequence was used as the negative control (NC), and dimethyl sulfoxide was used as the vehicle control (V). aP<0.05; bP<0.01 vs. NC or V.

Figure & Data
References
Citations
Citations to this article as recorded by 
- Mammalian eIF4E2-GSK3β maintains basal phosphorylation of p53 to resist senescence under hypoxia
Lei Sun, He Yang, Dong He, Jian Chen, Zhiqiang Dong, Shaoxiang Luo, Huiting Liang, Yu Cao, Bingcheng Cai, Min Zhang
Cell Death & Disease.2022;[Epub] CrossRef - The Impact of Oxidative Stress and AKT Pathway on Cancer Cell Functions and Its Application to Natural Products
Jun-Ping Shiau, Ya-Ting Chuang, Jen-Yang Tang, Kun-Han Yang, Fang-Rong Chang, Ming-Feng Hou, Ching-Yu Yen, Hsueh-Wei Chang
Antioxidants.2022; 11(9): 1845. CrossRef - Treadmill Exercise Reduces Neuroinflammation, Glial Cell Activation and Improves Synaptic Transmission in the Prefrontal Cortex in 3 × Tg-AD Mice
Lianwei Mu, Dongdong Xia, Jiajia Cai, Boya Gu, Xiaojie Liu, Vladislav Friedman, Qing-Song Liu, Li Zhao
International Journal of Molecular Sciences.2022; 23(20): 12655. CrossRef - Lysosomes in T Cell Immunity and Aging
Jun Jin, Huimin Zhang, Cornelia M. Weyand, Jorg J. Goronzy
Frontiers in Aging.2021;[Epub] CrossRef - FOXO1 deficiency impairs proteostasis in aged T cells
Jun Jin, Xuanying Li, Bin Hu, Chulwoo Kim, Wenqiang Cao, Huimin Zhang, Cornelia M. Weyand, Jorg J. Goronzy
Science Advances.2020;[Epub] CrossRef - Distinct dual roles of p-Tyr42 RhoA GTPase in tau phosphorylation and ATP citrate lyase activation upon different Aβ concentrations
Kim Cuong Cap, Yeon-Joo Jung, Bo Young Choi, Seung Jae Hyeon, Jae-Gyu Kim, Jung-Ki Min, Rokibul Islam, Abu Jubayer Hossain, Won-Suk Chung, Sang Won Suh, Hoon Ryu, Jae-Bong Park
Redox Biology.2020; 32: 101446. CrossRef - Metabolic features and regulation in cell senescence
So Mee Kwon, Sun Mi Hong, Young-Kyoung Lee, Seongki Min, Gyesoon Yoon
BMB Reports.2019; 52(1): 5. CrossRef - DNA repair deficiency and senescence in concussed professional athletes involved in contact sports
Nicole Schwab, Karl Grenier, Lili-Naz Hazrati
Acta Neuropathologica Communications.2019;[Epub] CrossRef - Oxidative stress-induced downregulation of glycogen synthase kinase 3 beta in fetal membranes promotes cellular senescence†
Narmada Lavu, Lauren Richardson, Enkhtuya Radnaa, Talar Kechichian, Rheanna Urrabaz-Garza, Samantha Sheller-Miller, Elizabeth Bonney, Ramkumar Menon
Biology of Reproduction.2019; 101(5): 1018. CrossRef - Blocking lysophosphatidic acid receptor 1 signaling inhibits diabetic nephropathy in db/db mice
Hui Ying Li, Yoon Sin Oh, Ji-Woong Choi, Ji Yong Jung, Hee-Sook Jun
Kidney International.2017; 91(6): 1362. CrossRef - Expression of senescence-associated genes in multipotent mesenchymal stromal cells during long-term cultivation at various hypoxic levels
M. V. Lobanova, A. Y. Ratushnyy, L. B. Buravkova
Doklady Biochemistry and Biophysics.2016; 470(1): 326. CrossRef - The PI3K pathway in B cell metabolism
Julia Jellusova, Robert C. Rickert
Critical Reviews in Biochemistry and Molecular Biology.2016; 51(5): 359. CrossRef - Deferoxamine attenuates lipopolysaccharide-induced neuroinflammation and memory impairment in mice
Xiao-Ying Zhang, Jiang-Bei Cao, Li-Ming Zhang, Yun-Feng Li, Wei-Dong Mi
Journal of Neuroinflammation.2015;[Epub] CrossRef - Anti-diabetic efficacy of KICG1338, a novel glycogen synthase kinase-3β inhibitor, and its molecular characterization in animal models of type 2 diabetes and insulin resistance
Kyoung Min Kim, Kuy-Sook Lee, Gha Young Lee, Hyunjin Jin, Eunice Sung Durrance, Ho Seon Park, Sung Hee Choi, Kyong Soo Park, Young-Bum Kim, Hak Chul Jang, Soo Lim
Molecular and Cellular Endocrinology.2015; 409: 1. CrossRef - Brief Review of Articles in 'Endocrinology and Metabolism' in 2013
Won-Young Lee
Endocrinology and Metabolism.2014; 29(3): 251. CrossRef - Immunosenescence in monocytes, macrophages, and dendritic cells: Lessons learned from the lung and heart
Phyllis-Jean Linton, Marilyn L. Thoman
Immunology Letters.2014; 162(1): 290. CrossRef
 PubReader
 Cite
Cite