Articles
- Page Path
- HOME > Endocrinol Metab > Volume 30(3); 2015 > Article
-
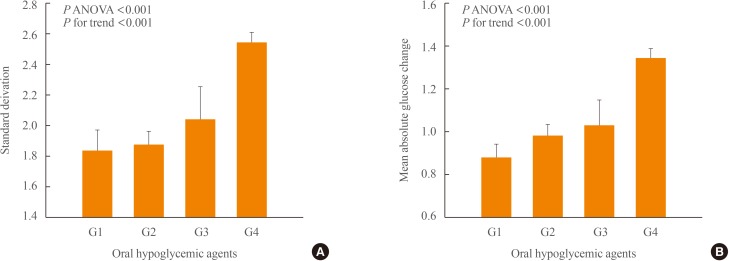
Original ArticleClinical Study Factors Associated with Glycemic Variability in Patients with Type 2 Diabetes: Focus on Oral Hypoglycemic Agents and Cardiovascular Risk Factors
- Soyeon Yoo1, Sang-Ouk Chin1, Sang-Ah Lee1,2, Gwanpyo Koh1,2
-
Endocrinology and Metabolism 2015;30(3):352-360.
DOI: https://doi.org/10.3803/EnM.2015.30.3.352
Published online: August 4, 2015
1Department of Internal Medicine, Jeju National University Hospital, Jeju, Korea.
2Department of Internal Medicine, Jeju National University School of Medicine, Jeju, Korea.
- Corresponding author: Gwanpyo Koh. Department of Internal Medicine, Jeju National University School of Medicine, 15 Aran 13-gil, Jeju 63241, Korea. Tel: +82-64-754-8163, Fax: +82-64-717-1131, okdom@jejunu.ac.kr
• Received: March 3, 2015 • Revised: April 27, 2015 • Accepted: June 11, 2015
Copyright © 2015 Korean Endocrine Society
This is an Open Access article distributed under the terms of the Creative Commons Attribution Non-Commercial License (http://creativecommons.org/licenses/by-nc/3.0/) which permits unrestricted non-commercial use, distribution, and reproduction in any medium, provided the original work is properly cited.
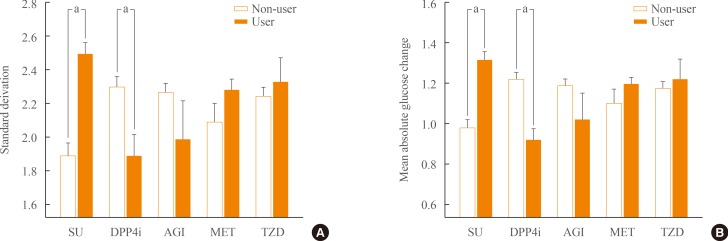

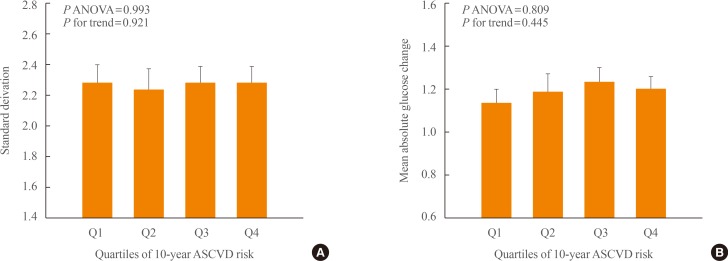
Figure & Data
References
Citations
Citations to this article as recorded by 
- Prognostic value of longitudinal HbA1c variability in predicting the development of diabetic sensorimotor polyneuropathy among patients with type 2 diabetes mellitus: A prospective cohort observational study
Yun‐Ru Lai, Wen‐Chan Chiu, Chih‐Cheng Huang, Ben‐Chung Cheng, I‐Hsun Yu, Chia‐Te Kung, Ting Yin Lin, Hui Ching Chiang, Chun‐En Aurea Kuo, Cheng‐Hsien Lu
Journal of Diabetes Investigation.2024; 15(3): 326. CrossRef - Influence of dipeptidyl peptidase-4 inhibitors on glycemic variability in patients with type 2 diabetes: A meta-analysis of randomized controlled trials
Shangyu Chai, Ruya Zhang, Ye Zhang, Richard David Carr, Yiman Zheng, Swapnil Rajpathak, Miao Yu
Frontiers in Endocrinology.2022;[Epub] CrossRef - Glycemic Variability in Subjects with Diabetes and Hypogonadism during Testosterone Replacement Treatment: A Pilot Study
Giuseppe Defeudis, Ernesto Maddaloni, Giovanni Rossini, Alfonso Maria Di Tommaso, Rossella Mazzilli, Paolo Di Palma, Paolo Pozzilli, Nicola Napoli
Journal of Clinical Medicine.2022; 11(18): 5333. CrossRef - New Insights into the Role of Visit-to-Visit Glycemic Variability and Blood Pressure Variability in Cardiovascular Disease Risk
Jin J. Zhou, Daniel S. Nuyujukian, Peter D. Reaven
Current Cardiology Reports.2021;[Epub] CrossRef - Prevalence of glycemic variability and factors associated with the glycemic arrays among end-stage kidney disease patients on chronic hemodialysis
Abdul Hanif Khan Yusof Khan, Nor Fadhlina Zakaria, Muhammad Adil Zainal Abidin, Nor Azmi Kamaruddin
Medicine.2021; 100(30): e26729. CrossRef - Dipeptidyl-Peptidase-IV Inhibitors, Imigliptin and Alogliptin, Improve Beta-Cell Function in Type 2 Diabetes
Xu Liu, Yang Liu, Hongzhong Liu, Haiyan Li, Jianhong Yang, Pei Hu, Xinhua Xiao, Dongyang Liu
Frontiers in Endocrinology.2021;[Epub] CrossRef - HbA 1C variability and hypoglycemia hospitalization in adults with type 1 and type 2 diabetes: A nested case-control study
Victor W. Zhong, Juhaeri Juhaeri, Stephen R. Cole, Christina M. Shay, Penny Gordon-Larsen, Evangelos Kontopantelis, Elizabeth J. Mayer-Davis
Journal of Diabetes and its Complications.2018; 32(2): 203. CrossRef - Glucose fluctuation and the resultant endothelial injury are correlated with pancreatic β cell dysfunction in patients with coronary artery disease
Makoto Murata, Hitoshi Adachi, Shigeru Oshima, Masahiko Kurabayashi
Diabetes Research and Clinical Practice.2017; 131: 107. CrossRef - Efficacy of lifestyle interventions in patients with type 2 diabetes: A systematic review and meta-analysis
Xiao-Li Huang, Jian-Hua Pan, Dan Chen, Jing Chen, Fang Chen, Tao-Tao Hu
European Journal of Internal Medicine.2016; 27: 37. CrossRef
 PubReader
 Cite
Cite