Articles
- Page Path
- HOME > Endocrinol Metab > Volume 31(4); 2016 > Article
-
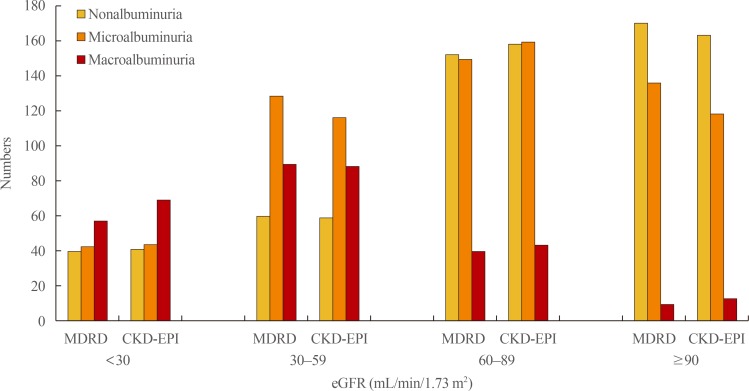
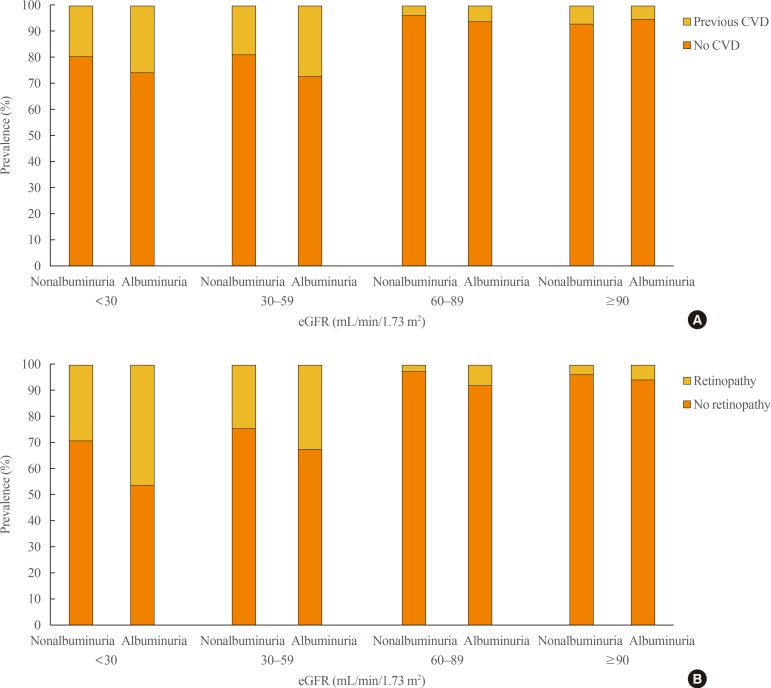
Original ArticleClinical Study Prevalent Rate of Nonalbuminuric Renal Insufficiency and Its Association with Cardiovascular Disease Event in Korean Type 2 Diabetes
-
Hye Won Lee*
 , A Ra Jo*, Dong Won Yi, Yang Ho Kang, Seok Man Son
 -
Endocrinology and Metabolism 2016;31(4):577-585.
DOI: https://doi.org/10.3803/EnM.2016.31.4.577
Published online: December 20, 2016
Department of Internal Medicine, Pusan National University School of Medicine and Diabetes Center, Pusan National University Yangsan Hospital, Yangsan, Korea.
- Corresponding author: Seok Man Son. Department of Internal Medicine, Pusan National University Yangsan Hospital, Pusan National University School of Medicine, 20 Geumo-ro, Mulgeum-eup, Yangsan 50612, Korea. Tel: +82-55-360-2354, Fax: +82-55-360-1565, sonsm@pusan.ac.kr
- *These authors contributed equally to this work.
• Received: July 26, 2016 • Revised: September 26, 2016 • Accepted: October 10, 2016
Copyright © 2016 Korean Endocrine Society
This is an Open Access article distributed under the terms of the Creative Commons Attribution Non-Commercial License (http://creativecommons.org/licenses/by-nc/4.0/) which permits unrestricted non-commercial use, distribution, and reproduction in any medium, provided the original work is properly cited.


Figure & Data
References
Citations
Citations to this article as recorded by 
- Update on pathogenesis and diagnosis flow of normoalbuminuric diabetes with renal insufficiency
Le Deng, Wenjie Li, Gaosi Xu
European Journal of Medical Research.2021;[Epub] CrossRef - Diabetic kidney disease: new clinical and therapeutic issues. Joint position statement of the Italian Diabetes Society and the Italian Society of Nephrology on “The natural history of diabetic kidney disease and treatment of hyperglycemia in patients with
Giuseppe Pugliese, Giuseppe Penno, Andrea Natali, Federica Barutta, Salvatore Di Paolo, Gianpaolo Reboldi, Loreto Gesualdo, Luca De Nicola
Journal of Nephrology.2020; 33(1): 9. CrossRef - Diabetic kidney disease: New clinical and therapeutic issues. Joint position statement of the Italian Diabetes Society and the Italian Society of Nephrology on “The natural history of diabetic kidney disease and treatment of hyperglycemia in patients with
Giuseppe Pugliese, Giuseppe Penno, Andrea Natali, Federica Barutta, Salvatore Di Paolo, Gianpaolo Reboldi, Loreto Gesualdo, Luca De Nicola
Nutrition, Metabolism and Cardiovascular Diseases.2019; 29(11): 1127. CrossRef - Soluble Dipeptidyl Peptidase-4 Levels Are Associated with Decreased Renal Function in Patients with Type 2 Diabetes Mellitus
Eun-Hee Cho, Sang-Wook Kim
Diabetes & Metabolism Journal.2019; 43(1): 97. CrossRef - STORIA NATURALE DELLA MALATTIA RENALE NEL DIABETE E TRATTAMENTO DELL’IPERGLICEMIA NEI PAZIENTI CON DIABETE DI TIPO 2 E RIDOTTA FUNZIONE RENALE
il Diabete.2019;[Epub] CrossRef - Articles inEndocrinology and Metabolismin 2016
Won-Young Lee
Endocrinology and Metabolism.2017; 32(1): 62. CrossRef - Nonalbuminuric Renal Insufficiency: Can It Be a Novel Category of Diabetic Nephropathy?
Masami Tanaka, Hiroshi Itoh
Endocrinology and Metabolism.2016; 31(4): 533. CrossRef
 PubReader
 Cite
Cite