Articles
- Page Path
- HOME > Endocrinol Metab > Volume 35(1); 2020 > Article
-
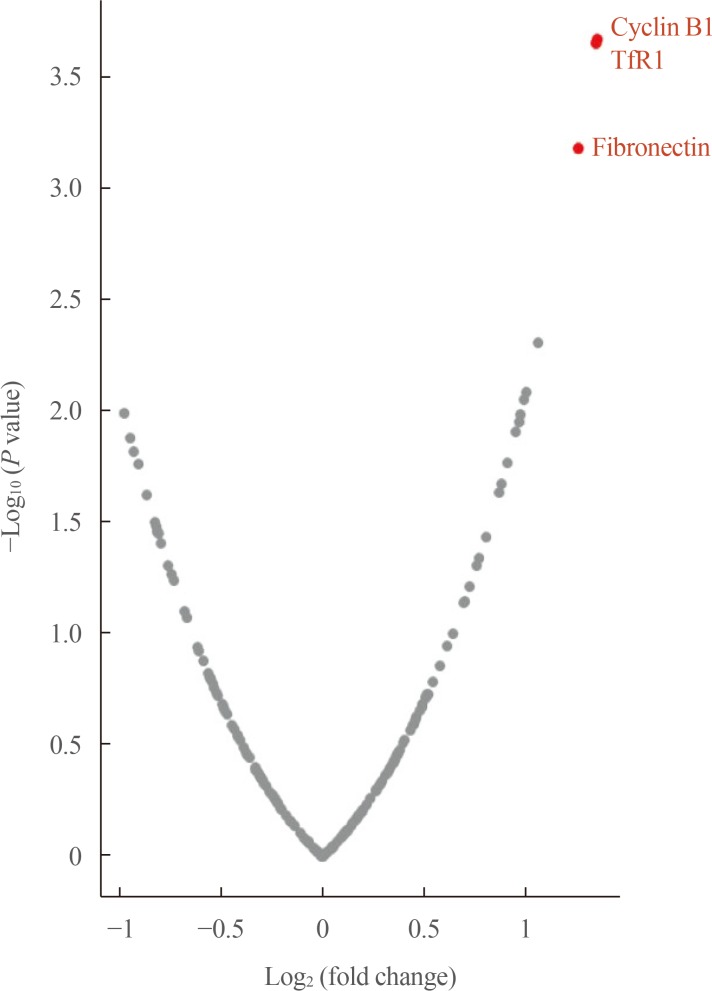
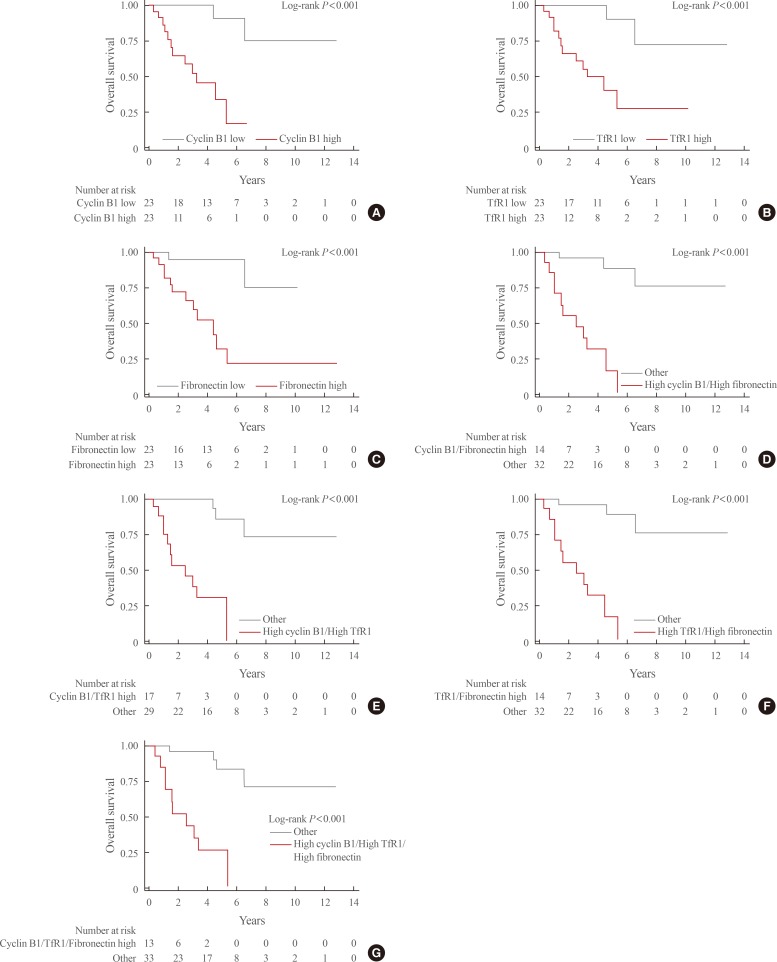
Original ArticleClinical Study Protein Expression of Cyclin B1, Transferrin Receptor, and Fibronectin Is Correlated with the Prognosis of Adrenal Cortical Carcinoma
-
Sun Joon Moon1
 , Jung Hee Kim1,2, Sung Hye Kong1, Chan Soo Shin1
 -
Endocrinology and Metabolism 2020;35(1):132-141.
DOI: https://doi.org/10.3803/EnM.2020.35.1.132
Published online: March 19, 2020
1Department of Internal Medicine, Seoul National University Hospital, Seoul National University College of Medicine, Seoul, Korea.
2Department of Molecular Medicine and Biopharmaceutical Sciences, Graduate School of Convergence Science and Technology, Seoul National University College of Medicine, Seoul, Korea.
- Corresponding author: Jung Hee Kim. Department of Internal Medicine, Seoul National University Hospital, Seoul National University College of Medicine, 101 Daehak-ro, Jongno-gu, Seoul 03080, Korea. Tel: +82-2-2072-4839, Fax: +82-2-764-2199, jungheeendo@gmail.com
• Received: October 7, 2019 • Revised: November 25, 2019 • Accepted: January 13, 2020
Copyright © 2020 Korean Endocrine Society
This is an Open Access article distributed under the terms of the Creative Commons Attribution Non-Commercial License (http://creativecommons.org/licenses/by-nc/4.0/) which permits unrestricted non-commercial use, distribution, and reproduction in any medium, provided the original work is properly cited.


Figure & Data
References
Citations
Citations to this article as recorded by 
- Synthesis and Evaluation of [64Cu]Cu-NOTA-HFn for PET Imaging of Transferrin Receptor 1 Expression in Nasopharyngeal Carcinoma
Yanfang Shen, Renwei Zhou, Lei Bi, Guolong Huang, Min Yang, Zhijun Li, Jijin Yao, Jianzhong Xian, Yifan Qiu, Peizhen Ye, Yongshan Liu, Yuyi Hou, Hongjun Jin, Ying Wang
ACS Omega.2024;[Epub] CrossRef - USP39-mediated deubiquitination of Cyclin B1 promotes tumor cell proliferation and glioma progression
Yue Xiao, Xinyi Chen, Weiwei Hu, Wenjing Ma, Qianqian Di, Haimei Tang, Xibao Zhao, Guodong Huang, Weilin Chen
Translational Oncology.2023; 34: 101713. CrossRef - Identification of key genes and pathways in adrenocortical carcinoma: evidence from bioinformatic analysis
Mengsha Yin, Yao Wang, Xinhua Ren, Mingyue Han, Shanshan Li, Ruishuang Liang, Guixia Wang, Xiaokun Gang
Frontiers in Endocrinology.2023;[Epub] CrossRef - Identification of Key Genes and Related Drugs of Adrenocortical
Carcinoma by Integrated Bioinformatics Analysis
Jian-bin Wei, Xiao-chun Zeng, Kui-rong Ji, Ling-yi Zhang, Xiao-min Chen
Hormone and Metabolic Research.2023;[Epub] CrossRef - Ferritin nanocage based delivery vehicles: From single-, co- to compartmentalized- encapsulation of bioactive or nutraceutical compounds
Hai Chen, Xiaoyi Tan, Xueer Han, Liang Ma, Hongjie Dai, Yu Fu, Yuhao Zhang
Biotechnology Advances.2022; 61: 108037. CrossRef - Effect of Inactivation of Mst1 and Mst2 in the Mouse Adrenal Cortex
Nour Abou Nader, Étienne Blais, Guillaume St-Jean, Derek Boerboom, Gustavo Zamberlam, Alexandre Boyer
Journal of the Endocrine Society.2022;[Epub] CrossRef - Cyclin B1 expression as an independent prognostic factor for lung adenocarcinoma and its potential pathways
Yi Li, Yuanxiu Leng, Yudi Dong, Yongxiang Song, Qiaoyuan Wu, Ni Jiang, Hui Dong, Fang Chen, Qing Luo, Chen Cheng
Oncology Letters.2022;[Epub] CrossRef - Antibodies Targeting the Transferrin Receptor 1 (TfR1) as Direct Anti-cancer Agents
Pierre V. Candelaria, Lai Sum Leoh, Manuel L. Penichet, Tracy R. Daniels-Wells
Frontiers in Immunology.2021;[Epub] CrossRef - Mass Spectrometry-Based Proteomic Discovery of Prognostic Biomarkers in Adrenal Cortical Carcinoma
Han Na Jang, Sun Joon Moon, Kyeong Cheon Jung, Sang Wan Kim, Hyeyoon Kim, Dohyun Han, Jung Hee Kim
Cancers.2021; 13(15): 3890. CrossRef - Progress in Delivery of siRNA-Based Therapeutics Employing Nano-Vehicles for Treatment of Prostate Cancer
Milad Ashrafizadeh, Kiavash Hushmandi, Ebrahim Rahmani Moghadam, Vahideh Zarrin, Sharareh Hosseinzadeh Kashani, Saied Bokaie, Masoud Najafi, Shima Tavakol, Reza Mohammadinejad, Noushin Nabavi, Chia-Ling Hsieh, Atefeh Zarepour, Ehsan Nazarzadeh Zare, Ali Z
Bioengineering.2020; 7(3): 91. CrossRef
 PubReader
 ePub Link
 Cite
Cite