Warning: fopen(/home/virtual/enm-kes/journal/upload/ip_log/ip_log_2024-05.txt): failed to open stream: Permission denied in /home/virtual/lib/view_data.php on line 88
Warning: fwrite() expects parameter 1 to be resource, boolean given in /home/virtual/lib/view_data.php on line 89
Sleep Duration and the Risk of Type 2 Diabetes: A Community-Based Cohort Study with a 16-Year Follow-up
Diabetes, obesity and metabolism Sleep Duration and the Risk of Type 2 Diabetes: A Community-Based Cohort Study with a 16-Year Follow-up
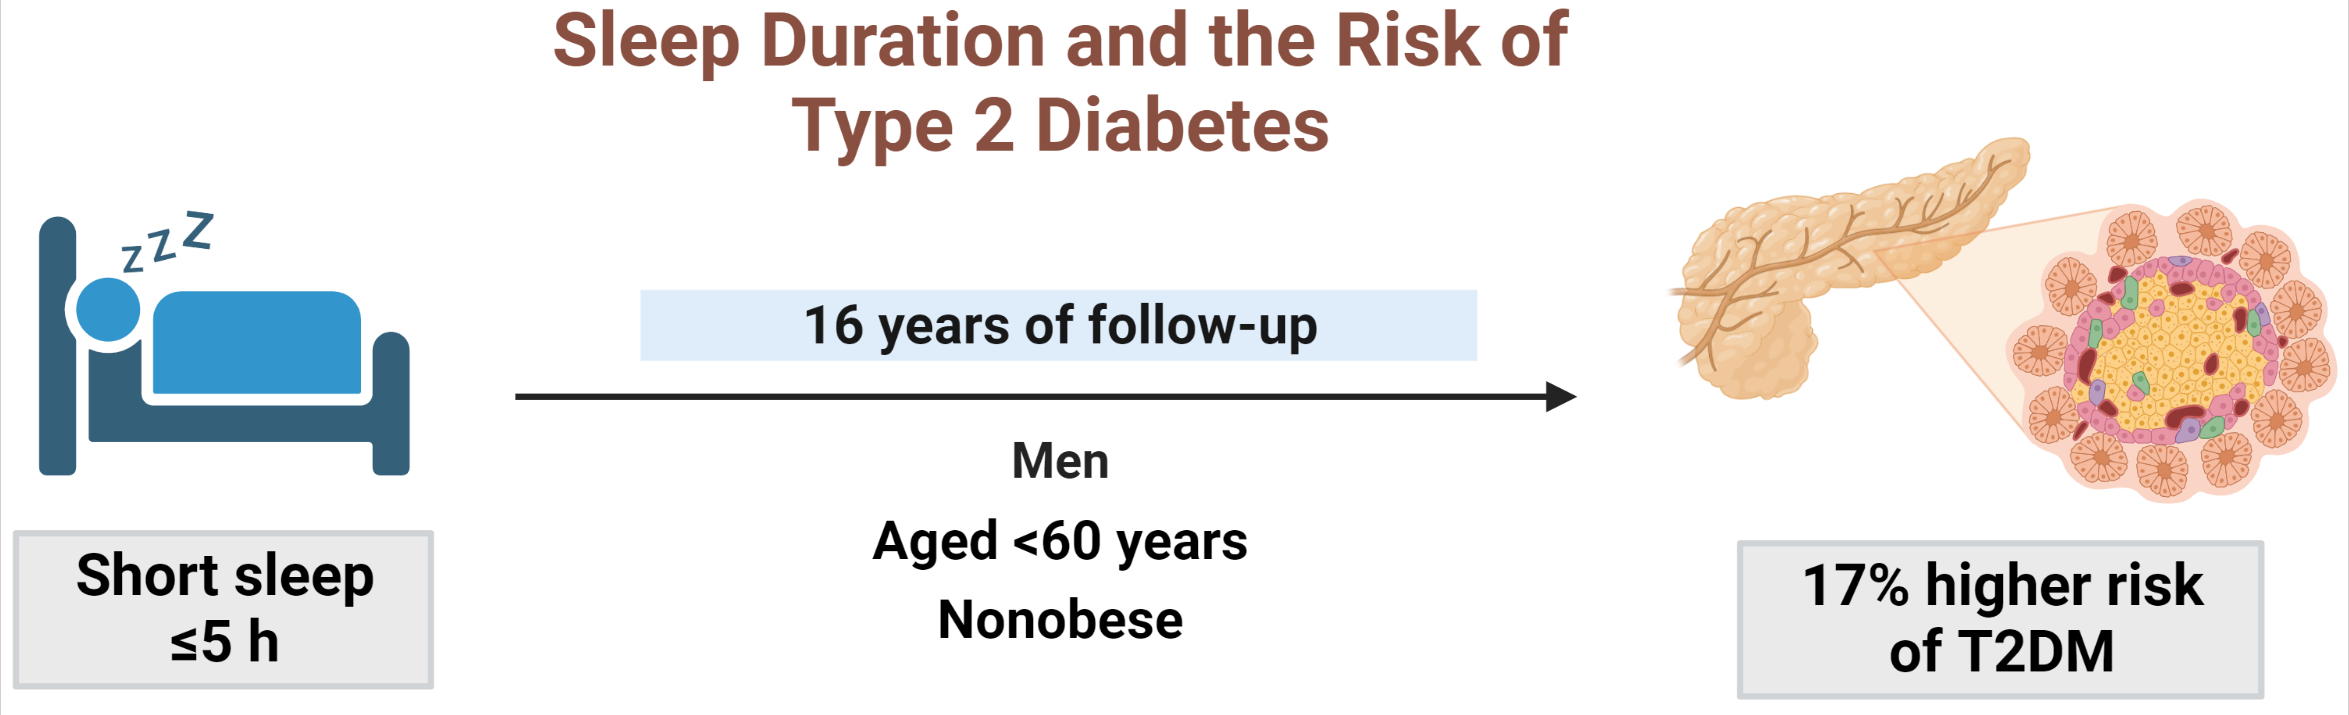
Keypoint This study discusses the link between sleep habits and the risk of type 2 diabetes mellitus (T2DM). It highlights the global prevalence of diabetes and sleep insufficiency, and introduces an ongoing study aiming to explore the effects of sleep duration on T2DM risk and identify any moderators over a 16-year follow-up period. The study found that a sleep duration of ≤5 hours was significantly associated with a higher risk of developing diabetes in non-obese or young individuals and men.
1Division of Endocrinology and Metabolism, Department of Internal Medicine, Korea University College of Medicine, Seoul, Korea
2Institute of Human Genomic Study, Korea University Ansan Hospital, Ansan, Korea
3BK21 FOUR R&E Center for Learning Health Systems, Korea University, Seoul, Korea
Corresponding authors: Nan Hee Kim. Division of Endocrinology and Metabolism, Department of Internal Medicine, Korea University Ansan Hospital, Korea University College of Medicine, 123 Jeokgeum-ro, Danwon-gu, Ansan 15355, Korea Tel: +82-31-412-4274, Fax: +82-31-412-6770, E-mail: nhkendo@gmail.com
Chol Shin. Division of Respiratory and Critical Care Medicine, Department of Internal Medicine, Korea University Ansan Hospital, Korea University College of Medicine, 123 Jeokgeum-ro, Danwon-gu, Ansan 15355, Korea Tel: +82-31-412-5603, Fax: +82-31-412-5604, E-mail: chol-shin@hanmail.net
• Received: September 6, 2022 • Revised: December 23, 2022 • Accepted: January 18, 2023
This is an Open Access article distributed under the terms of the Creative Commons Attribution Non-Commercial License (http://creativecommons.org/licenses/by-nc/4.0/) which permits unrestricted non-commercial use, distribution, and reproduction in any medium, provided the original work is properly cited.
We aimed to investigate the moderating effects of obesity, age, and sex on the association between sleep duration and the development of diabetes in Asians.
Methods
We analyzed data from a cohort of the Korean Genome and Epidemiology Study conducted from 2001 to 2020. After excluding shift workers and those with diabetes at baseline, 7,407 participants were stratified into three groups according to sleep duration: ≤5 hours/night, >5 to 7 hours/night (reference), and >7 hours/night. The Cox proportional hazards analyses were used to calculate the hazard ratios (HRs) and 95% confidence intervals (CIs) for incident type 2 diabetes mellitus (T2DM). Subgroup analyses were performed according to obesity, age, and sex.
Results
During 16 years of follow-up, 2,024 cases of T2DM were identified. Individuals who slept ≤5 h/night had a higher risk of incident diabetes than the reference group (HR, 1.17; 95% CI, 1.02 to 1.33). The subgroup analysis observed a valid interaction with sleep duration only for obesity. A higher risk of T2DM was observed in the ≤5 hours/night group in non-obese individuals, men, and those aged <60 years, and in the >7 hours/night group in obese individuals (HRs were 1.34 [95% CI, 1.11 to 1.61], 1.22 [95% CI, 1 to 1.49], and 1.18 [95% CI, 1.01 to 1.39], respectively).
Conclusion
This study confirmed the effect of sleep deprivation on the risk of T2DM throughout the 16-year follow-up period. This impact was confined to non-obese or young individuals and men. We observed a significant interaction between sleep duration and obesity.
The number of adults with diabetes worldwide is expected to reach 783 million by 2045 [1]. Besides an unhealthy diet, smoking, and exercise [2], sleep habits have been noticed due to their metabolic influence on various diseases [3]. Because of modern lifestyles, voluntary sleep restriction due to societal demands has become common [4]. The average duration of sleep dropped from to 8- to 9-hour per night in 1960 to 7-hour per night in 1995 [5]. Consequently, sleep insufficiency is regarded as a global health problem [6].
Prior publications suggested that the quantity of sleep was related to the future risk of type 2 diabetes mellitus (T2DM), but they were inconclusive. Although several meta-analyses have reported a U-shaped association between sleep duration and T2DM risk [7,8], other studies have indicated limited significance whether in short or long sleep [9-12]. This discrepancy could be related to the varied definitions of diabetes and the classification of sleep duration. Additionally, differences in the effect of sleep insufficiency on T2DM risk according to ethnicity have been recognized [7,13]. Most Asian studies investigating sleep insufficiency and T2DM risk have several weak points, including a small number of study subjects, a short follow-up period, and a lack of biochemical laboratory information, resulting in inconsistent findings [14-19].
To explain the relationship between sleep insufficiency and incident diabetes, many investigators have attempted to consider the role of body mass index (BMI) and obesity [11,19,20]. Sleep insufficiency is an important contributor not only to diabetes [21,22] but also to obesity [23-26]. Additionally, obese status itself is associated with an increased risk of T2DM [27]. However, the impact of BMI or obesity on sleep characteristics is variable [11,19,20]. Moreover, as is well known, the deleterious effect of obesity in Asians was found in lower BMI values than in other ethnicities [28], a reliable study for Asians is needed. In addition, previous studies had a weakness in the lack of consideration of co-existing sleep-related disorders, such as sleep apnea [9], and more research is needed to specify the group that needs to adjust sleep time intensively.
Regarding other characteristics, although few studies have explored the effect of adjusting for age or sex [10,12,17,19,29], no one has yet concluded as to the specific population susceptible to sleep insufficiency. We have already demonstrated that the presence of obstructive sleep apnea is associated with impaired glucose metabolism only in non-obese individuals [30]. This study aimed to explore the effect of sleep duration on future T2DM risk, with the precise identification of diabetes and other sleep-related disorders. In addition, we tested whether obesity status, age group, and sex can be moderators of this relationship in an ongoing cohort study of Asians with an accumulation of follow-up of more than 20 years.
METHODS
Study design
We analyzed data from the Ansan and Ansung cohort of the Korean Genome and Epidemiology Study (KoGES), an ongoing prospective cohort study started in 2001 (“Exam 1”), whose design, aims, and detailed descriptions have been previously reported [30-32]. The participants, aged 40 to 69 years, were followed up with biennial examinations addressing demographic characteristics, medical history, lifestyle habits, and sleep-related factors.
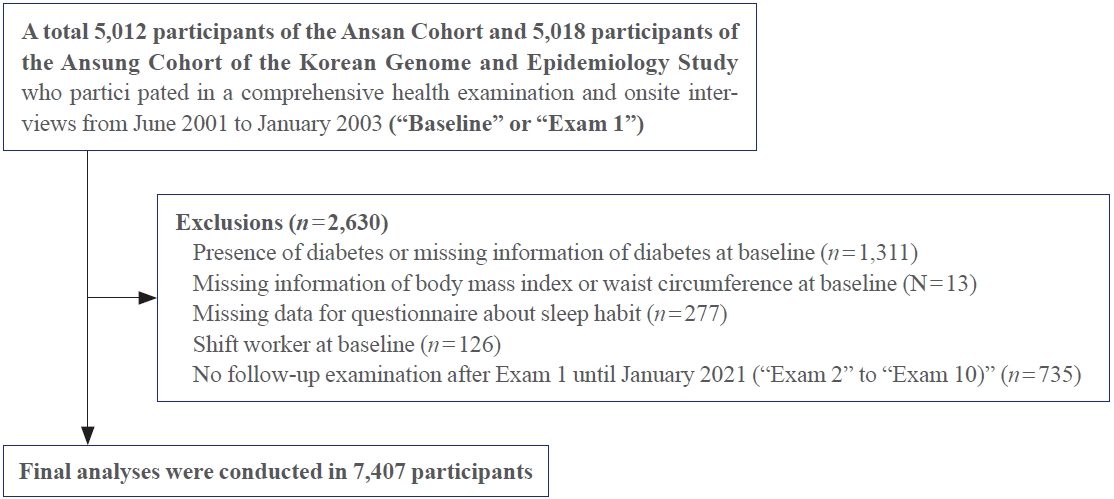
Among the 5,012 participants of the Ansan Cohort and the 5,018 participants of the Ansung Cohort who attended the KoGES from June 2001 to January 2003 (“Exam 1,” hereafter referred to as “Baseline”), 2,630 participants were excluded as follows: the presence of diabetes or missing information about diabetes at baseline (n=1,311); missing information for BMI or waist circumference (WC) at baseline (n=13); missing data for a questionnaire about sleep habits (n=277); shift worker at baseline (n=126); no follow-up examination after baseline (n=735). Finally, 7,407 participants were included in this study (Fig. 1).
Before participation, the participants provided written informed consent for the use of their data. The study was reviewed and approved by the Institutional Review Board of the Korea University Ansan Hospital (2006AS0045) and conducted in accordance with the tenets of the Helsinki Declaration of 1975.
Assessment of sleep habit
Information on habitual sleep duration, the presence of snoring, and sleep apnea was collected from the questionnaires with respect to usual weekdays and nights [33]. The question about sleep duration was as follows: “How many hours did you usually sleep during the last month?”
Habitual snoring was defined as snoring ≥4 days/week. A previous study demonstrated substantial reliability for the question of snoring [34]. The presence of sleep apnea was identified from the answer to the questionnaire “Has anyone who sleeps with you ever said that you stopped breathing while snoring?” indicating a witness to sleep apnea.
Study outcome
The study endpoint was incident T2DM until January 2020 (“Exam 10”), defined by levels of fasting plasma glucose ≥126 mg/dL, 2-hour plasma glucose ≥200 mg/dL during the 75 g oral glucose tolerance test (OGTT), glycated hemoglobin (HbA1c) levels of ≥6.5%, or a medical history of antidiabetic agents provided for those considered to have T2DM [35]. The follow-up period was defined as the period from the baseline to the first diagnosis of diabetes or the date of the last examination.
Measurements of covariates
Covariate measures were derived from a comprehensive health examination and questionnaire-based interviews at each visit. Smoking status and alcohol consumption were classified as never, former, or current, respectively. Regular exercise was defined as exercise for >30 minutes at least three times a week during the previous month.
The BMI of the participants was calculated as their weight in kilograms divided by the square of their height in meters. WC was measured at the narrowest part between the lower rib and iliac crest in the standing position, and the average of three repeated measurements was calculated. Blood pressure (BP) was measured by trained nurses with the patient in a sitting position using standardized sphygmomanometers after 5 minutes of rest. The average of repeated measurements with a 30-second interval was used.
Venous blood sampling was conducted in the morning (8:00 AM to 9:00 AM) after an overnight fast of at least 8 hours. Plasma glucose, serum total cholesterol, triglycerides high-density lipoprotein cholesterol, and low-density lipoprotein cholesterol levels were measured using an autoanalyzer (ADVIA 1650, Siemens, Tarrytown, NY, USA). Insulin levels were measured using an immunoradiometric assay kit (INS-IRMA Kit, BioSource, Nivelles, Belgium), with a Packard γ counter system. Insulin resistance was estimated using the homeostasis model assessment of insulin resistance (HOMA-IR) and calculated using the following formula: HOMA-IR=fasting insulin (IU/mL)×fasting glucose (mmol/L)/22.5 [36].
Cardiovascular disease (CVD) was defined as a self-reported history of myocardial infarction, congestive heart failure, coronary artery disease, or peripheral vascular disease. Prescribed medications for diabetes, hypertension, dyslipidemia, and CVD were reported.
Statistical analysis
Data are presented as the mean±standard deviation, number (%), or median (interquartile range). The baseline characteristics of the participants were compared according to the presence of T2DM and sleep duration using the analysis of variance for continuous variables and the chi-square test for categorical variables. The skewed variables were log-transformed for analysis. Based on sleep duration, study participants were stratified into three groups as follows: (1) ≤5 hours night (n=881), (2) >5 to 7 hours/night (n=4,060), and (3) >7 hour/night (n=2,466).
To evaluate the risk of diabetes according to the three groups of sleep duration, we performed a Cox proportional hazards analysis with a >5 to 7 hour/night group as the reference group. The risk is shown as a hazard ratio (HR) and Bonferroni-adjusted 95% confidence interval (CI). We adjusted for various cardiometabolic factors: age, sex, BMI, study site (Ansan or Ansung), alcohol consumption, smoking, regular exercise, presence of hypertension or CVD, use of antihyperlipidemic drugs, fasting glucose levels, HOMA-IR, habitual snoring, and sleep apnea.
To explore the factors modifying the association between sleep duration and the risk of diabetes, we performed a subgroup analysis after stratifying the participants according to sex, age <60 and ≥60 years, and obesity, defined as a BMI of ≥25 kg/m2 [37].
In addition, we conducted a sensitivity analysis in participants in the same sleep duration group at the baseline and final visit before the study outcome to explore the effect of persistent sleep duration. As the questionnaire regarding sleep habits was included only in Exam 1 in the Ansung cohort, we conducted this sensitivity analysis in the Ansan cohort, excluding participants with incident diabetes in Exam 2 performed from January 2003 to February 2005. Data from a total of 1,772 participants were extracted. We repeated the above-mentioned Cox proportional hazards analyses to calculate the HR and 95% CI of incident diabetes, using the group that slept persistently >5 to 7 hours/night as a reference category.
Statistical analyses were performed using SAS version 9.1 for Windows (SAS Institute Inc., Cary, NC, USA). P values were corrected using Tukey’s method because of multiple testing, and a P<0.05 was considered to be statistically significant.
RESULTS
Table 1 shows the baseline characteristics of the participants according to sleep duration. Individuals in the >5 to 7 hours/night group were younger and had a higher proportion of men and drinkers than those in the ≤5-hour/night group, whereas the >7-hour/night group consisted of those who were older, had higher BP and triglyceride levels and had a higher proportion of smokers and those who were taking antihypertensive drugs.
During the 16 years (interquartile range, 7.8 to 17.8) of median follow-up periods, 2,024 patients with T2DM were identified. In the results of the multivariate adjusted Cox analysis (Table 2), individuals who slept ≤5 hours/night had a higher risk of incident diabetes than those who slept >5 to 7 hours/night. However, there was no impact of >7 hours/night of sleep on the risk of T2DM.
In the subgroup analysis, no valid interaction was observed at 60 years of age or by sex (Table 2). A marked increased risk of T2DM in ≤5 hours/night of sleep was found in men and individuals aged less than 60 years. However, in the case of obesity status, there was a significant interaction between sleep duration and obesity status (P=0.02, with adjustment by age, sex, and study site). In the fully adjusted model 2, the ≤5 hours/night group showed a higher risk of T2DM than the >5 to 7 hours/night group in non-obese individuals, whereas the >7 hours/night group only showed a higher risk in obese individuals.
We also analyzed whether this relationship was still significant in those with persistent short sleep duration (Table 3), and those who slept ≤5 hours/night consistently exhibited a higher risk of T2DM than those in the >5 to 7 hours/night group. There was a 64% increased risk of diabetes in those not obese and with persistent short sleep duration; however, the interaction according to obesity status was not significant.
DISCUSSION
The present study confirmed the effect of sleep deprivation on the risk of T2DM throughout a 16-year follow-up period, and the analysis of persistent sleep habits reinforced these findings. This impact was confined to men, individuals aged <60 years, and non-obese individuals. We also suggested a significant interaction between sleep duration and obesity.
Regarding sleep duration and T2DM risk, previous publications on Asians have reported inconsistent findings [14,16-20,29]. A study from Japan indicated the predictive value of short sleep (<5.5 hours/day), but this finding was limited to individuals aged less than 60 years [17]. More recently, a nested case-control study in a rural Chinese population indicated that both shorter (≤6 hours/day) and longer (8 to 9 hours/day) sleep durations increased the risk of T2DM [19]. However, after adjusting for lifestyle habits and BMI, this effect was maintained only in women who slept ≤6 hours/day.
Several limitations of the previous study design have been reported [14-17]. First, the identification of diabetes was mainly based on the self-report of a physician’s diagnosis of diabetes or fasting blood glucose levels [16,18,19]. In this study, however, we identified incident T2DM using 75 g OGTT, HbA1c level, and a history of antidiabetic agent prescription, thereby enhancing the accuracy of the diagnosis. Second, the follow-up period was less than 10 years [14-19] which is not sufficient to demonstrate the long-term effect of sleep insufficiency. Considering that it was previously known that the risk of future diabetes related to poor sleep tends to decrease with the duration of followup [12,22], the results of our study, which has the longest follow-up period among Asian studies, are meaningful. Third, covariates were confined to the questionnaires or lifestyle habits [14-19]. Although a large longitudinal epidemiological study in Korea revealed that short sleep duration could affect the risk of diabetes by adapting various covariates, the median follow-up period was 22 months [20]. In our study, we could adjust for comprehensive factors, including cardiometabolic parameters and the HOMA-IR. Lastly, few studies have evaluated the impact of other sleep characteristics such as afternoon napping or sleep quality [14,18]. However, we could minimize the bias from other sleep habits by adjusting sleep-related variables (e.g., snoring and objective sleep apnea).
Few studies have documented the influence of obesity on the association between sleep and diabetes. In multi-ethnic cohort study, the higher risk for T2DM observed in long sleepers was valid only in participants with BMI ≥25 kg/m2 [10]. More recently, a prospective Mexican American cohort study showed the partially valid effect of short sleep on the 3-year-risk of T2DM in patients with a BMI <30 kg/m2 [12]. The present study widened prior evidence with a long follow-up period in the Asian populations. We suggest that obesity might modify the significance of sleep insufficiency on the risk of T2DM in the opposite direction.
The causal relationship between short sleep duration and the risk of obesity or T2DM is speculated to involve several possible mechanisms. Insufficient sleep enhances a positive energy balance by increasing energy intake to compensate for the lack of biological processes that normally occur during nighttime sleep, resulting in weight gain [38]. Sleep deprivation can activate the sympathetic nervous system and induce cortisol dysregulation, which is attributed to insulin resistance and visceral adiposity [39]. Short sleep can disturb metabolic processes by upregulating daily levels of ghrelin and insulin resistance and declining daily levels of leptin, which increases appetite and consequently increases the risk of obesity and T2DM [40-42]. In addition, inflammation and oxidative stress, such as tumor necrosis factor-α and interleukin-6, may also play a role [43]. The reasons for the limited significance observed only in non-obese individuals is not well known; however, we can speculate that the mechanisms above have already been activated in obese populations, thereby the impact of short sleep may be more prominent in those not obese since. The results of the analysis of persistent sleep duration confirmed the association between sleep deprivation and increased risk of T2DM.
Among obese individuals, the >7 hours/night group showed a high risk of T2DM. This can be explained by the fact that long periods of sleep may be derived from poor sleep quality, sleep fragmentation, and frequent awakenings [29]. Additionally, long sleep duration can indicate poor metabolic characteristics, such as depression, poor economic status, low physical activity, and obesity [44,45].
In a subgroup analysis, we found an impact of a short night’s sleep on the risk of T2DM, particularly in men and individuals aged <60 years, without significance in the interaction analysis. This is in line with prior evidence suggesting that a prominent association between short or long sleep duration and T2DM risk was confined to young individuals [10,17,29]. Similarly, in prior research, short sleep duration was not associated with hypertension or obesity in the elderly [46,47]. Differences in sleep time, architecture, quality, and psychological factors are thought to contribute to attenuation in advanced age [48]. Finally, only men were found to be sensitive to short sleep duration. Regarding variance in sex, inconsistent results have been observed in previous studies [12,19]. Although we cannot explain the exact mechanisms underlying these findings, the current study suggests that maintaining adequate sleep might be particularly important for young or middle-aged men to prevent the development of future diabetes.
However, we acknowledge several limitations. First, the identification of sleep duration and sleep habits was derived from a questionnaire that may overestimate or underestimate short sleep duration [49]. However, objective evaluation of sleep duration in large populations is impossible due to cost, and a moderate correlation (r=0.47) between self-reported sleep duration and objective time measured by actigraphy was noted [49], and a few prior investigations have documented the usefulness of questionnaire-derived sleep habits to various outcomes [33,50]. Second, although we explored the relationship between sleep habits and sleep duration, we did not consider the changes in other biomarkers during the follow-up period. Finally, we did not study the influence of insomnia or exact changes in sleep duration in every examination, although we analyzed the impact of persistent short sleep duration, defined as the baseline and final visit before the study outcome.
In conclusion, this study indicated that sleep duration ≤5 hours was significantly associated with a higher risk of developing diabetes in non-obese or young individuals and men after adjusting for some sleep habits. The impact of sleep duration varies according to obesity status with a valid interaction between sleep duration and obesity.
Article information
CONFLICTS OF INTEREST
No potential conflict of interest relevant to this article was reported.
AUTHOR CONTRIBUTIONS
Conception or design: H.J.Y., S.G.K., K.M.C., N.H.K. Acquisition, analysis, or interpretation of data: D.Y.L., J.H.Y., J.A.S., K.J.K., N.H.K., H.J.Y., S.K.L., N.H.K. Drafting the work or revising: D.Y.L., I.J., S.Y.P. Final approval of the manuscript: S.H.B., C.S., N.H.K.
Acknowledgements
This research was supported by funds from the Korean Centers for Disease Control and Prevention (2001-347-6111-221, 2002- 347-6111-221, 2003-347-6111-221, 2004-E71001-00, 2005- E71001-00, 2006-E71005-00, 2007-E71001-00, 2008-E71001- 00, 2009-E71002-00, 2010-E71001-00, 2011-E71004-00, 2012- E71005-00, 2013-E71005-00, 2014-E71003-00, 2015-P71001- 00, 2016-E71003-00, 2017-E71001-00, and 2018-E7101-00), the Bio & Medical Technology Development Program of the National Research Foundation (NRF) (NRF-2019M3E5- D3073102 and NRF-2019R1H1A2039682) and a National IT Industry Promotion Agency (NIPA) grant (No. S0252-21-1001, Development of AI Precision Medical Solution (Doctor Answer 2.0), the Basic Science Research Program through NRF funded by the Ministry of Education (NRF-2020R1I1A1A01071665) funded by the Korean government (MSIT), and the Korea University Ansan Hospital Grant (K2111021). However, the funders did not participate in the study design or reporting.
Fig. 1.
Flowchart of the selection of participants for this study.
Table 1.
Baseline Characteristics of the Study Participants according to Sleep Duration
Values are expressed as mean±standard deviation, number (%), or median (interquartile range).
WC, waist circumference; BMI, body mass index; BP, blood pressure; HDL-C, high-density lipoprotein cholesterol; LDL-C, low-density lipoprotein cholesterol; HOMA-IR, homeostasis model assessment of insulin resistance; eGFR, estimated glomerular filtration rate.
aP values were derived from analysis of variance for continuous variables and chi-square tests for categorical variables. P values were corrected using post hoc Tukey’s method due to multiple testing. The right-skewed variables were log-transformed for the analysis;
bP<0.05, in comparison between ≤5 and >5 to 7 hours;
cP<0.05, comparison between >5 and 7 vs. >7 hours;
dP<0.05, compared between ≤5 and >7 hours.
Table 2.
Hazard Ratios and 95% Confidence Intervals for Incident Diabetes according to Sleep Duration at Baseline
Values are expressed as number (%). Model 1 was adjusted for age, sex, study site, body mass index, alcohol consumption, smoking, regular exercise, and fasting glucose levels; Model 2 was adjusted for age, sex, study site, body mass index, alcohol consumption, smoking, regular exercise, homeostasis model assessment-estimated insulin resistance, presence of hypertension or cardiovascular disease, use of antihyperlipidemic drugs, presence of habitual snoring, and sleep apnea.
HR, hazard ratio; CI, confidence interval; BMI, body mass index.
a The interaction P values between the sleep duration group and the corresponding characteristic were adjusted by age, sex, and study site.
Table 3.
Hazard Ratios and 95% Confidence Intervals for Incident Diabetes according to Persistent Habitual Sleep Duration
Values are expressed as number (%). Model 1 was adjusted for age, sex, study site, body mass index, alcohol consumption, smoking, regular exercise, and fasting glucose levels; Model 2 was adjusted for age, sex, study site, body mass index, alcohol consumption, smoking, regular exercise, homeostasis model assessment-estimated insulin resistance, presence of hypertension or cardiovascular disease, use of antihyperlipidemic drugs, presence of habitual snoring, and sleep apnea.
HR, hazard ratio; CI, confidence interval; BMI, body mass index.
a The interaction P value between groups of sleep duration and obesity status was adjusted by age, sex, and study site.
References
1. Sun H, Saeedi P, Karuranga S, Pinkepank M, Ogurtsova K, Duncan BB, et al. IDF Diabetes Atlas: global, regional and country-level diabetes prevalence estimates for 2021 and projections for 2045. Diabetes Res Clin Pract 2022;183:109119.ArticlePubMed
2. Hu FB, Manson JE, Stampfer MJ, Colditz G, Liu S, Solomon CG, et al. Diet, lifestyle, and the risk of type 2 diabetes mellitus in women. N Engl J Med 2001;345:790–7.ArticlePubMed
3. Itani O, Jike M, Watanabe N, Kaneita Y. Short sleep duration and health outcomes: a systematic review, meta-analysis, and meta-regression. Sleep Med 2017;32:246–56.ArticlePubMed
4. Gordon S, Vandelanotte C, Rayward AT, Murawski B, Duncan MJ. Sociodemographic and behavioral correlates of insufficient sleep in Australian adults. Sleep Health 2019;5:12–7.ArticlePubMed
5. Van Cauter E, Knutson KL. Sleep and the epidemic of obesity in children and adults. Eur J Endocrinol 2008;159 Suppl 1:S59–66.PubMed
6. Chattu VK, Manzar MD, Kumary S, Burman D, Spence DW, Pandi-Perumal SR. The global problem of insufficient sleep and its serious public health implications. Healthcare (Basel) 2018;7:1.ArticlePubMedPMC
7. Lu H, Yang Q, Tian F, Lyu Y, He H, Xin X, et al. A meta-analysis of a cohort study on the association between sleep duration and type 2 diabetes mellitus. J Diabetes Res 2021;2021:8861038.ArticlePubMedPMCPDF
8. Shan Z, Ma H, Xie M, Yan P, Guo Y, Bao W, et al. Sleep duration and risk of type 2 diabetes: a meta-analysis of prospective studies. Diabetes Care 2015;38:529–37.ArticlePubMedPDF
9. Antza C, Kostopoulos G, Mostafa S, Nirantharakumar K, Tahrani A. The links between sleep duration, obesity and type 2 diabetes mellitus. J Endocrinol 2021;252:125–41.ArticlePubMedPMC
10. Maskarinec G, Jacobs S, Amshoff Y, Setiawan VW, Shvetsov YB, Franke AA, et al. Sleep duration and incidence of type 2 diabetes: the Multiethnic Cohort. Sleep Health 2018;4:27–32.ArticlePubMedPMC
11. Leng Y, Cappuccio FP, Surtees PG, Luben R, Brayne C, Khaw KT. Daytime napping, sleep duration and increased 8-year risk of type 2 diabetes in a British population. Nutr Metab Cardiovasc Dis 2016;26:996–1003.ArticlePubMedPMC
12. Wu IH, Heredia N, Dong Q, McNeill LH, Balachandran DD, Lu Q, et al. Sleep duration and type 2 diabetes risk: a prospective study in a population-based Mexican American cohort. Sleep Health 2021;7:168–76.ArticlePubMedPMC
13. Beihl DA, Liese AD, Haffner SM. Sleep duration as a risk factor for incident type 2 diabetes in a multiethnic cohort. Ann Epidemiol 2009;19:351–7.ArticlePubMed
14. Han X, Liu B, Wang J, Pan A, Li Y, Hu H, et al. Long sleep duration and afternoon napping are associated with higher risk of incident diabetes in middle-aged and older Chinese: the Dongfeng-Tongji cohort study. Ann Med 2016;48:216–23.ArticlePubMed
15. Hayashino Y, Fukuhara S, Suzukamo Y, Okamura T, Tanaka T, Ueshima H, et al. Relation between sleep quality and quantity, quality of life, and risk of developing diabetes in healthy workers in Japan: the High-risk and Population Strategy for Occupational Health Promotion (HIPOP-OHP) Study. BMC Public Health 2007;7:129.ArticlePubMedPMCPDF
16. Kita T, Yoshioka E, Satoh H, Saijo Y, Kawaharada M, Okada E, et al. Short sleep duration and poor sleep quality increase the risk of diabetes in Japanese workers with no family history of diabetes. Diabetes Care 2012;35:313–8.ArticlePubMedPMCPDF
17. Heianza Y, Kato K, Fujihara K, Tanaka S, Kodama S, Hanyu O, et al. Role of sleep duration as a risk factor for Type 2 diabetes among adults of different ages in Japan: the Niigata Wellness Study. Diabet Med 2014;31:1363–7.ArticlePubMed
18. Lou P, Zhang P, Zhang L, Chen P, Chang G, Zhang N, et al. Effects of sleep duration and sleep quality on prevalence of type 2 diabetes mellitus: a 5-year follow-up study in China. Diabetes Res Clin Pract 2015;109:178–84.ArticlePubMed
19. Cui S, Li Y, Chen Y, Ren P, Fan M, Yang X, et al. Association of sleep duration with risk of type 2 diabetes mellitus in a rural Chinese population: a nested case-control study. Sleep Breath 2022;26:2025–33.ArticlePubMedPDF
20. Kim CW, Chang Y, Sung E, Ryu S. Sleep duration and progression to diabetes in people with prediabetes defined by HbA1c concentration. Diabet Med 2017;34:1591–8.ArticlePubMedPDF
21. Perry GS, Patil SP, Presley-Cantrell LR. Raising awareness of sleep as a healthy behavior. Prev Chronic Dis 2013;10:E133.ArticlePubMedPMC
22. Cappuccio FP, D’Elia L, Strazzullo P, Miller MA. Quantity and quality of sleep and incidence of type 2 diabetes: a systematic review and meta-analysis. Diabetes Care 2010;33:414–20.PubMed
23. Nielsen LS, Danielsen KV, Sorensen TI. Short sleep duration as a possible cause of obesity: critical analysis of the epidemiological evidence. Obes Rev 2011;12:78–92.ArticlePubMed
24. Buxton OM, Marcelli E. Short and long sleep are positively associated with obesity, diabetes, hypertension, and cardiovascular disease among adults in the United States. Soc Sci Med 2010;71:1027–36.ArticlePubMed
25. Wu Y, Zhai L, Zhang D. Sleep duration and obesity among adults: a meta-analysis of prospective studies. Sleep Med 2014;15:1456–62.ArticlePubMed
26. Jean-Louis G, Williams NJ, Sarpong D, Pandey A, Youngstedt S, Zizi F, et al. Associations between inadequate sleep and obesity in the US adult population: analysis of the national health interview survey (1977-2009). BMC Public Health 2014;14:290.ArticlePubMedPMCPDF
27. Yang YS, Han BD, Han K, Jung JH, Son JW; Taskforce Team of the Obesity Fact Sheet of the Korean Society for the Study of Obesity. Obesity fact sheet in Korea, 2021: trends in obesity prevalence and obesity-related comorbidity incidence stratified by age from 2009 to 2019. J Obes Metab Syndr 2022;31:169–77.ArticlePubMedPMC
28. Chan JC, Malik V, Jia W, Kadowaki T, Yajnik CS, Yoon KH, et al. Diabetes in Asia: epidemiology, risk factors, and pathophysiology. JAMA 2009;301:2129–40.ArticlePubMed
29. Song Q, Liu X, Zhou W, Wang X, Wu S. Short-term changes in sleep duration and risk of type 2 diabetes: Kailuan prospective study. Medicine (Baltimore) 2016;95:e5363.PubMedPMC
30. Kim NH, Cho NH, Yun CH, Lee SK, Yoon DW, Cho HJ, et al. Association of obstructive sleep apnea and glucose metabolism in subjects with or without obesity. Diabetes Care 2013;36:3909–15.ArticlePubMedPMCPDF
31. Baik I, Shin C. Prospective study of alcohol consumption and metabolic syndrome. Am J Clin Nutr 2008;87:1455–63.ArticlePubMed
32. Kim H, Yun CH, Thomas RJ, Lee SH, Seo HS, Cho ER, et al. Obstructive sleep apnea as a risk factor for cerebral white matter change in a middle-aged and older general population. Sleep 2013;36:709–15B.ArticlePubMedPMC
33. Seo JA, Lee DY, Yu JH, Cho H, Lee SK, Suh S, et al. Habitual late sleep initiation is associated with increased incidence of type 2 diabetes mellitus in Korean adults: the Korean Genome and Epidemiology Study. Sleep 2019;42:zsz090.ArticlePubMedPDF
34. Joo S, Lee S, Choi HA, Kim J, Kim E, Kimm K, et al. Habitual snoring is associated with elevated hemoglobin A1c levels in non-obese middle-aged adults. J Sleep Res 2006;15:437–44.ArticlePubMed
35. American Diabetes Association. 2. Classification and diagnosis of diabetes: standards of medical care in diabetes-2018. Diabetes Care 2018;41(Suppl 1):S13–27.ArticlePubMedPDF
36. Matthews DR, Hosker JP, Rudenski AS, Naylor BA, Treacher DF, Turner RC. Homeostasis model assessment: insulin resistance and beta-cell function from fasting plasma glucose and insulin concentrations in man. Diabetologia 1985;28:412–9.ArticlePubMedPDF
37. Kim BY, Kang SM, Kang JH, Kang SY, Kim KK, Kim KB, et al. 2020 Korean Society for the Study of Obesity guidelines for the management of obesity in Korea. J Obes Metab Syndr 2021;30:81–92.ArticlePubMedPMC
38. Schmidt MH. The energy allocation function of sleep: a unifying theory of sleep, torpor, and continuous wakefulness. Neurosci Biobehav Rev 2014;47:122–53.ArticlePubMed
39. Balbo M, Leproult R, Van Cauter E. Impact of sleep and its disturbances on hypothalamo-pituitary-adrenal axis activity. Int J Endocrinol 2010;2010:759234.ArticlePubMedPMCPDF
40. Van Cauter E, Holmback U, Knutson K, Leproult R, Miller A, Nedeltcheva A, et al. Impact of sleep and sleep loss on neuroendocrine and metabolic function. Horm Res 2007;67 Suppl 1:2–9.PubMed
41. Knutson KL, Spiegel K, Penev P, Van Cauter E. The metabolic consequences of sleep deprivation. Sleep Med Rev 2007;11:163–78.ArticlePubMedPMC
42. Spiegel K, Knutson K, Leproult R, Tasali E, Van Cauter E. Sleep loss: a novel risk factor for insulin resistance and type 2 diabetes. J Appl Physiol (1985) 2005;99:2008–19.ArticlePubMed
43. van Leeuwen WM, Lehto M, Karisola P, Lindholm H, Luukkonen R, Sallinen M, et al. Sleep restriction increases the risk of developing cardiovascular diseases by augmenting proinflammatory responses through IL-17 and CRP. PLoS One 2009;4:e4589.ArticlePubMedPMC
44. Gutierrez-Repiso C, Soriguer F, Rubio-Martin E, Esteva de Antonio I, Ruiz de Adana MS, Almaraz MC, et al. Nighttime sleep duration and the incidence of obesity and type 2 diabetes: findings from the prospective Pizarra study. Sleep Med 2014;15:1398–404.ArticlePubMed
45. Stefan L, Sporis G, Kristicevic T, Knjaz D. Associations between sleep quality and its domains and insufficient physical activity in a large sample of Croatian young adults: a crosssectional study. BMJ Open 2018;8:e021902.ArticlePubMedPMC
46. Kim J, Jo I. Age-dependent association between sleep duration and hypertension in the adult Korean population. Am J Hypertens 2010;23:1286–91.ArticlePubMed
47. Hairston KG, Bryer-Ash M, Norris JM, Haffner S, Bowden DW, Wagenknecht LE. Sleep duration and five-year abdominal fat accumulation in a minority cohort: the IRAS family study. Sleep 2010;33:289–95.ArticlePubMedPMC
48. Ohayon MM, Carskadon MA, Guilleminault C, Vitiello MV. Meta-analysis of quantitative sleep parameters from childhood to old age in healthy individuals: developing normative sleep values across the human lifespan. Sleep 2004;27:1255–73.ArticlePubMed
49. Lauderdale DS, Knutson KL, Yan LL, Liu K, Rathouz PJ. Self-reported and measured sleep duration: how similar are they? Epidemiology 2008;19:838–45.PubMedPMC
50. Kim JH, Jung DH, Kwon YJ, Lee JI, Shim JY. The impact of the sleep duration on NAFLD score in Korean middle-aged adults: a community-based cohort study. Sleep Med 2019;57:144–50.ArticlePubMed
Figure & Data
References
Citations
Citations to this article as recorded by
Attention to Innate Circadian Rhythm and the Impact of Its Disruption on Diabetes Da Young Lee, Inha Jung, So Young Park, Ji Hee Yu, Ji A Seo, Kyeong Jin Kim, Nam Hoon Kim, Hye Jin Yoo, Sin Gon Kim, Kyung Mook Choi, Sei Hyun Baik, Nan Hee Kim Diabetes & Metabolism Journal.2024; 48(1): 37. CrossRef
Role of Sleep and Sleep Disorders in Cardiometabolic Risk: a Review and Update Shaden O. Qasrawi, Ahmed S. BaHammam Current Sleep Medicine Reports.2024; 10(1): 34. CrossRef
Evaluating reliability in wearable devices for sleep staging Vera Birrer, Mohamed Elgendi, Olivier Lambercy, Carlo Menon npj Digital Medicine.2024;[Epub] CrossRef
All That Glitters Is Not Gold: The Same Sleep Time, but Different Diabetogenic Outcomes Bohye Kim, Obin Kwon Endocrinology and Metabolism.2023; 38(1): 78. CrossRef
The Link Between Sleeping and Type 2 Diabetes: A Systematic Review Ali Darraj Cureus.2023;[Epub] CrossRef

 KES
KES
 Keypoint
 , Inha Jung1, So Young Park1, Ji Hee Yu1, Ji A Seo1, Kyeong Jin Kim1, Nam Hoon Kim1, Hye Jin Yoo1, Sin Gon Kim1, Kyung Mook Choi1, Sei Hyun Baik1, Seung Ku Lee2, Chol Shin2



 PubReader
 ePub Link
 Cite
Cite XML Download