Articles
- Page Path
- HOME > Endocrinol Metab > Volume 31(3); 2016 > Article
-
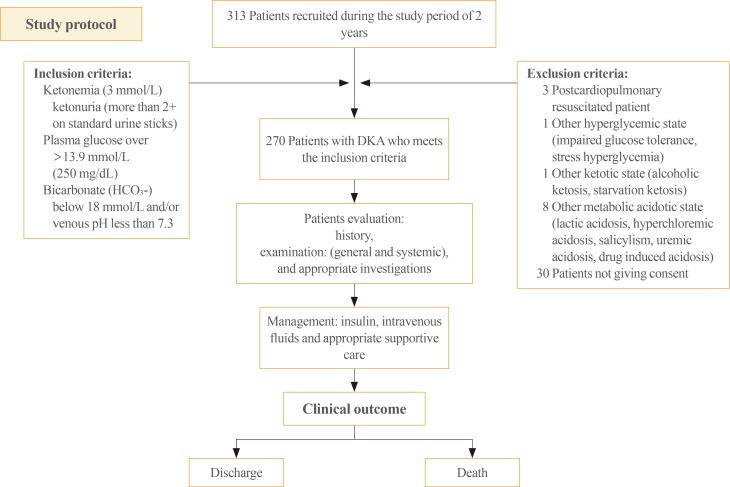
Original ArticleClinical Study Prognostic Factors in Patients Hospitalized with Diabetic Ketoacidosis
- Avinash Agarwal1, Ambuj Yadav1, Manish Gutch1, Shuchi Consul2, Sukriti Kumar3, Ved Prakash4, Anil Kumar Gupta5, Annesh Bhattacharjee1
-
Endocrinology and Metabolism 2016;31(3):424-432.
DOI: https://doi.org/10.3803/EnM.2016.31.3.424
Published online: September 1, 2016
1Department of Medicine, King George's Medical College, Lucknow, India.
2Department of Obstetrics and Gynecology, King George's Medical College, Lucknow, India.
3Department of Radiodiagnosis, King George's Medical College, Lucknow, India.
4Department of Pulmonary Medicine, King George's Medical College, Lucknow, India.
5Department of Physical Medicine and Rehabilitation, King George's Medical College, Lucknow, India.
- Corresponding author: Manish Gutch. Department of Medicine, King George's Medical College, Chowk, Shah Mina Road, Lucknow 226003, India. Tel: +91-522-2257242, Fax: +91-522-2258797, manish07gutch@gmail.com
Copyright © 2016 Korean Endocrine Society
This is an Open Access article distributed under the terms of the Creative Commons Attribution Non-Commercial License (http://creativecommons.org/licenses/by-nc/4.0/) which permits unrestricted non-commercial use, distribution, and reproduction in any medium, provided the original work is properly cited.


Figure & Data
References
Citations
- Prognosis of patients with extreme acidosis on admission to the emergency department: A retrospective cohort study
Amichai Gutgold, Shaden Salameh, Jeries Nashashibi, Yonatan Gershinsky
The American Journal of Emergency Medicine.2024; 76: 36. CrossRef - The critical role of pen needles and training in insulin delivery
Tracey Sainsbury
British Journal of Nursing.2024; 33(5): 242. CrossRef - Clinical characteristics of people with diabetic ketoacidosis at a clinic in The Gambia: a retrospective study
Orighomisan F Agboghoroma, Modou Jobe, Karen Forrest
Journal of Endocrinology, Metabolism and Diabetes of South Africa.2023; 28(1): 14. CrossRef - Elevated alanine transaminase is nonlinearly associated with in-hospital death in ICU-admitted diabetic ketoacidosis patients
Qiaoling Liu, Chen Gong, Yunjie Geng, Jiuhong You
Diabetes Research and Clinical Practice.2023; 197: 110555. CrossRef - Diabetic keto-acidosis in pancreatic diabetes – how is it different from DKA in type 1 or type 2 DM?
Sunetra Mondal, Riddhi DasGupta, Moushumi Lodh, Ashok Parida, Mandira Haldar, Arunangshu Ganguly
International Journal of Diabetes in Developing Countries.2023;[Epub] CrossRef - Comparative study of diabetic ketoacidosis in the elderly and non-elderly patients: A nine-year experience from an academic hospital in North India
Ashok Kumar Pannu, Ravindran Kiran, Abhishek Kumar, Saurabh Chandrabhan Sharda, Mandip Bhatia, Atul Saroch, Pinaki Dutta, Navneet Sharma
Diabetes & Metabolic Syndrome: Clinical Research & Reviews.2023; 17(12): 102903. CrossRef - Clinical Profile and Outcome of Diabetic Ketoacidosis in Type 1 and Type 2 Diabetes: A Comparative Study
Sachin Kamle, Madhuri Holay, Prashant Patil, Parimal Tayde
Vidarbha Journal of Internal Medicine.2022; 32: 21. CrossRef - Effect of subjective tool based aerobic exercise on pulmonary functions in patients with type 2 diabetes mellitus – a feasibility RCT
M. Saini, J. Kaur
Comparative Exercise Physiology.2022; 18(3): 239. CrossRef - Clinical characteristics and outcomes of care in patients hospitalized with diabetic ketoacidosis
Mohsen S. Eledrisi, Haifaa Alkabbani, Malk Aboawon, Aya Ali, Imad Alabdulrazzak, Maab Elhaj, Ashraf Ahmed, Hazim Alqahwachi, Joanne Daghfal, Salem A. Beshyah, Rayaz A. Malik
Diabetes Research and Clinical Practice.2022; 192: 110041. CrossRef - An Audit of Factors Impacting the Time to Resolution of the Metabolic Parameters in Diabetic Ketoacidosis Patients
Muath F AlWahbi , Sami H Alharbi, Saleh A Almesned, Faisal A Alfawzan, Rayan T Alsager, Abdullah A AlHojailan, Emad A Alfadhel, Fahad G Al-Harbi
Cureus.2022;[Epub] CrossRef - Incidence of Diabetic Ketoacidosis among Adults with Type 1 Diabetes in Saudi Arabia: Systematic review
Ayoub Ali Alshaikh, Rawan Zaifallh Alsalman, Nada Hamzah Albarqi, Razan Salem Alqahtani, Ali Ahmed Almontashri, Atheer Saud Alshahrani, Mohammed Abdullah Alshehri
Pharmacophore.2022; 13(4): 105. CrossRef - Features and long‐term outcomes of patients hospitalized for diabetic ketoacidosis
Michal Michaelis, Tzippy Shochat, Ilan Shimon, Amit Akirov
Diabetes/Metabolism Research and Reviews.2021;[Epub] CrossRef - Incidence, characteristics and long-term outcomes of patients with diabetic ketoacidosis: a prospective prognosis cohort study in an emergency department
Rachel Teixeira Leal Nunes, Carolina Frade Magalhães Girardin Pimentel Mota, Paulo Ricardo Gessolo Lins, Fernanda Salles Reis, Thais Castanheira de Freitas Resende, Ludmila de Andrade Barberino, Pedro Henrique Luiz da Silva, Aecio Flavio Teixeira de Gois
Sao Paulo Medical Journal.2021; 139(1): 10. CrossRef - Management of diabetic ketoacidosis in special populations
Mohsen S. Eledrisi, Salem A. Beshyah, Rayaz A. Malik
Diabetes Research and Clinical Practice.2021; 174: 108744. CrossRef - Profile of diabetic ketoacidosis at the National Diabetes and Endocrine Center in Tripoli, Libya, 2015
Aida Elkituni, Halla Elshwekh, Nesrein M. Bendala, Wafeya S. Atwear, Fawzia A. Aldaba, Abdulmunam M. Fellah
Diabetes & Metabolic Syndrome: Clinical Research & Reviews.2021; 15(3): 771. CrossRef - Frequency of Diabetic Ketoacidosis and Its Determinants Among Pediatric Diabetes Mellitus Patients in Northwest Ethiopia
Atitegeb Abera Kidie, Ayenew Molla Lakew, Tiruneh Ayele
Diabetes, Metabolic Syndrome and Obesity: Targets and Therapy.2021; Volume 14: 4819. CrossRef - Diabetic ketoacidosis
Ketan K. Dhatariya, Nicole S. Glaser, Ethel Codner, Guillermo E. Umpierrez
Nature Reviews Disease Primers.2020;[Epub] CrossRef - Risk and Relevance of Insulin Pump Therapy in the Aetiology of Ketoacidosis in People with Type 1 Diabetes
Lena Christina Giessmann, Peter Herbert Kann
Experimental and Clinical Endocrinology & Diabetes.2020; 128(11): 745. CrossRef - Clinical and biochemical profile, precipitants and prognostic factors of diabetic ketoacidosis: A retrospective study from a tertiary care center of north India
Harpreet Singh, Atul Saroch, Ashok Kumar Pannu, H.J. Sachin, Navneet Sharma, Pinaki Dutta
Diabetes & Metabolic Syndrome: Clinical Research & Reviews.2019; 13(4): 2357. CrossRef - Sudden death due to diabetic ketoacidosis following power failure of an insulin pump: Autopsy and pump data
Mette Louise Blouner Gram Kjærulff, Birgitte Schmidt Astrup
Journal of Forensic and Legal Medicine.2019; 63: 34. CrossRef - Defining and characterising diabetic ketoacidosis in adults
Ketan K. Dhatariya
Diabetes Research and Clinical Practice.2019; 155: 107797. CrossRef - Effects of diabetic ketoacidosis in the respiratory system
Alice Gallo de Moraes, Salim Surani
World Journal of Diabetes.2019; 10(1): 16. CrossRef - Increasing Hospitalizations for DKA: A Need for Prevention Programs
Priyathama Vellanki, Guillermo E. Umpierrez
Diabetes Care.2018; 41(9): 1839. CrossRef - Guidelines and controversies in the management of diabetic ketoacidosis – A mini-review
Tasnim Islam, Khalid Sherani, Salim Surani, Abhay Vakil
World Journal of Diabetes.2018; 9(12): 226. CrossRef - Closing the Mortality Gap in Diabetic Ketoacidosis and Hyperosmolar Hyperglycemic State: Implications of a Clinical Decision Support App
Saperstein Y, Park J, McFarlane SI
International Journal of Clinical Endocrinology and Metabolism.2018; : 008. CrossRef - Incidence and prevalence of diabetic ketoacidosis (DKA) among adults with type 1 diabetes mellitus (T1D): a systematic literature review
Soulmaz Fazeli Farsani, Kimberly Brodovicz, Nima Soleymanlou, Jan Marquard, Erika Wissinger, Brett A Maiese
BMJ Open.2017; 7(7): e016587. CrossRef
 PubReader
 Cite
Cite